

A self-supervised framework for laboratory data imputation in electronic health records
Open accessThe DOI matches its Crossref record; 31 of the 31 references it cites were found in a registry or an index.
Abstract
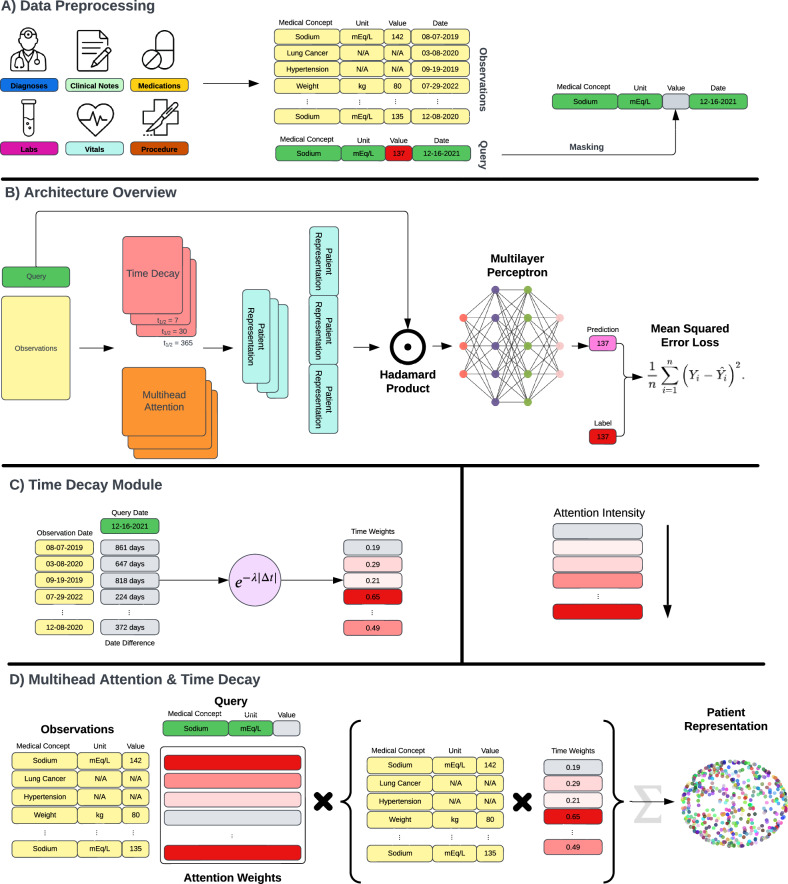
Laboratory data in electronic health records (EHRs) is an effective source of information to characterize patient populations, inform accurate diagnostics and treatment decisions, and fuel research studies. However, despite their value, laboratory values are underutilized due to high levels of missingness. Existing imputation methods fall short, as they do not fully leverage patient clinical histories and are commonly not scalable to the large number of tests available in real-world data (RWD). To address these shortcomings, we present Laboratory Imputation Framework for EHRs (LIFE), a self-supervised learning framework based on multi-head attention that is trained to impute any laboratory test value at any point in time in the patient’s journey using their complete EHRs. This architecture (1) eliminates the need to train a different model for each laboratory test by jointly modeling all laboratory data of interest; and (2) better clinically contextualizes the predictions by leveraging additional EHR variables, such as diagnosis, medications, and discrete laboratory results. We validate our framework using a large-scale, real-world dataset encompassing over 1 million oncology patients. Our results demonstrate that LIFE obtains superior or equivalent results compared to state-of-the-art baseline methods in 23 out of 25 evaluated laboratory tests and better enhances a downstream adverse event detection task in 7 out of 9 cases. LIFE shows promise in accurately estimating missing laboratory values and enhancing the utilization of large-scale RWD in healthcare. This advancement could lead to better clinical models, more informed decision-making and improved patient outcomes. Electronic health records (EHRs) contain laboratory test results that are crucial for modeling and analyzing patient health and outcomes. However, many laboratory test results are often missing, which limits their usefulness. Current automated methods to fill these gaps are not very effective because they generally do not utilize all available patient clinical information and cannot handle a wide variety of tests. To address this issue, we present Laboratory Imputation Framework for EHRs (LIFE), a model that predicts missing laboratory results at any point in time by analyzing a patient’s entire health record, including diagnoses and medications. Tested on data from over a million cancer patients, LIFE outperformed other methods in predicting laboratory results and improved the detection of several clinical adverse events. This tool could lead to better clinical models, potentially enhancing healthcare decisions and improving patient outcomes. Heilbroner et al. present LIFE, a self-supervised learning framework for imputing laboratory test values at any point in a patient’s journey using electronic health records. LIFE generally outperforms state-of-the-art baselines and enhances adverse event detection when tested on over 1 million oncology records.
Overview
The claims and statistics of this paper haven’t been checked yet.
Free: it reads the open-access text and checks the first 5 claims that cite a source we can check. Create a free account to check every claim.
Integrity signals
Registry
Cites
Statistics
Figures



Verification
Claims the paper makes
The claims and statistics of this paper haven’t been checked yet.
Free: it reads the open-access text and checks the first 5 claims that cite a source we can check. Create a free account to check every claim.
Claims other papers make about this one
Each is checked against this paper’s own text: does it say what the citing paper says it does?
The check wasn’t confident either way, so it gives no verdict — never disputed.
In the citing paper
“Both processes require collaboration among IT teams, data stewards, and business users [93].”
From Data Quality in the Age of AI: A Review of Governance, Ethics, and the FAIR Principles (2025) · cites this paper as [93]
Experimental — accuracy not yet measured
Self-check
Percentages, sums and reported differences re-computed from the paper’s own numbers.
The self-check needs the paper’s full text.
Citations
Cites
Vaswani, A., Shazeer, N., Parmar, N., Uszkoreit, J., Jones, L., Gomez, A. N., Kaiser, L., & Polosukhin, I. (2017) · arXiv · doi:10.48550/arxiv.1706.03762 · Cited by 120,404 · cited 2×
“Traditionally, token position is encoded using embeddings – for example, in the original trans-former method described by Vaswani et al, positional information is encoded using sine and cosine functions of each token ’ s discrete positon 19 .”
LeCun, Y., Bengio, Y., & Hinton, G. (2015) · Nature · doi:10.1038/nature14539 · Cited by 84,126
BERT: Pre-training of Deep Bidirectional Transformers for Language Understanding
Devlin, J., Chang, M.-W., Lee, K., & Toutanova, K. (2018) · arXiv · doi:10.48550/arxiv.1810.04805 · Cited by 73,173
mice: Multivariate Imputation by Chained Equations in R
Buuren, S. V., & Groothuis-Oudshoorn, K. (2011) · Journal of Statistical Software · doi:10.18637/jss.v045.i03 · Cited by 13,870 · cited 7×
“Detailed pseudocode is provided in the appendix (Supplementary Algorithms 1 – 6).”
InfluentialMIMIC-III, a freely accessible critical care database
Johnson, A. E. W., Pollard, T. J., Shen, L., Lehman, L.-W. H., Feng, M., Ghassemi, M., Moody, B., Szolovits, P., Anthony Celi, L., & Mark, R. G. (2016) · Scientific Data · doi:10.1038/sdata.2016.35 · Cited by 8,141 · cited 2×
“…on clean, homogenous, regularly sampled ICU data from a single institution, such as the Medical Information Mart for Intensive Care (MIMIC) datasets 13 , and have not been tested on the heterogeneous, irregularly sampled, outpatient and inpatient RWD from multiple institutions, which is more…”
Large Scale Distributed Deep Networks
Dean, J. B., Corrado, G. S., Monga, R., Chen, K., Devin, M., Mao, M., Ranzato, M., Senior, A., Tucker, P. A., Yang, K., et al. (2012) · neural information processing systems · Cited by 4,489
Multiple imputation by chained equations: what is it and how does it work?
Azur, M. J., Stuart, E. A., Frangakis, C., & Leaf, P. J. (2011) · International Journal of Methods in Psychiatric Research · doi:10.1002/mpr.329 · Cited by 3,542
Deep learning for healthcare: review, opportunities and challenges
Miotto, R., Wang, F., Wang, S., Jiang, X., & Dudley, J. T. (2018) · Briefings in Bioinformatics · doi:10.1093/bib/bbx044 · Cited by 3,076 · cited 1×
“Recent advances in deep learning 14 and self-supervised learning 15 are enabling new ways to leverage EHRs for personalized healthcare 16 – 18 , and provide an opportunity to address the challenges discussed above.”
Self-citationRecurrent Neural Networks for Multivariate Time Series with Missing Values
Che, Z., Purushotham, S., Cho, K., Sontag, D., & Liu, Y. (2018) · Scientific Reports · doi:10.1038/s41598-018-24271-9 · Cited by 2,370 · cited 2×
“…Estimation in Multivariate Time Series Data (MD-MTS) 7 , Gaussian processes such as 3D-MICE 8 , and deep learning architectures, such as Bidirectional Recurrent Imputation for Time Series (BRITS) 9 , Multi-directional Recurrent Neural Networks (M-RNN) 10 , and Gated Recurrent Unit with Decay 11 .”
Shickel, B., Tighe, P. J., Bihorac, A., & Rashidi, P. (2018) · IEEE Journal of Biomedical and Health Informatics · doi:10.1109/jbhi.2017.2767063 · Cited by 1,688 · cited 1×
“Detailed pseudocode is provided in the appendix (Supplementary Algorithms 1 – 6).”
Research works printed but not linked: 2
- Yoon, J. & Zame, W. R. Multi-directional recurrent neural networks: a novel method for estimating missing data. InTime series workshop in international conference on machine learning 2017 Nov.
- Ma, C. & Zhang, C. Identifiable generative models for missing not at random data imputation. Adv. Neural Inf. Process Syst 34, 27645–2758 (2021).
Cited by
Data Quality in the Age of AI: A Review of Governance, Ethics, and the FAIR Principles
Guillen-Aguinaga, M., Aguinaga-Ontoso, E., Guillen-Aguinaga, L., Guillen-Grima, F., & Aguinaga-Ontoso, I. (2025) · Data · doi:10.3390/data10120201 · Cited by 37
“In healthcare, incomplete patient records can obscure critical patterns, delaying medical discoveries and compromising research progress [91–93].”
Metadata
- Authors
- Heilbroner, S. P., Carter, C., Vidmar, D. M., Mueller, E. T., Stumpe, M. C., & Miotto, R.
- Affiliations
- Tempus Labs (United States) (US)
- Corresponding author
- Miotto, Riccardo
- Venue
- Communications Medicine
- Published
- 2025-07-01
- Volume
- 5
- Issue
- 1
- Pages
- 251-251
- ISSN
- 2730-664X (ISSN-L)
- PMC
- PMC12216283
- OpenAlex
- W4411857863
- Cited by
- 1
- References
- 28
- Citations by year
- 2025: 1
- FWCI
- 0.40
- Type
- journal article
- Language
- en
- Open access
- gold
- doi.org
- Licence
- cc-by-nc-nd
- creativecommons.org/licenses/by-nc-nd/4.0 (tdm)
- creativecommons.org/licenses/by-nc-nd/4.0 (vor)
- Locations
- Communications Medicine (publishedVersion, cc-by-nc-nd)
- PubMed Central (publishedVersion, cc-by-nc-nd)
- PubMed (publishedVersion)
- DOAJ (DOAJ: Directory of Open Access Journals) (submittedVersion, cc-by-sa)
- Topics
- Physical Sciences › Computer Science › Artificial Intelligence › Machine Learning in Healthcare
- Health Sciences › Health Professions › Health Information Management › Electronic Health Records Systems
- Health Sciences › Health Professions › Health Information Management › Medical Coding and Health Information
- Keywords
- electronic health records, self-supervised learning, multi-head attention, real-world data, cancer patients, adverse event detection, clinical decision support, missing data imputation, clinical natural language processing, clinical decision support systems
About these checks
Registry, retraction, Cites and statistics results are computed, not judged, with one exception: a printed reference that no index lists is read once by a model before it counts as a citation error. Claims are extracted by a model and kept only when their quote appears verbatim in the text; each cited source is then checked, with a model’s help, for whether it says what the claim relies on. Those verdicts can be wrong — read the claim’s quote and the cited source before relying on one.
Statistics and arithmetic are recomputed, not judged.
Confidence bands are shown only for fields calibrated on our annotated test set. None is calibrated yet, so no band is shown.
What counts as a claim ›How we measure confidence ›How we check this ›
Are you an author, or do you see a problem with this page? Request a review
How to cite
Cite CoChat for the checks on this page, and the paper for its own findings.
- This page
- CoChat. (2026). Citation check: A self-supervised framework for laboratory data imputation in electronic health records. https://app.cochat.ai/papers/10.1038/s43856-025-00973-w
- The paper
- Heilbroner, S. P., Carter, C., Vidmar, D. M., Mueller, E. T., Stumpe, M. C., & Miotto, R. (2025). A self-supervised framework for laboratory data imputation in electronic health records. Communications Medicine. https://doi.org/10.1038/s43856-025-00973-w
Data sources
Bibliographic data: Semantic Scholar, OpenAlex, Crossref.
Contains information from the Semantic Scholar Academic Graph Datasets, made available under the ODC Attribution License (ODC-BY 1.0).
Semantic Scholar’s data is described in: Kinney, R., et al. (2023). The Semantic Scholar Open Data Platform. arXiv:2301.10140.
