Cited by 31Endoplasmic Reticulum Stress and DiseaseCellular transport and secretionIon Channels and Receptors

The DOI matches its Crossref record; 6 of the 6 references it cites were found in a registry or an index.

Activation of goblet-cell stress sensor IRE1β is controlled by the mucin chaperone AGR2

Open access

Published version of a preprint

Abstract

Intestinal goblet cells are secretory cells specialized in the production of mucins, and as such are challenged by the need for efficient protein folding. Goblet cells express Inositol-Requiring Enzyme-1β (IRE1β), a unique sensor in the unfolded protein response (UPR), which is part of an adaptive mechanism that regulates the demands of mucin production and secretion. However, how IRE1β activity is tuned to mucus folding load remains unknown. We identified the disulfide isomerase and mucin chaperone AGR2 as a goblet cell-specific protein that crucially regulates IRE1β-, but not IRE1α-mediated signaling. AGR2 binding to IRE1β disrupts IRE1β oligomerization, thereby blocking its downstream endonuclease activity. Depletion of endogenous AGR2 from goblet cells induces spontaneous IRE1β activation, suggesting that alterations in AGR2 availability in the endoplasmic reticulum set the threshold for IRE1β activation. We found that AGR2 mutants lacking their catalytic cysteine, or displaying the disease-associated mutation H117Y, were no longer able to dampen IRE1β activity. Collectively, these results demonstrate that AGR2 is a central chaperone regulating the goblet cell UPR by acting as a rheostat of IRE1β endonuclease activity.

Overview

The claims and statistics of this paper haven’t been checked yet.

Run the check — free, no account needed. It reads the open-access text and checks the sources it cites.

A few free checks a day · papers already verified open instantly · results are public

Integrity signals

Registry

Crossref · 10.1038/s44318-023-00015-y

Cites

6 of 6 references verified0 citation errors · 0 not checkable

Statistics

Figures

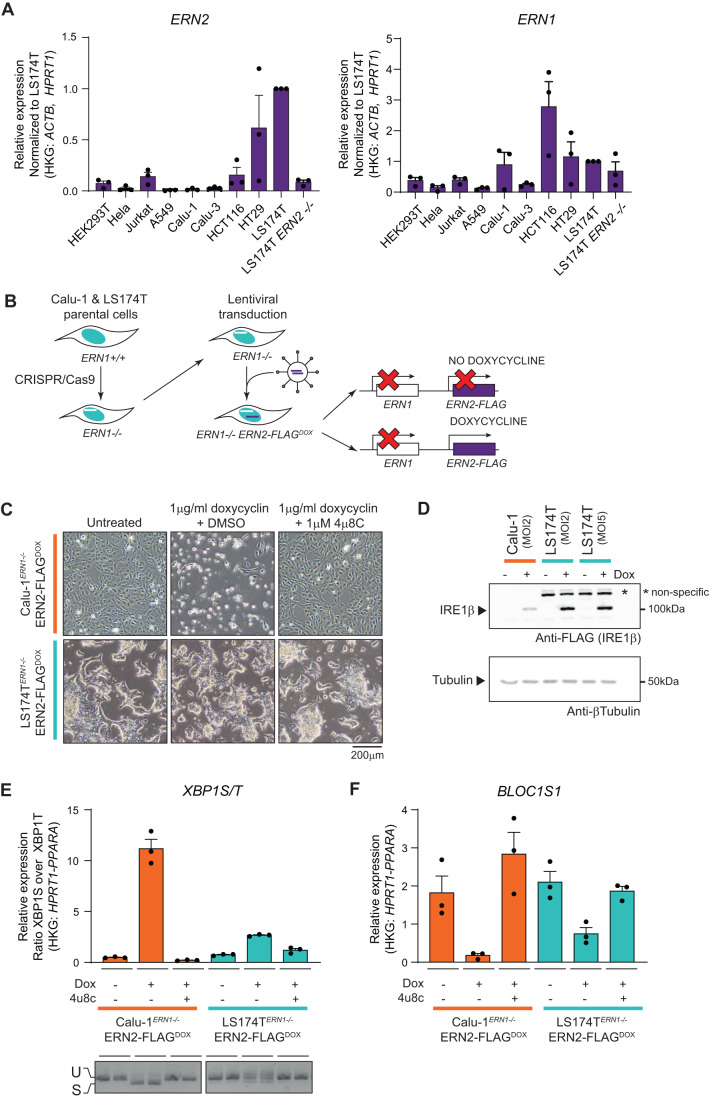
Figure 1 IRE1β activity is attenuated upon overexpression in goblet cells. (A) RT-qPCR analysis of ERN2 (IRE1β) and ERN1 (IRE1α) transcript expression in human cell lines. N = 3 culture dishes were sampled and transcript levels are shown relative to the expression in LS174T parental cells. Error bars show SEM. (B) Schematic representation of cell lines used for further studies. First, ERN1−/− clones of the LS174T and Calu-1 parental lines were established by CRISPR/Cas9. Then, ERN1−/− cells were transduced with a TetOn module for doxycycline-controlled IRE1β-FLAG expression. (C) Photographs showing the phenotype of cultures overexpressing IRE1β-FLAG. Left panels show untreated cultures, middle panels show cultures that received 1 μg/ml doxycycline for 72 h (and thus express IRE1β-FLAG), cultures in the right panels received 1 μg/ml doxycycline and 1 μM IRE1 endonuclease inhibitor 4μ8C. Scale bar represents 200 µm. Representative of three independent experiments. (D) Western blot verifying transgene expression in the cell lines used in (C). All remaining adherent cells after 24 h of transgene induction were collected and lysates were probed for FLAG-IRE1β expression via immunoblot. Tubulin was used as a loading control. Multiplicity of Infection (MOI) indicates the theoretical number of viral particles added. (E, F) RT-qPCR analysis of XBP1S/T (E) and BLOC1S1 transcript levels (F) after 24 h of transgene induction. Representative of three independent experiments with three replicates per condition. Error bars show SEM. (E) bottom picture shows XBP1 splicing in the same samples assayed by conventional PCR, representative of two independent experiments. The fast-migrating band is the spliced XBP1 transcript, and the slow-migrating band the XBP1 unspliced transcript. Source data are available online for this figure.
Figure 1 IRE1β activity is attenuated upon overexpression in goblet cells. (A) RT-qPCR analysis of ERN2 (IRE1β) and ERN1 (IRE1α) transcript expression in human cell lines. N = 3 culture dishes were sampled and transcript levels are shown relative to the expression in LS174T parental cells. Error bars show SEM. (B) Schematic representation of cell lines used for further studies. First, ERN1−/− clones of the LS174T and Calu-1 parental lines were established by CRISPR/Cas9. Then, ERN1−/− cells were transduced with a TetOn module for doxycycline-controlled IRE1β-FLAG expression. (C) Photographs showing the phenotype of cultures overexpressing IRE1β-FLAG. Left panels show untreated cultures, middle panels show cultures that received 1 μg/ml doxycycline for 72 h (and thus express IRE1β-FLAG), cultures in the right panels received 1 μg/ml doxycycline and 1 μM IRE1 endonuclease inhibitor 4μ8C. Scale bar represents 200 µm. Representative of three independent experiments. (D) Western blot verifying transgene expression in the cell lines used in (C). All remaining adherent cells after 24 h of transgene induction were collected and lysates were probed for FLAG-IRE1β expression via immunoblot. Tubulin was used as a loading control. Multiplicity of Infection (MOI) indicates the theoretical number of viral particles added. (E, F) RT-qPCR analysis of XBP1S/T (E) and BLOC1S1 transcript levels (F) after 24 h of transgene induction. Representative of three independent experiments with three replicates per condition. Error bars show SEM. (E) bottom picture shows XBP1 splicing in the same samples assayed by conventional PCR, representative of two independent experiments. The fast-migrating band is the spliced XBP1 transcript, and the slow-migrating band the XBP1 unspliced transcript. Source data are available online for this figure.CC BY · PubMed Central
Figure EV1 Validation of LS174TERN1-/-IRE1βFLAG-DOX and Calu-1 ERN1-/-IRE1βFLAG-DOX model systems. (A) IRE1β expression in cell lines. Proteins were extracted and probed for IRE1β expression via immunoblot. Tubulin was used as a loading control. (B) Photographs showing the phenotype of cultures overexpressing IRE1β-FLAG in IRE1α wild-type (ERN1+/+) and IRE1α deficient (ERN1−/−) cells. Images of IRE1α deficient (ERN1−/_) cultures are the same images as shown in Fig. 1C. Left panels show untreated cultures, middle panels show cultures treated with 1 μg/ml doxycycline for 72 hours, right panels show cultures treated with both 1 μg/ml doxycycline and 1 μM IRE1 endonuclease inhibitor 4μ8C. Scale bar represents 200 µm. (C) Quantification of IRE1β transgene expression over time in Calu-1ERN1-/-IRE1βFLAG-DOX and LS174TERN1-/-IRE1βFLAG-DOX cells by western blot. Cultures were treated with 1 μg/ml doxycycline for the indicated times, protein lysates were probed for IRE1β-FLAG expression and tubulin as a loading control.
Figure EV1 Validation of LS174TERN1-/-IRE1βFLAG-DOX and Calu-1 ERN1-/-IRE1βFLAG-DOX model systems. (A) IRE1β expression in cell lines. Proteins were extracted and probed for IRE1β expression via immunoblot. Tubulin was used as a loading control. (B) Photographs showing the phenotype of cultures overexpressing IRE1β-FLAG in IRE1α wild-type (ERN1+/+) and IRE1α deficient (ERN1−/−) cells. Images of IRE1α deficient (ERN1−/_) cultures are the same images as shown in Fig. 1C. Left panels show untreated cultures, middle panels show cultures treated with 1 μg/ml doxycycline for 72 hours, right panels show cultures treated with both 1 μg/ml doxycycline and 1 μM IRE1 endonuclease inhibitor 4μ8C. Scale bar represents 200 µm. (C) Quantification of IRE1β transgene expression over time in Calu-1ERN1-/-IRE1βFLAG-DOX and LS174TERN1-/-IRE1βFLAG-DOX cells by western blot. Cultures were treated with 1 μg/ml doxycycline for the indicated times, protein lysates were probed for IRE1β-FLAG expression and tubulin as a loading control.CC BY · PubMed Central
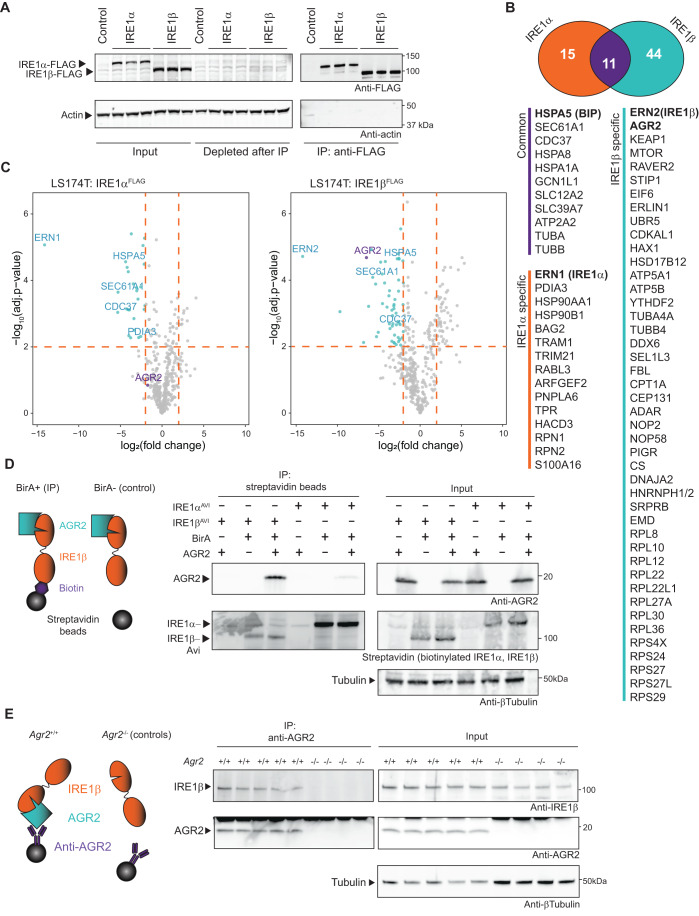
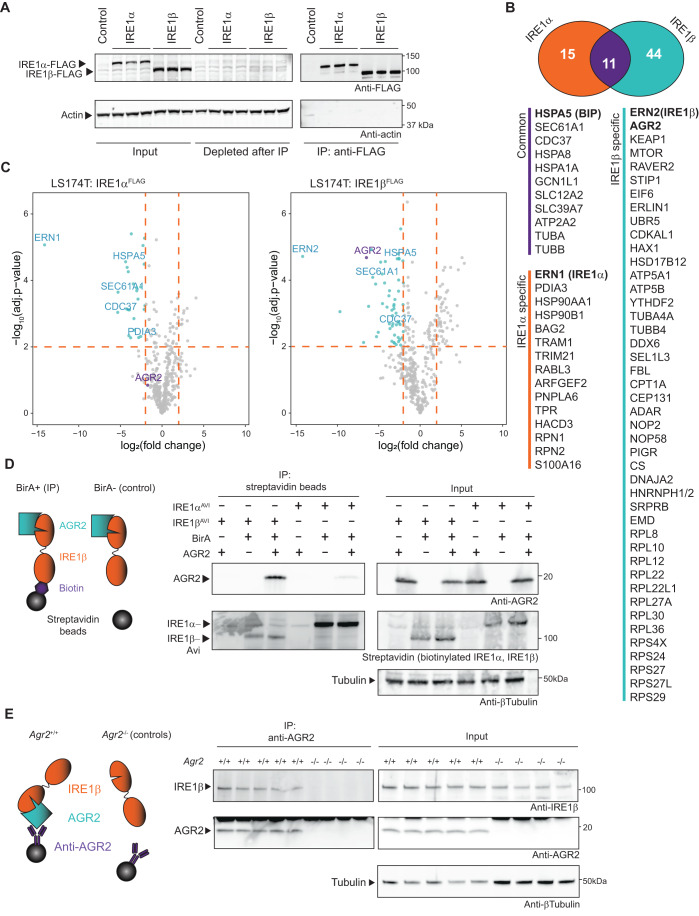
Figure 2 The mucin chaperone AGR2 is a goblet cell-specific interactor of IRE1β. (A) Verification of transgene expression and successful immunoprecipitation of FLAG-tagged IRE1 in the samples analyzed by MS in (B, C). Lysates were probed for IRE1-FLAG expression using anti-FLAG, and actin was used as a loading control. (B) Proteins with a log2FC enrichment of >2 and log10Adj P value of >2 for IRE1α-FLAG and IRE1β-FLAG immunoprecipitation (IP) compared to control cells. The Venn diagram shows the number of proteins that were detected uniquely associated with one of the two IRE1 paralogues or that were commonly identified with both IRE1 paralogues. (C) Volcano plot depicting the cutoff criteria and significantly enriched proteins in each IP. X axis shows the log2 fold change of the measured peptide intensities of a given protein in the control condition over the IRE1 IP condition. Y axis shows the FDR corrected P value obtained by two-sample t test in Perseus. (D) Confirmation of specific interaction between AGR2 and IRE1β, but not IRE1α. IRE1 proteins were tagged with an Avi-tag that is specifically biotinylated upon BirA co-expression. The biotinylated Avi-tag was precipitated using streptavidin beads. For control conditions, BirA was omitted. Blots were probed for co-precipitation of AGR2 and streptavidin to detect Avi-tag-biotinylated IRE1. Tubulin was used as a loading control. Non-specific signal is indicated with an asterisk. Representative of two independent experiments. (E) Confirmation of the AGR2-IRE1β interaction in murine tissue. Colons were isolated and digested, and IP was performed using anti-AGR2. Agr2-deficient mice were used as a negative control to assess whether IRE1β binds specifically to the antibody/bead complex. IP samples were probed for IRE1β co-precipitation via immunoblot. Tubulin was used as a loading control. Representative of two independent experiments. Source data are available online for this figure.
Figure 2 The mucin chaperone AGR2 is a goblet cell-specific interactor of IRE1β. (A) Verification of transgene expression and successful immunoprecipitation of FLAG-tagged IRE1 in the samples analyzed by MS in (B, C). Lysates were probed for IRE1-FLAG expression using anti-FLAG, and actin was used as a loading control. (B) Proteins with a log2FC enrichment of >2 and log10Adj P value of >2 for IRE1α-FLAG and IRE1β-FLAG immunoprecipitation (IP) compared to control cells. The Venn diagram shows the number of proteins that were detected uniquely associated with one of the two IRE1 paralogues or that were commonly identified with both IRE1 paralogues. (C) Volcano plot depicting the cutoff criteria and significantly enriched proteins in each IP. X axis shows the log2 fold change of the measured peptide intensities of a given protein in the control condition over the IRE1 IP condition. Y axis shows the FDR corrected P value obtained by two-sample t test in Perseus. (D) Confirmation of specific interaction between AGR2 and IRE1β, but not IRE1α. IRE1 proteins were tagged with an Avi-tag that is specifically biotinylated upon BirA co-expression. The biotinylated Avi-tag was precipitated using streptavidin beads. For control conditions, BirA was omitted. Blots were probed for co-precipitation of AGR2 and streptavidin to detect Avi-tag-biotinylated IRE1. Tubulin was used as a loading control. Non-specific signal is indicated with an asterisk. Representative of two independent experiments. (E) Confirmation of the AGR2-IRE1β interaction in murine tissue. Colons were isolated and digested, and IP was performed using anti-AGR2. Agr2-deficient mice were used as a negative control to assess whether IRE1β binds specifically to the antibody/bead complex. IP samples were probed for IRE1β co-precipitation via immunoblot. Tubulin was used as a loading control. Representative of two independent experiments. Source data are available online for this figure.CC BY · PubMed Central
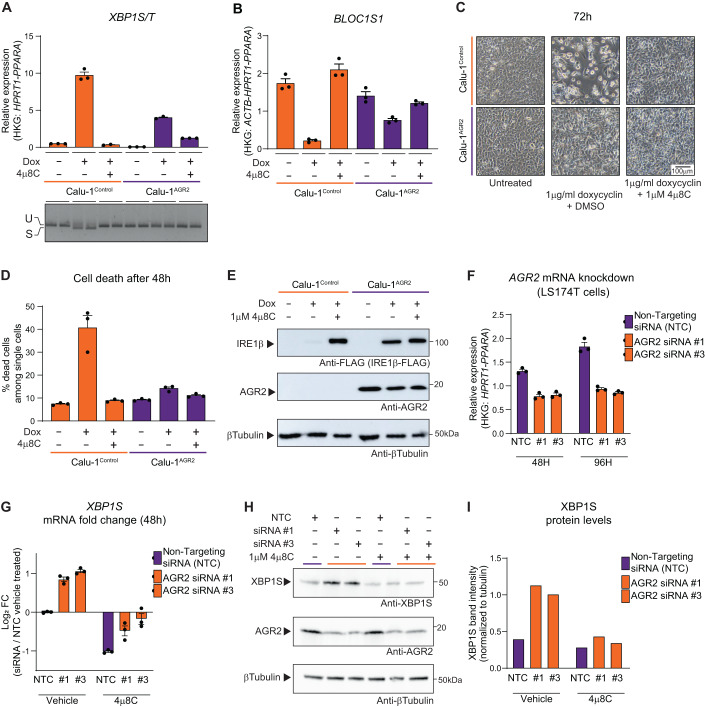
Figure 3 Co-expression of AGR2 dampens endonuclease activity of IRE1β. Calu-1ERN1-/-IRE1βFLAG-DOX cells were transduced with a constitutive AGR2 transgene (“Calu-1AGR2“). Cells denoted as “Calu-1” are the original Calu-1ERN1-/-IRE1βFLAG-DOX cells. (A) RT-qPCR analysis of XBP1S/T transcript levels after 24 h of transgene induction using 1 μg/ml doxycycline. Bottom picture shows XBP1 splicing in the same samples assayed by conventional PCR. Representative of four independent experiments with three replicate wells per condition. Error bars show SEM. (B) RT-qPCR analysis of BLOC1S1 transcript levels after 24 h of transgene induction using 1 μg/ml doxycycline. Representative of five independent experiments with three replicates per condition. Error bars show SEM. (C) Photographs showing the phenotype of cultures overexpressing IRE1β-FLAG with and without exogenous expression of AGR2. Left panels show untreated cultures, middle panels show cultures that received 1 μg/ml doxycycline for 72 h, and cultures in the right panels received 1 μg/ml doxycycline and 1 μM 4μ8C. Scale bar represents 100 µm. Representative of three independent experiments. (D) Quantification of cell death in cultures overexpressing IRE1β-FLAG with and without exogenously added AGR2 after 48 h. All cells in the culture dish were stained with Annexin V and Live/Dead stain and analyzed by flow cytometry. All single and double positive cells were considered as dead cells. Representative of two independent experiments with three replicate wells per condition. Error bars show SEM. (E) Analysis of IRE1β-FLAG and AGR2 expression in the cell lines used for (C). Only cells that remained attached in the dish were collected and lysates were probed for IRE1β expression using anti-FLAG and AGR2 expression using anti-AGR2. Tubulin was used as a loading control. (F) RT-qPCR validation of AGR2 knockdown efficiency in LS174TERN1-/-IRE1βFLAG-DOX cells. NTC is a non-targeting control pool of siRNA’s, #1 and #3 are siRNA’s targeting AGR2. Representative of three independent experiments with n = 3 replicate wells per condition. Error bars show SEM. (G) Log2 fold changes in XBP1 splicing after AGR2 partial knockdown and/or treatment with 4μ8C or DMSO (vehicle). Splicing is shown as a log2 fold change of XBP1S mRNA over the NTC/vehicle-treated cells. Representative of three independent experiments with n = 3 replicate wells per condition. Error bars show SEM. (H) Western blot confirmation of (F, G). Proteins were extracted after 72 hours and probed for XBP1S, AGR2 and tubulin expression. Representative of two independent replicates. (I) Quantification of XPP1S protein levels normalized to tubulin in n = 2 experiments represented in (H). Source data are available online for this figure.
Figure 3 Co-expression of AGR2 dampens endonuclease activity of IRE1β. Calu-1ERN1-/-IRE1βFLAG-DOX cells were transduced with a constitutive AGR2 transgene (“Calu-1AGR2“). Cells denoted as “Calu-1” are the original Calu-1ERN1-/-IRE1βFLAG-DOX cells. (A) RT-qPCR analysis of XBP1S/T transcript levels after 24 h of transgene induction using 1 μg/ml doxycycline. Bottom picture shows XBP1 splicing in the same samples assayed by conventional PCR. Representative of four independent experiments with three replicate wells per condition. Error bars show SEM. (B) RT-qPCR analysis of BLOC1S1 transcript levels after 24 h of transgene induction using 1 μg/ml doxycycline. Representative of five independent experiments with three replicates per condition. Error bars show SEM. (C) Photographs showing the phenotype of cultures overexpressing IRE1β-FLAG with and without exogenous expression of AGR2. Left panels show untreated cultures, middle panels show cultures that received 1 μg/ml doxycycline for 72 h, and cultures in the right panels received 1 μg/ml doxycycline and 1 μM 4μ8C. Scale bar represents 100 µm. Representative of three independent experiments. (D) Quantification of cell death in cultures overexpressing IRE1β-FLAG with and without exogenously added AGR2 after 48 h. All cells in the culture dish were stained with Annexin V and Live/Dead stain and analyzed by flow cytometry. All single and double positive cells were considered as dead cells. Representative of two independent experiments with three replicate wells per condition. Error bars show SEM. (E) Analysis of IRE1β-FLAG and AGR2 expression in the cell lines used for (C). Only cells that remained attached in the dish were collected and lysates were probed for IRE1β expression using anti-FLAG and AGR2 expression using anti-AGR2. Tubulin was used as a loading control. (F) RT-qPCR validation of AGR2 knockdown efficiency in LS174TERN1-/-IRE1βFLAG-DOX cells. NTC is a non-targeting control pool of siRNA’s, #1 and #3 are siRNA’s targeting AGR2. Representative of three independent experiments with n = 3 replicate wells per condition. Error bars show SEM. (G) Log2 fold changes in XBP1 splicing after AGR2 partial knockdown and/or treatment with 4μ8C or DMSO (vehicle). Splicing is shown as a log2 fold change of XBP1S mRNA over the NTC/vehicle-treated cells. Representative of three independent experiments with n = 3 replicate wells per condition. Error bars show SEM. (H) Western blot confirmation of (F, G). Proteins were extracted after 72 hours and probed for XBP1S, AGR2 and tubulin expression. Representative of two independent replicates. (I) Quantification of XPP1S protein levels normalized to tubulin in n = 2 experiments represented in (H). Source data are available online for this figure.CC BY · PubMed Central
Figure EV2 AGR2 expression is restricted to colon epithelial cell lines and affects Calu-1ERN1-/-IRE1βFLAG-DOX phenotype. (A) AGR2 (purple) and ERN2 (blue insert, same data as shown in Fig. 1A) transcript expression in cell lines assayed by RT-qPCR. N = 3 culture dishes were sampled and AGR2 and ERN2 expression is shown relative to the expression detected in LS174T parental cells. Error bars show SEM. Bottom picture shows protein expression by western blot. Protein lysates were probed for AGR2 and tubulin was used as a loading control. (B) HSPA5 (purple) and ERN1 (blue insert, same data as shown in Fig. 1A) transcript expression in cell lines assayed by RT-qPCR. N = 3 culture dishes were sampled and HSPA5 and ERN2 expression is shown relative to the expression detected in LS174T parental cells. Error bars show SEM. Bottom picture shows protein expression by western blot. Protein lysates were probed for BiP and tubulin was used as a loading control. (C) IRE1β-FLAG transgene expression over time by western blot in cell lysates derived from Calu-1ERN1-/-IRE1βFLAG-DOX co-expressing ER-targeted BirA as a control protein (left, orange), or AGR2 (right, purple). Cells received 1 μg/ml doxycycline to induce expression of IRE1β. Protein lysates were prepared at the indicated times and probed for IRE1β-FLAG expression, XBP1S and tubulin as a loading control. (D) Quantification of IRE1β-FLAG and XPP1S protein levels normalized to tubulin in three replicate experiments represented in (C). Error bars represent SEM. (E) Gating strategy to assess cell death. Doublets were gated out and dead cells were gated on via Annexin V and Live/Dead positive staining. All cells staining positive for a single, or both cell death markers were considered dead (red gate).
Figure EV2 AGR2 expression is restricted to colon epithelial cell lines and affects Calu-1ERN1-/-IRE1βFLAG-DOX phenotype. (A) AGR2 (purple) and ERN2 (blue insert, same data as shown in Fig. 1A) transcript expression in cell lines assayed by RT-qPCR. N = 3 culture dishes were sampled and AGR2 and ERN2 expression is shown relative to the expression detected in LS174T parental cells. Error bars show SEM. Bottom picture shows protein expression by western blot. Protein lysates were probed for AGR2 and tubulin was used as a loading control. (B) HSPA5 (purple) and ERN1 (blue insert, same data as shown in Fig. 1A) transcript expression in cell lines assayed by RT-qPCR. N = 3 culture dishes were sampled and HSPA5 and ERN2 expression is shown relative to the expression detected in LS174T parental cells. Error bars show SEM. Bottom picture shows protein expression by western blot. Protein lysates were probed for BiP and tubulin was used as a loading control. (C) IRE1β-FLAG transgene expression over time by western blot in cell lysates derived from Calu-1ERN1-/-IRE1βFLAG-DOX co-expressing ER-targeted BirA as a control protein (left, orange), or AGR2 (right, purple). Cells received 1 μg/ml doxycycline to induce expression of IRE1β. Protein lysates were prepared at the indicated times and probed for IRE1β-FLAG expression, XBP1S and tubulin as a loading control. (D) Quantification of IRE1β-FLAG and XPP1S protein levels normalized to tubulin in three replicate experiments represented in (C). Error bars represent SEM. (E) Gating strategy to assess cell death. Doublets were gated out and dead cells were gated on via Annexin V and Live/Dead positive staining. All cells staining positive for a single, or both cell death markers were considered dead (red gate).CC BY · PubMed Central
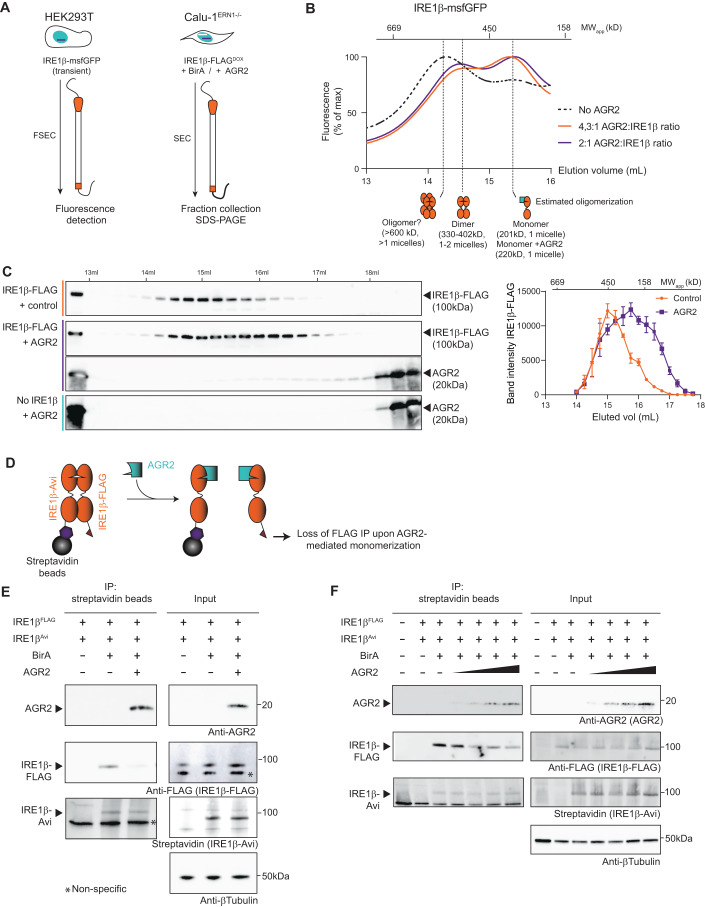
Figure 4 AGR2 blocks IRE1β activity through disruption of IRE1β oligomers. (A) Schematic overview of gel filtration experiments in (B, C). (B) msfGFP fluorescence measured during elution of HEK293T lysates overexpressing IRE1β in the absence of AGR2 (black dotted trace) or in the presence of AGR2 (orange and purple traces indicating different ratios of transfected AGR2:IRE1β plasmid). Top scale represents the approximate elution profile and expected MW of protein standards. Bottom drawings indicate expected oligomerization status based on protein standards and the previously obtained elution profile (Grey et al, 2020). Each trace shows a single chromatography run. (C) IRE1β-FLAG expression in fractions collected after gel filtration of protein lysates from Calu-1ERN1-/-IRE1βFLAG-DOX cells, in the absence or presence of additional AGR2 expression. Line graph shows quantification of band intensities from the gel of three independent replicates. Error bar shows SEM. (D) Schematic representation of competition IP experiments in (E, F). IRE1β is expressed with an Avi-tag or FLAG-tag in equimolar amounts. After biotinylation of the Avi-tag by BirA, both the Avi-tag and FLAG-tag will be detected after streptavidin IP if dimers have been formed. If addition of another protein (e.g., AGR2) would block this process, a loss of signal is expected. (E) Competition IP showing loss of dimer formation upon co-expression of AGR2. Samples were immunoblotted with anti-AGR2, anti-FLAG and Streptavidin. Tubulin was used as a loading control in input samples. Representative of three independent experiments. Non-specific signal is indicated with an asterisk. (F) Competition IP demonstrating concentration-dependent loss of dimer formation upon increasing AGR2 co-expression. Samples were immunoblotted with anti-AGR2, anti-FLAG and Streptavidin. Tubulin was used as a loading control in input samples. Representative of two independent experiments. Source data are available online for this figure.
Figure 4 AGR2 blocks IRE1β activity through disruption of IRE1β oligomers. (A) Schematic overview of gel filtration experiments in (B, C). (B) msfGFP fluorescence measured during elution of HEK293T lysates overexpressing IRE1β in the absence of AGR2 (black dotted trace) or in the presence of AGR2 (orange and purple traces indicating different ratios of transfected AGR2:IRE1β plasmid). Top scale represents the approximate elution profile and expected MW of protein standards. Bottom drawings indicate expected oligomerization status based on protein standards and the previously obtained elution profile (Grey et al, 2020). Each trace shows a single chromatography run. (C) IRE1β-FLAG expression in fractions collected after gel filtration of protein lysates from Calu-1ERN1-/-IRE1βFLAG-DOX cells, in the absence or presence of additional AGR2 expression. Line graph shows quantification of band intensities from the gel of three independent replicates. Error bar shows SEM. (D) Schematic representation of competition IP experiments in (E, F). IRE1β is expressed with an Avi-tag or FLAG-tag in equimolar amounts. After biotinylation of the Avi-tag by BirA, both the Avi-tag and FLAG-tag will be detected after streptavidin IP if dimers have been formed. If addition of another protein (e.g., AGR2) would block this process, a loss of signal is expected. (E) Competition IP showing loss of dimer formation upon co-expression of AGR2. Samples were immunoblotted with anti-AGR2, anti-FLAG and Streptavidin. Tubulin was used as a loading control in input samples. Representative of three independent experiments. Non-specific signal is indicated with an asterisk. (F) Competition IP demonstrating concentration-dependent loss of dimer formation upon increasing AGR2 co-expression. Samples were immunoblotted with anti-AGR2, anti-FLAG and Streptavidin. Tubulin was used as a loading control in input samples. Representative of two independent experiments. Source data are available online for this figure.CC BY · PubMed Central
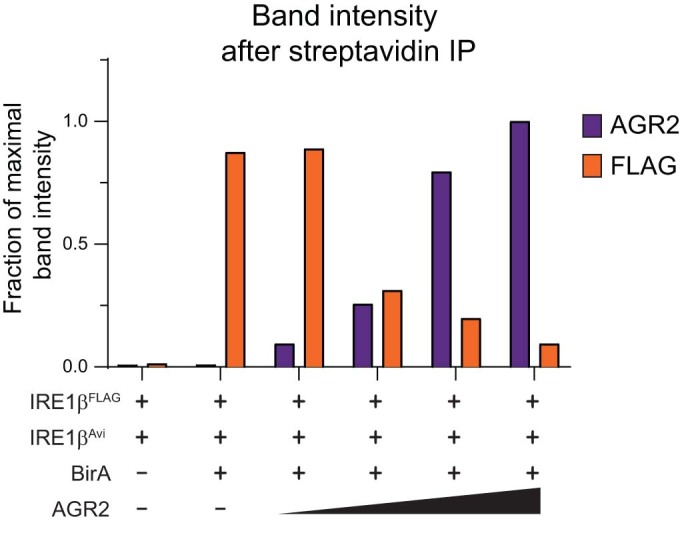
Figure EV3 Inverse relationship between AGR2 IP and IRE1β complex formation. Quantification of immunoblots in Fig. 4F (n = 2). IRE1β-FLAG band intensity was normalized to input expression levels. Band intensity values are expressed as a fraction of the maximal intensity that was obtained in each respective experiment.
Figure EV3 Inverse relationship between AGR2 IP and IRE1β complex formation. Quantification of immunoblots in Fig. 4F (n = 2). IRE1β-FLAG band intensity was normalized to input expression levels. Band intensity values are expressed as a fraction of the maximal intensity that was obtained in each respective experiment.CC BY · PubMed Central
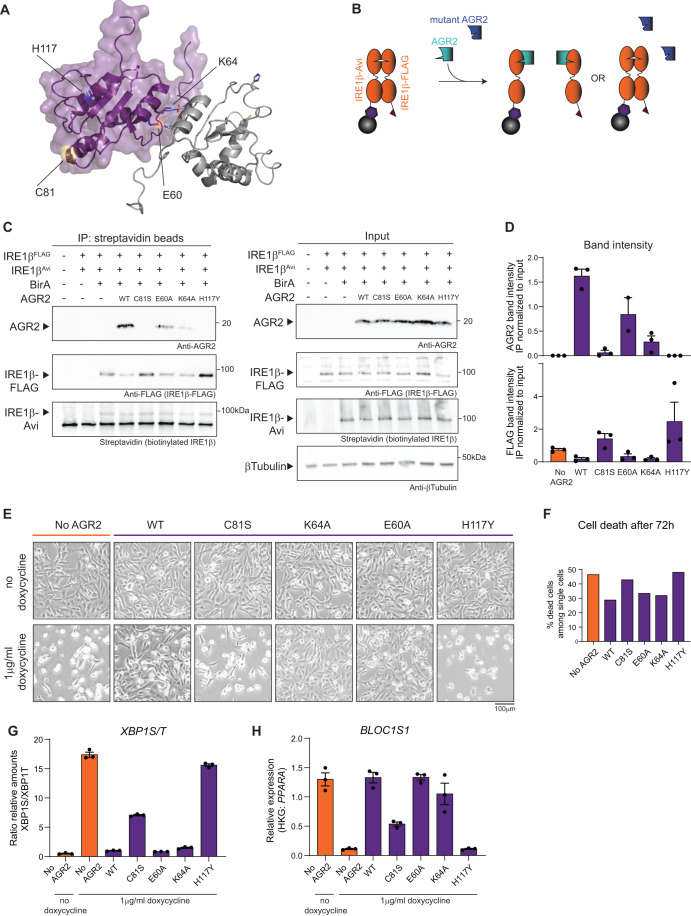
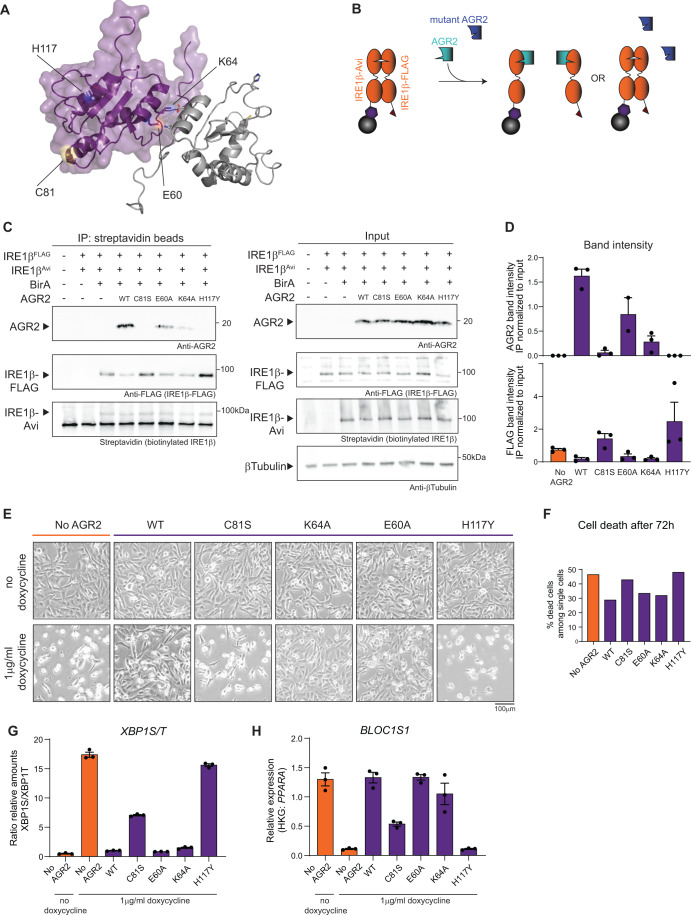
Figure 5 The catalytic-dead C81S and disease-causing H117Y mutations in AGR2 abrogate its ability to bind and inhibit IRE1β activity. (A) The structure of AGR2 (pdb: 2LNS) visualized in PyMol with the relevant mutations indicated. Purple and grey cartoons depict two AGR2 molecules and their dimer structure (Patel et al, 2013), specific residues are represented as ball-and-sticks. (B) Schematic overview of competition IP using AGR2 mutants. (C) Competition IP showing loss of dimer inhibition using C81S and H117Y AGR2 mutants. Samples were immunoblotted with anti-AGR2, anti-FLAG-IRE1β and Streptavidin. Tubulin was used as a loading control in input samples. Representative of three independent experiments. (D) Quantification of IP band intensities normalized over corresponding input sample on western blots from (C), with each data point representing one experiment. Error bars show SEM. (E) Photographs showing Calu-1ERN1-/-IRE1βFLAG-DOX cultures, transduced with a constitutive AGR2 transgene (wild-type or the indicated mutants). IRE1β-FLAG overexpression was induced with 1 μg/ml doxycycline for 72 h. Scale bar represents 200 µm. Representative of two independent experiments. (F) Quantification of cell death in cell lines from (E) after 72 h of transgene expression. All cells in the culture dish were stained with Annexin V and Live/Dead stain and analyzed by flow cytometry. All single and double positive cells were considered as dead cells. Representative of two independent experiments with n = 2 culture dishes. (G) RT-qPCR analysis of XBP1S/T transcript levels after 24 h of transgene induction using 1 μg/ml doxycycline. Representative of two independent experiments with three replicates per condition. Error bars show SEM. (H) RT-qPCR analysis of BLOC1S1 transcript levels after 24 h of transgene induction using 1 μg/ml doxycycline. Representative of two independent experiments with three replicates per condition. Error bars show SEM. Source data are available online for this figure.
Figure 5 The catalytic-dead C81S and disease-causing H117Y mutations in AGR2 abrogate its ability to bind and inhibit IRE1β activity. (A) The structure of AGR2 (pdb: 2LNS) visualized in PyMol with the relevant mutations indicated. Purple and grey cartoons depict two AGR2 molecules and their dimer structure (Patel et al, 2013), specific residues are represented as ball-and-sticks. (B) Schematic overview of competition IP using AGR2 mutants. (C) Competition IP showing loss of dimer inhibition using C81S and H117Y AGR2 mutants. Samples were immunoblotted with anti-AGR2, anti-FLAG-IRE1β and Streptavidin. Tubulin was used as a loading control in input samples. Representative of three independent experiments. (D) Quantification of IP band intensities normalized over corresponding input sample on western blots from (C), with each data point representing one experiment. Error bars show SEM. (E) Photographs showing Calu-1ERN1-/-IRE1βFLAG-DOX cultures, transduced with a constitutive AGR2 transgene (wild-type or the indicated mutants). IRE1β-FLAG overexpression was induced with 1 μg/ml doxycycline for 72 h. Scale bar represents 200 µm. Representative of two independent experiments. (F) Quantification of cell death in cell lines from (E) after 72 h of transgene expression. All cells in the culture dish were stained with Annexin V and Live/Dead stain and analyzed by flow cytometry. All single and double positive cells were considered as dead cells. Representative of two independent experiments with n = 2 culture dishes. (G) RT-qPCR analysis of XBP1S/T transcript levels after 24 h of transgene induction using 1 μg/ml doxycycline. Representative of two independent experiments with three replicates per condition. Error bars show SEM. (H) RT-qPCR analysis of BLOC1S1 transcript levels after 24 h of transgene induction using 1 μg/ml doxycycline. Representative of two independent experiments with three replicates per condition. Error bars show SEM. Source data are available online for this figure.CC BY · PubMed Central
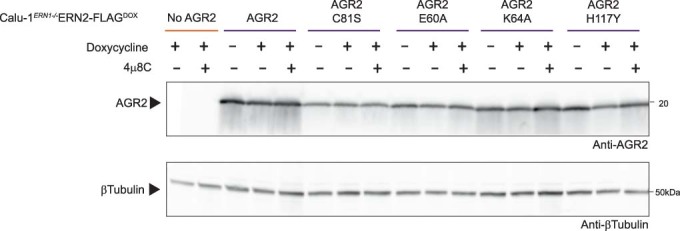
Figure EV4 AGR2 expression in stably transduced cell lines. AGR2 expression in cultures analyzed in Fig. 5D,E. Tubulin was used as a loading control.
Figure EV4 AGR2 expression in stably transduced cell lines. AGR2 expression in cultures analyzed in Fig. 5D,E. Tubulin was used as a loading control.CC BY · PubMed Central
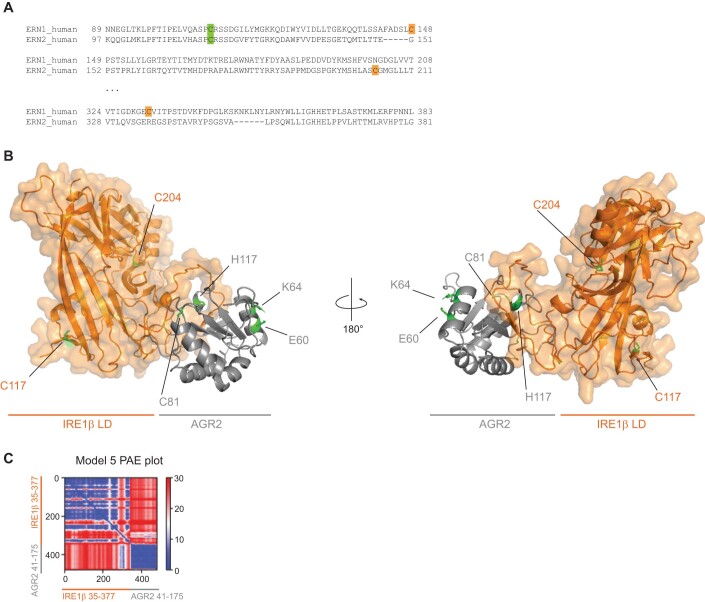
Figure EV5 AGR2 is predicted to bind a flexible loop region in the IRE1β luminal domain. (A) BLAST alignment of the regions containing cysteines in human IRE1α and IRE1β. Green square indicates the sole conserved cysteine in IRE1α and IRE1β luminal domain, orange squares show cysteines present in only one of the paralogues. (B) Highest scoring AlphaFold2-Multimer model (pTM score = 0.662), modeled using IRE1β residues 35-377 (Uniprot Q76MJ5) and AGR2 residues 41-175 (Uniprot O95994). The IRE1β luminal domain is shown in orange and AGR2 in grey. Labels indicate the highlighted green residues. (C) Predicted aligned error (PAE) plot for the model shown in B.
Figure EV5 AGR2 is predicted to bind a flexible loop region in the IRE1β luminal domain. (A) BLAST alignment of the regions containing cysteines in human IRE1α and IRE1β. Green square indicates the sole conserved cysteine in IRE1α and IRE1β luminal domain, orange squares show cysteines present in only one of the paralogues. (B) Highest scoring AlphaFold2-Multimer model (pTM score = 0.662), modeled using IRE1β residues 35-377 (Uniprot Q76MJ5) and AGR2 residues 41-175 (Uniprot O95994). The IRE1β luminal domain is shown in orange and AGR2 in grey. Labels indicate the highlighted green residues. (C) Predicted aligned error (PAE) plot for the model shown in B.CC BY · PubMed Central
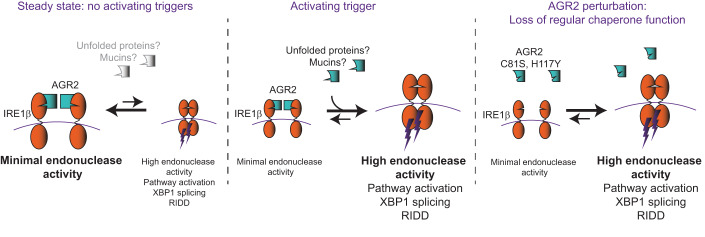
Figure 6 Proposed mechanism of IRE1β regulation by AGR2. In steady-state conditions, AGR2 is bound to most IRE1β molecules and under these conditions, IRE1β is mainly present in the inactive, monomeric forms. As a result, overall IRE1β activity will be low. In conditions where an activating trigger is present (possibly unfolded MUC2 polypeptides, though this remains to be demonstrated), AGR2 is released from IRE1β in favor of binding other AGR2 chaperone substrates. As a result, IRE1β is released, activated and overall IRE1β activity will be high. In case of AGR2C81S and AGR2H117Y, interaction with IRE1β is disrupted leading to spontaneous IRE1β dimerization triggering its activity.
Figure 6 Proposed mechanism of IRE1β regulation by AGR2. In steady-state conditions, AGR2 is bound to most IRE1β molecules and under these conditions, IRE1β is mainly present in the inactive, monomeric forms. As a result, overall IRE1β activity will be low. In conditions where an activating trigger is present (possibly unfolded MUC2 polypeptides, though this remains to be demonstrated), AGR2 is released from IRE1β in favor of binding other AGR2 chaperone substrates. As a result, IRE1β is released, activated and overall IRE1β activity will be high. In case of AGR2C81S and AGR2H117Y, interaction with IRE1β is disrupted leading to spontaneous IRE1β dimerization triggering its activity.CC BY · PubMed Central

Verification

Claims the paper makes

The claims and statistics of this paper haven’t been checked yet.

Run the check — free, no account needed. It reads the open-access text and checks the sources it cites.

A few free checks a day · papers already verified open instantly · results are public

Self-check

Percentages, sums and reported differences re-computed from the paper’s own numbers.

The self-check needs the paper’s full text.

Citations

Cites

Research works printed but not linked: 63

  1. Aberger F, Weidinger G, Grunz H, Richter K (1998) Anterior specification of embryonic ectoderm: the role of the Xenopus cement gland-specific gene XAG-2. Mechan Dev 72:115–130 · DOI
  2. Adams CJ, Kopp MC, Larburu N, Nowak PR, Ali MMU (2019) Structure and molecular mechanism of ER stress signaling by the unfolded protein response signal activator IRE1. Front Mol Biosci 6:11 · DOI
  3. Al-Shaibi AA, Abdel-Motal UM, Hubrack SZ, Bullock AN, Al-Marri AA, Agrebi N, Al-Subaiey AA, Ibrahim NA, Charles AK, Elawad M et al (2021) Human AGR2 deficiency causes mucus barrier dysfunction and infantile inflammatory bowel disease. Cell Mol Gastroenterol Hepatol 12:1809–1830 · DOI
  4. Ali MM, Bagratuni T, Davenport EL, Nowak PR, Silva-Santisteban MC, Hardcastle A, McAndrews C, Rowlands MG, Morgan GJ, Aherne W et al (2011) Structure of the Ire1 autophosphorylation complex and implications for the unfolded protein response. EMBO J 30:894–905 · DOI
  5. Amin-Wetzel N, Neidhardt L, Yan Y, Mayer MP, Ron D (2019) Unstructured regions in IRE1α specify BiP-mediated destabilisation of the luminal domain dimer and repression of the UPR. eLife 8:e50793 · DOI
  6. Amin-Wetzel N, Saunders RA, Kamphuis MJ, Rato C, Preissler S, Harding HP, Ron D (2017) A J-protein co-chaperone recruits BiP to monomerize IRE1 and repress the unfolded protein response. Cell 171:1625–1637.e1613 · DOI
  7. Benhamron S, Hadar R, Iwawaky T, So JS, Lee AH, Tirosh B (2014) Regulated IRE1-dependent decay participates in curtailing immunoglobulin secretion from plasma cells. Eur J Immunol 44:867–876 · DOI
  8. Bergstrom JH, Berg KA, Rodriguez-Pineiro AM, Stecher B, Johansson ME, Hansson GC (2014) AGR2, an endoplasmic reticulum protein, is secreted into the gastrointestinal mucus. PLoS ONE 9:e104186 · DOI
  9. Bergstrom K, Fu J, Johansson ME, Liu X, Gao N, Wu Q, Song J, McDaniel JM, McGee S, Chen W et al (2017) Core 1- and 3-derived O-glycans collectively maintain the colonic mucus barrier and protect against spontaneous colitis in mice. Mucosal Immunol 10:91–103 · DOI
  10. Bertoli-Avella A, Hotakainen R, Al Shehhi M, Urzi A, Pareira C, Marais A, Al Shidhani K, Aloraimi S, Morales-Torres G, Fisher S et al (2022) A disorder clinically resembling cystic fibrosis caused by biallelic variants in the AGR2 gene. J Med Genet 59:993–1001 · DOI
  11. Bertolotti A, Wang X, Novoa I, Jungreis R, Schlessinger K, Cho JH, West AB, Ron D (2001) Increased sensitivity to dextran sodium sulfate colitis in IRE1beta-deficient mice. J Clin Investig 107:585–593 · DOI
  12. Bertolotti A, Zhang Y, Hendershot LM, Harding HP, Ron D (2000) Dynamic interaction of BiP and ER stress transducers in the unfolded-protein response. Nat Cell Biol 2:326–332 · DOI
  13. Birchenough GM, Johansson ME, Gustafsson JK, Bergström JH, Hansson GC (2015) New developments in goblet cell mucus secretion and function. Mucosal Immunol 8:712–719 · DOI
  14. Bradley L, Wainstock D, Sive H (1996) Positive and negative signals modulate formation of the Xenopus cement gland. Development 122:2739–2750 · DOI
  15. Cloots E, Debeuf N, Deswarte K, Fayazpour F, Vanheerswynghels M, De Wolf C, van de Velde E, Hammad H, Lambrecht BN, Eyckerman S et al (2021a) IRE1 beta does not affect mucus secretion during allergic asthma development in a house dust mite murine model. Allergy 76:3546–3549 · DOI
  16. Cloots E, Simpson MS, De Nolf C, Lencer WI, Janssens S, Grey MJ (2021b) Evolution and function of the epithelial cell-specific ER stress sensor IRE1 beta. Mucosal Immunol 14:1235–1246 · DOI
  17. Cox J, Hein MY, Luber CA, Paron I, Nagaraj N, Mann M (2014) Accurate proteome-wide label-free quantification by delayed normalization and maximal peptide ratio extraction, termed MaxLFQ. Mol Cell Proteomics: MCP 13:2513–2526 · DOI · Paper page
  18. Credle JJ, Finer-Moore JS, Papa FR, Stroud RM, Walter P (2005) On the mechanism of sensing unfolded protein in the endoplasmic reticulum. Proc Natl Acad Sci USA 102:18773–18784 · DOI
  19. Cross BC, Bond PJ, Sadowski PG, Jha BK, Zak J, Goodman JM, Silverman RH, Neubert TA, Baxendale IR, Ron D et al (2012) The molecular basis for selective inhibition of unconventional mRNA splicing by an IRE1-binding small molecule. Proc Natl Acad Sci USA 109:E869–878 · DOI
  20. Eletto D, Eletto D, Boyle S, Argon Y (2016) PDIA6 regulates insulin secretion by selectively inhibiting the RIDD activity of IRE1. FASEB J 30:653–665 · DOI
  21. Eletto D, Eletto D, Dersh D, Gidalevitz T, Argon Y (2014) Protein disulfide isomerase A6 controls the decay of IRE1α signaling via disulfide-dependent association. Mol Cell 53:562–576 · DOI
  22. Fairhead M, Howarth M (2015) Site-specific biotinylation of purified proteins using BirA. Methods Mol Biol 1266:171–184 · DOI
  23. Fass D, Thornton DJ (2023) Mucin networks: dynamic structural assemblies controlling mucus function. Curr Opin Struct Biol 79:102524 · DOI
  24. Grey MJ, Cloots E, Simpson MS, LeDuc N, Serebrenik YV, De Luca H, De Sutter D, Luong P, Thiagarajah JR, Paton AW et al (2020) IRE1beta negatively regulates IRE1alpha signaling in response to endoplasmic reticulum stress. J Cell Biol 219:e201904048 · DOI
  25. Groenendyk J, Peng Z, Dudek E, Fan X, Mizianty MJ, Dufey E, Urra H, Sepulveda D, Rojas-Rivera D, Lim Y et al (2014) Interplay between the oxidoreductase PDIA6 and microRNA-322 controls the response to disrupted endoplasmic reticulum calcium homeostasis. Sci Signal 7:ra54 · DOI
  26. Gupta A, Dong A, Lowe AW (2012) AGR2 gene function requires a unique endoplasmic reticulum localization motif. J Biol Chem 287:4773–4782 · DOI
  27. Harding HP, Novoa I, Zhang Y, Zeng H, Wek R, Schapira M, Ron D (2000) Regulated translation initiation controls stress-induced gene expression in mammalian cells. Mol Cell 6:1099–1108 · DOI
  28. Hetz C, Zhang K, Kaufman RJ (2020) Mechanisms, regulation and functions of the unfolded protein response. Nat Rev Mol Cell Biol 21:421–438 · DOI · Paper page
  29. Higa A, Taouji S, Lhomond S, Jensen D, Fernandez-Zapico ME, Simpson JC, Pasquet JM, Schekman R, Chevet E (2014) Endoplasmic reticulum stress-activated transcription factor ATF6α requires the disulfide isomerase PDIA5 to modulate chemoresistance. Mol Cell Biol 34:1839–1849 · DOI
  30. Hollien J, Lin JH, Li H, Stevens N, Walter P, Weissman JS (2009) Regulated Ire1-dependent decay of messenger RNAs in mammalian cells. J Cell Biol 186:323–331 · DOI
  31. Hollien J, Weissman JS (2006) Decay of endoplasmic reticulum-localized mRNAs during the unfolded protein response. Science 313:104–107 · DOI
  32. Iwawaki T, Hosoda A, Okuda T, Kamigori Y, Nomura-Furuwatari C, Kimata Y, Tsuru A, Kohno K (2001) Translational control by the ER transmembrane kinase/ribonuclease IRE1 under ER stress. Nat Cell Biol 3:158–164 · DOI
  33. Johansson ME, Gustafsson JK, Holmén-Larsson J, Jabbar KS, Xia L, Xu H, Ghishan FK, Carvalho FA, Gewirtz AT, Sjövall H et al (2014) Bacteria penetrate the normally impenetrable inner colon mucus layer in both murine colitis models and patients with ulcerative colitis. Gut 63:281–291 · DOI · Paper page
  34. Johansson ME, Thomsson KA, Hansson GC (2009) Proteomic analyses of the two mucus layers of the colon barrier reveal that their main component, the Muc2 mucin, is strongly bound to the Fcgbp protein. J Proteome Res 8:3549–3557 · DOI
  35. Karagöz GE, Acosta-Alvear D, Nguyen HT, Lee CP, Chu F, Walter P (2017) An unfolded protein-induced conformational switch activates mammalian IRE1. eLife 6:e30700 · DOI
  36. Korennykh AV, Egea PF, Korostelev AA, Finer-Moore J, Stroud RM, Zhang C, Shokat KM, Walter P (2011) Cofactor-mediated conformational control in the bifunctional kinase/RNase Ire1. BMC Biol 9:48 · DOI
  37. Lipson KL, Ghosh R, Urano F (2008) The role of IRE1alpha in the degradation of insulin mRNA in pancreatic beta-cells. PLoS ONE 3:e1648 · DOI
  38. Liu CY, Xu Z, Kaufman RJ (2003) Structure and intermolecular interactions of the luminal dimerization domain of human IRE1alpha. J Biol Chem 278:17680–17687 · DOI
  39. Mandal AK, Lee P, Chen JA, Nillegoda N, Heller A, DiStasio S, Oen H, Victor J, Nair DM, Brodsky JL et al (2007) Cdc37 has distinct roles in protein kinase quality control that protect nascent chains from degradation and promote posttranslational maturation. J Cell Biol 176:319–328 · DOI
  40. Maurel M, Chevet E, Tavernier J, Gerlo S (2014) Getting RIDD of RNA: IRE1 in cell fate regulation. Trends Biochem Sci 39:245–254 · DOI
  41. Nakamura D, Tsuru A, Ikegami K, Imagawa Y, Fujimoto N, Kohno K (2011) Mammalian ER stress sensor IRE1beta specifically down-regulates the synthesis of secretory pathway proteins. FEBS Lett 585:133–138 · DOI
  42. Neidhardt L, Cloots E, Friemel N, Weiss C, Harding H, McLaughlin SH, Janssens S, Ron D (2023) The IRE1β-mediated unfolded protein response is repressed by the chaperone AGR2 in mucin producing cells. EMBO J. https://doi.org/10.1038/s44318-023-00014-z · DOI
  43. Nyström EEL, Martinez-Abad B, Arike L, Birchenough GMH, Nonnecke EB, Castillo PA, Svensson F, Bevins CL, Hansson GC, Johansson MEV (2021) An intercrypt subpopulation of goblet cells is essential for colonic mucus barrier function. Science 372:eabb1590 · DOI
  44. Oikawa D, Kitamura A, Kinjo M, Iwawaki T (2012) Direct association of unfolded proteins with mammalian ER stress sensor, IRE1beta. PLoS ONE 7:e51290 · DOI
  45. Osorio F, Tavernier SJ, Hoffmann E, Saeys Y, Martens L, Vetters J, Delrue I, De Rycke R, Parthoens E, Pouliot P et al (2014) The unfolded-protein-response sensor IRE-1alpha regulates the function of CD8alpha+ dendritic cells. Nat Immunol 15:248–257 · DOI · Paper page
  46. Ota A, Wang Y (2012) Cdc37/Hsp90 protein-mediated regulation of IRE1α protein activity in endoplasmic reticulum stress response and insulin synthesis in INS-1 cells. J Biol Chem 287:6266–6274 · DOI
  47. Park SW, Zhen G, Verhaeghe C, Nakagami Y, Nguyenvu LT, Barczak AJ, Killeen N, Erle DJ (2009) The protein disulfide isomerase AGR2 is essential for production of intestinal mucus. Proc Natl Acad Sci USA 106:6950–6955 · DOI
  48. Patel P, Clarke C, Barraclough DL, Jowitt TA, Rudland PS, Barraclough R, Lian LY (2013) Metastasis-promoting anterior gradient 2 protein has a dimeric thioredoxin fold structure and a role in cell adhesion. J Mol Biol 425:929–943 · DOI
  49. Preissler S, Ron D (2019) Early events in the endoplasmic reticulum unfolded protein response. Cold Spring Harbor Perspect Biol 11:a033894 · DOI
  50. Scheuner D, Song B, McEwen E, Liu C, Laybutt R, Gillespie P, Saunders T, Bonner-Weir S, Kaufman RJ (2001) Translational control is required for the unfolded protein response and in vivo glucose homeostasis. Mol Cell 7:1165–1176 · DOI
  51. Schneider CA, Rasband WS, Eliceiri KW (2012) NIH Image to ImageJ: 25 years of image analysis. Na Methods 9:671–675 · DOI · Paper page
  52. Sharpe C, Thornton DJ, Grencis RK (2018) A sticky end for gastrointestinal helminths; the role of the mucus barrier. Parasite Immunol 40:e12517 · DOI
  53. Sive HL, Hattori K, Weintraub H (1989) Progressive determination during formation of the anteroposterior axis in Xenopus laevis. Cell 58:171–180 · DOI
  54. Sood R, Porter AC, Ma K, Quilliam LA, Wek RC (2000) Pancreatic eukaryotic initiation factor-2alpha kinase (PEK) homologues in humans, Drosophila melanogaster and Caenorhabditis elegans that mediate translational control in response to endoplasmic reticulum stress. Biochem J 346(Pt 2):281–293 · DOI
  55. Tam AB, Koong AC, Niwa M (2014) Ire1 has distinct catalytic mechanisms for XBP1/HAC1 splicing and RIDD. Cell Rep 9:850–858 · DOI
  56. Tang CH, Chang S, Paton AW, Paton JC, Gabrilovich DI, Ploegh HL, Del Valle JR, Hu CC (2018) Phosphorylation of IRE1 at S729 regulates RIDD in B cells and antibody production after immunization. J Cell Biol 217:1739–1755 · DOI
  57. Tschurtschenthaler M, Adolph TE, Ashcroft JW, Niederreiter L, Bharti R, Saveljeva S, Bhattacharyya J, Flak MB, Shih DQ, Fuhler GM et al (2017) Defective ATG16L1-mediated removal of IRE1alpha drives Crohn’s disease-like ileitis. J Exp Med 214:401–422 · DOI
  58. Tsuru A, Fujimoto N, Takahashi S, Saito M, Nakamura D, Iwano M, Iwawaki T, Kadokura H, Ron D, Kohno K (2013) Negative feedback by IRE1beta optimizes mucin production in goblet cells. Proc Natl Acad Sci USA 110:2864–2869 · DOI
  59. Wang XZ, Harding HP, Zhang Y, Jolicoeur EM, Kuroda M, Ron D (1998) Cloning of mammalian Ire1 reveals diversity in the ER stress responses. EMBO J 17:5708–5717 · DOI
  60. Yoshida H, Matsui T, Yamamoto A, Okada T, Mori K (2001) XBP1 mRNA is induced by ATF6 and spliced by IRE1 in response to ER stress to produce a highly active transcription factor. Cell 107:881–891 · DOI
  61. Yu J, Li T, Liu Y, Wang X, Zhang J, Wang X, Shi G, Lou J, Wang L, Wang CC et al (2020) Phosphorylation switches protein disulfide isomerase activity to maintain proteostasis and attenuate ER stress. EMBO J 39:e103841 · DOI
  62. Zheng W, Rosenstiel P, Huse K, Sina C, Valentonyte R, Mah N, Zeitlmann L, Grosse J, Ruf N, Nürnberg P et al (2006) Evaluation of AGR2 and AGR3 as candidate genes for inflammatory bowel disease. Genes Immunity 7:11–18 · DOI
  63. Zhou J, Liu CY, Back SH, Clark RL, Peisach D, Xu Z, Kaufman RJ (2006) The crystal structure of human IRE1 luminal domain reveals a conserved dimerization interface required for activation of the unfolded protein response. Proc Natl Acad Sci USA 103:14343–14348 · DOI

Metadata

Authors
Cloots, E., Guilbert, P., Provost, M., Neidhardt, L., Van de Velde, E., Fayazpour, F., De Sutter, D., Savvides, S. N., Eyckerman, S., & Janssens, S.
Affiliations
  • Ghent University (BE)
  • University of Cambridge (GB)
Corresponding author
Janssens, Sophie
Venue
The EMBO Journal
Published
2023-12-20
Volume
43
Issue
5
Pages
695-718
ISSN
  • 0261-4189 (ISSN-L)
  • 1460-2075
OpenAlex
W4389991505
Cited by
31
References
6
Citations by year
2026: 6 · 2025: 14 · 2024: 10 · 2023: 1
FWCI
4.49
Type
journal article
Language
en
Open access
Locations
  • The EMBO Journal (publishedVersion, cc-by)
  • bioRxiv (Cold Spring Harbor Laboratory) (acceptedVersion)
  • PubMed Central (publishedVersion, cc-by)
  • PubMed (publishedVersion)
  • Ghent University Academic Bibliography (Ghent University) (submittedVersion, cc-by)
  • Apollo (University of Cambridge) (submittedVersion, cc-by)
Funders
  • Fonds Wetenschappelijk Onderzoek (1228923N, G017521N, G049820N,G0H1222N,S000722N,S002322N)
  • EC | ERC | HORIZON EUROPE European Research Council (DCRIDDLE- 819314)
  • UGent | Bijzonder Onderzoeksfonds UGent (BOF16/GOA/023)
  • Medical Research Council DTP and Gates Cambridge PhD Programme
Topics
  • Life Sciences › Biochemistry, Genetics and Molecular Biology › Cell Biology › Endoplasmic Reticulum Stress and Disease
  • Life Sciences › Biochemistry, Genetics and Molecular Biology › Cell Biology › Cellular transport and secretion
  • Life Sciences › Neuroscience › Sensory Systems › Ion Channels and Receptors
Keywords
AGR2, goblet cells, unfolded protein response, mucin secretion, protein disulfide isomerase, protein folding, endoplasmic reticulum, intestinal mucus
MeSH terms
Endonucleases, Humans, Mucins, Molecular Chaperones, Protein Disulfide-Isomerases, Goblet Cells, Cell Line, Tumor

About these checks

Registry, retraction, Cites and statistics results are computed, not judged, with one exception: a printed reference that no index lists is read once by a model before it counts as a citation error. Claims are extracted by a model and kept only when their quote appears verbatim in the text; each cited source is then checked, with a model’s help, for whether it says what the claim relies on. Those verdicts can be wrong — read the claim’s quote and the cited source before relying on one.

Statistics and arithmetic are recomputed, not judged.

Confidence bands are shown only for fields calibrated on our annotated test set. None is calibrated yet, so no band is shown.

What counts as a claim ›How we measure confidence ›How we check this ›

Are you an author, or do you see a problem with this page? Request a review