

The DOI matches its Crossref record; 93 of the 94 references it cites were found in a registry or an index, and 1 are not checked yet; none of the 20 sources its claims cite is checked for support yet.
Multi-omic phenotyping of MAPT V337M neurons reveals early changes in axonogenesis and tau phosphorylation
Open accessPublished version of a preprint
Abstract
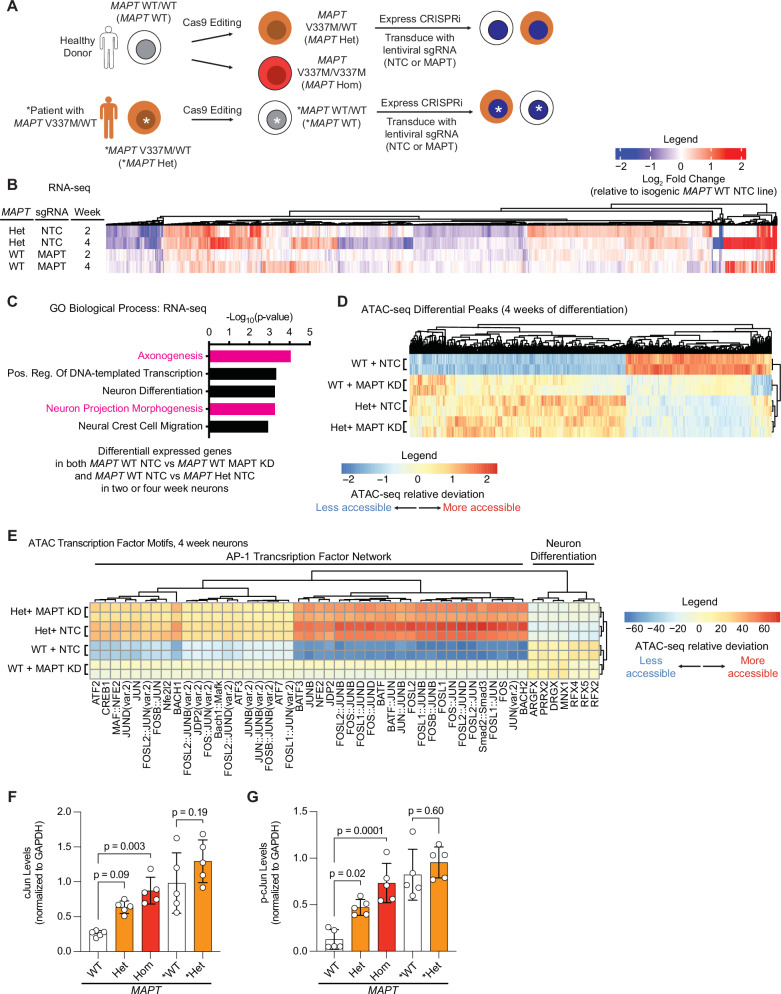
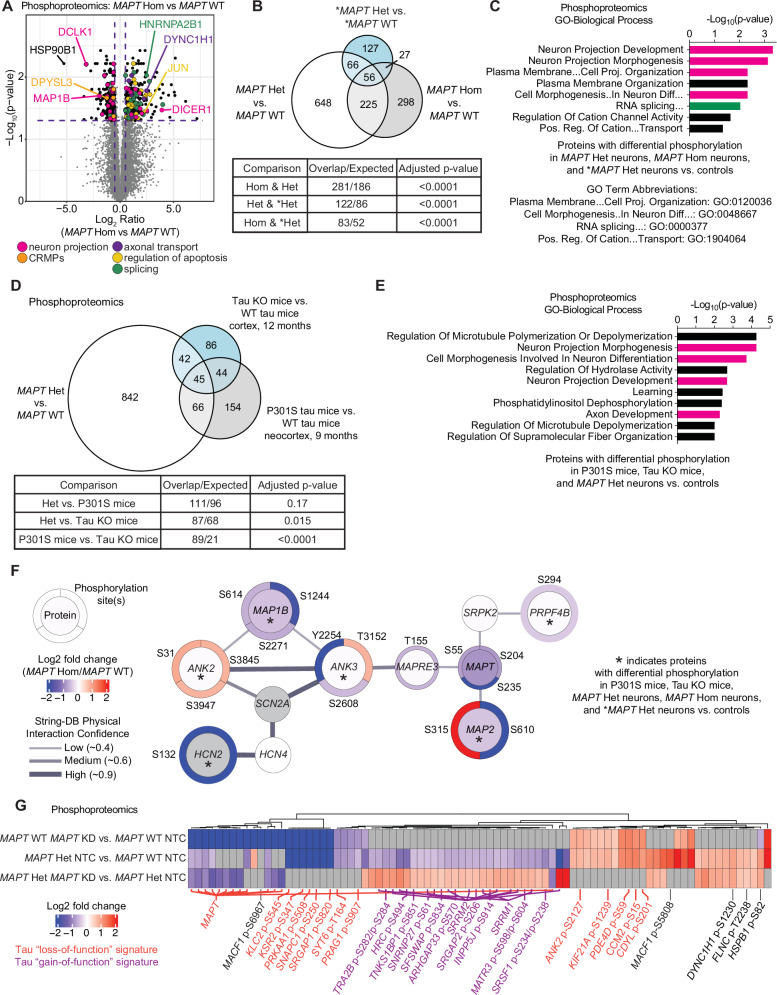
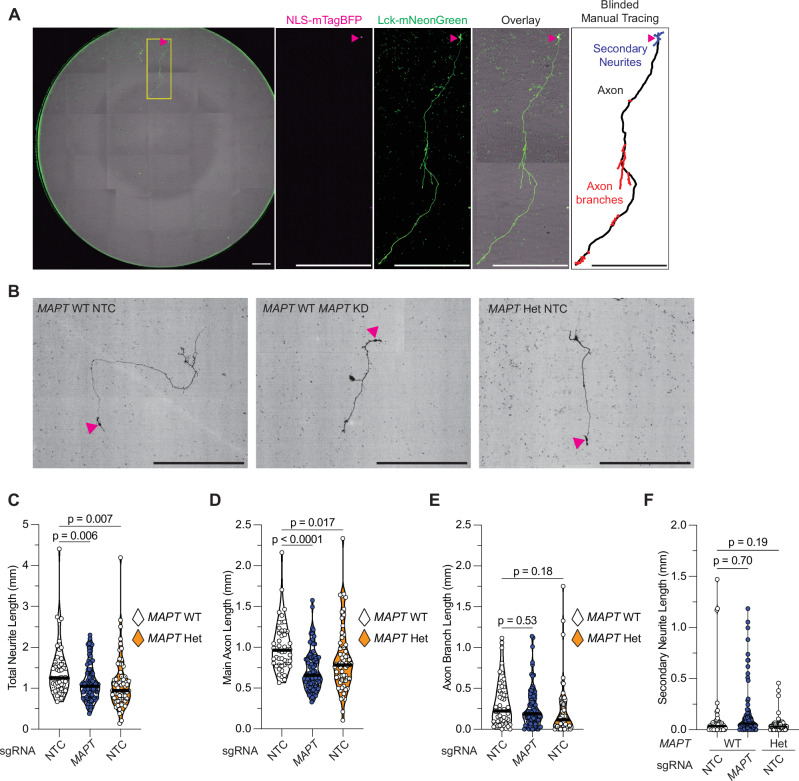
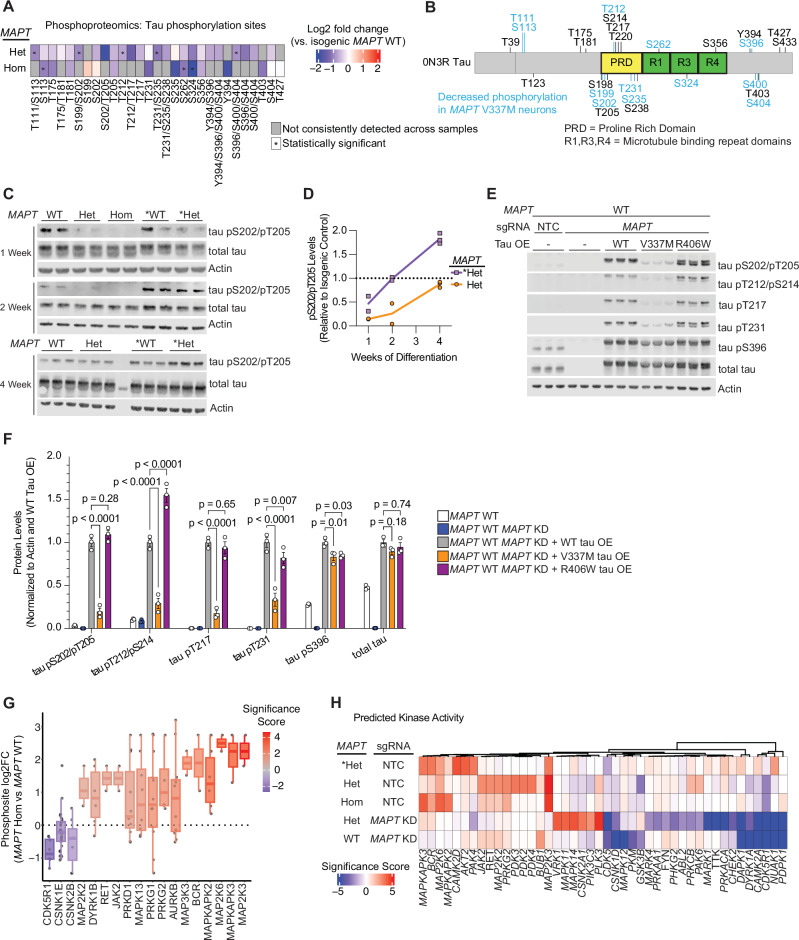
Tau aggregation is a hallmark of several neurodegenerative diseases, including Alzheimer’s disease and frontotemporal dementia. There are disease-causing variants of the tau-encoding gene, MAPT , and the presence of tau aggregates is highly correlated with disease progression. However, the molecular mechanisms linking pathological tau to neuronal dysfunction are not well understood. This is in part due to an incomplete understanding of the normal functions of tau in development and aging, and how the associated molecular and cellular processes change in the context of causal disease variants of tau. To address these questions in an unbiased manner, we conducted multi-omic characterization of iPSC-derived neurons harboring the MAPT V337M mutation or MAPT knockdown. RNA-seq, ATAC-seq, and phosphoproteomics revealed that both the V337M mutation and tau knockdown perturbed levels of transcripts and phosphorylation of proteins related to axonogenesis or axon morphology. When we directly measured axonogenesis, we found that both MAPT V337M and MAPT knockdown caused decreased axon length. Surprisingly, we found that neurons with V337M tau had much lower tau phosphorylation than neurons with WT tau. CRISPR-based screens uncovered regulators of tau phosphorylation in neurons and found that factors involved in axonogenesis modified tau phosphorylation in both MAPT WT and MAPT V337M neurons. Intriguingly, the p38 MAPK pathway specifically modified tau phosphorylation in MAPT V337M neurons. We propose that V337M tau perturbs tau phosphorylation and axon morphology pathways that are relevant to the normal function of tau in development, which could contribute to previously reported cognitive changes in preclinical MAPT variant carriers.
Checked 2026-11-13 · 1 reference not checked yet
Overview
CoChat Summary
TL;DR
Multi-omic profiling of iPSC-derived neurons with the FTD-causing MAPT V337M mutation or tau knockdown reveals overlapping early perturbations in axonogenesis pathways and unexpectedly lower tau phosphorylation. The authors propose that V337M tau perturbs normal tau functions during development, with p38 MAPK specifically linked to tau phosphorylation in mutant neurons.
Key findings
- RNA-seq, ATAC-seq, and phosphoproteomics showed that MAPT V337M and tau knockdown both perturb axonogenesis-related transcripts, chromatin accessibility, and protein phosphorylation; AP-1/cJun motifs were more accessible, and cJun/p-cJun were increased in mutant neurons.
- Direct imaging of day 5 neurons found that both MAPT V337M and MAPT knockdown decreased main axon length and total neurite length, without significantly perturbing axon branch or secondary neurite length.
- V337M tau was hypophosphorylated at one week of differentiation across many sites, including pS202/pT205 by AT8, and this was transient, approaching WT levels by two to four weeks; overexpressed V337M tau, but not WT or R406W tau, recapitulated lower phosphorylation.
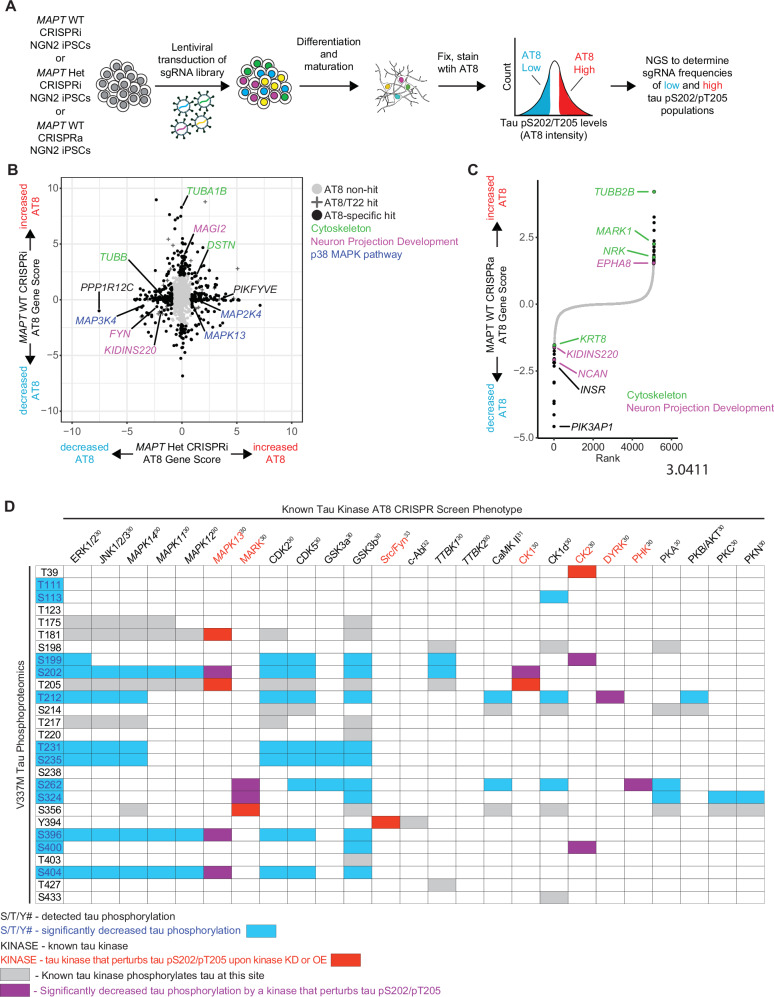
- CRISPR screens targeting 2,325 genes found cytoskeleton and neuron projection development regulators of tau phosphorylation in both MAPT WT and MAPT V337M neurons, while the p38 MAPK pathway specifically modified tau phosphorylation in MAPT V337M neurons.
Methods
- Human iPSC lines from WTC11 and GIH6C1 backgrounds were edited to generate isogenic MAPT WT, heterozygous V337M, and homozygous V337M neurons, with doxycycline-inducible Ngn2 differentiation and CRISPRi/a machinery for tau knockdown or screens.
- The study combined bulk RNA-seq at 2 and 4 weeks, ATAC-seq at 2 and 4 weeks, total proteomics and phosphoproteomics at 1 week, longitudinal live imaging of axonogenesis at day 5, western blots, in vitro phosphorylation assays with GSK3B and PKA, and pooled CRISPRi/a screens using an AT8-based FACS readout.
- Analyses included DESeq2 for RNA-seq/ATAC-seq, MACS2 and chromVAR for chromatin, Spectronaut/MSstats for proteomics, Enrichr for gene set enrichment, and MAGeCK-iNC for CRISPR screens.
Limitations
- The paper states that the neurons only express the fetal tau isoform 0N3R under the conditions used, that the study lacks mechanistic insight into how V337M causes tau loss of function, and that different disease variants of tau may have different effects.
- Evident from the text: findings are from iPSC-derived Ngn2 neurons at early differentiation timepoints, and the tau hypophosphorylation phenotype is transient, so relevance to mature neurons or aging/disease stages is not established.
- Evident from the text: the CRISPR screens used the AT8 antibody for pS202/pT205 and a druggable genome library, so regulators of other tau phosphosites or non-druggable genes may be missed.
Model-written summary. Check it against the paper before relying on it.
Integrity signals
Registry
Cites
Statistics
Figures
Verification
Claims the paper makes
0 Valid · 1 Not valid · 12 Not checked · 43 Own results and interpretations
A result the paper reports from its own data — it cites no other source for it, so there is none to check. The quote shows it is in the paper.
In the paper
“RNA-seq of neurons harvested at 2 and 4 weeks of differentiation revealed overlap between effects in MAPT Het neurons and MAPT WT tau knockdown neurons (Fig. 1B).”
§ Multi-omic phenotyping of MAPT V337M neurons reveals early changes in axonogenesis and tau phosphorylation > Results > MAPT V337M and MAPT knockdown perturb the transcription of axonogenesis-related genes
plainstates an association- Asserted: passes — The authors put it forward as true.
- Checkable: passes — It can be checked against evidence.
- Load-bearing: passes — The paper’s conclusions depend on it.
- Based: passes — The paper gives a reason why it holds.
A result the paper reports from its own data — it cites no other source for it, so there is none to check. The quote shows it is in the paper.
In the paper
“Surprisingly, we found that V337M tau causes tau hypophosphorylation.”
- Also stated in: § Discussion · plain
“causes tau hypophosphorylation”
§ Multi-omic phenotyping of MAPT V337M neurons reveals early changes in axonogenesis and tau phosphorylation > Discussion
plainstates a cause- Asserted: passes — The authors put it forward as true.
- Checkable: passes — It can be checked against evidence.
- Load-bearing: passes — The paper’s conclusions depend on it.
- Based: passes — The paper gives a reason why it holds.
- Also stated in: § Discussion · plain
A result the paper reports from its own data — it cites no other source for it, so there is none to check. The quote shows it is in the paper.
In the paper
“Transcription factor motif analysis showed that motifs for the AP-1 Transcription factor network, which includes the cJun family of transcription factors, were consistently more accessible in MAPT Het and MAPT WT tau knockdown neurons compared to controls (Figs. 1E, S2C).”
§ Multi-omic phenotyping of MAPT V337M neurons reveals early changes in axonogenesis and tau phosphorylation > Results > MAPT V337M and MAPT knockdown perturb the transcription of axonogenesis-related genes
plainstates an association- Asserted: passes — The authors put it forward as true.
- Checkable: passes — It can be checked against evidence.
- Load-bearing: passes — The paper’s conclusions depend on it.
- Based: passes — The paper gives a reason why it holds.
A result the paper reports from its own data — it cites no other source for it, so there is none to check. The quote shows it is in the paper.
In the paper
“PRKG1 knockdown increased AT8 levels specifically in MAPT Het neurons (Fig. S8A).”
§ Multi-omic phenotyping of MAPT V337M neurons reveals early changes in axonogenesis and tau phosphorylation > Results > CRISPR screens uncover regulators of tau phosphorylation in neurons
plainstates a cause- Asserted: passes — The authors put it forward as true.
- Checkable: passes — It can be checked against evidence.
- Load-bearing: passes — The paper’s conclusions depend on it.
- Based: passes — The paper gives a reason why it holds.
A result the paper reports from its own data — it cites no other source for it, so there is none to check. The quote shows it is in the paper.
In the paper
“There was significant overlap in the proteins with differential phosphorylation between MAPT Hom, MAPT Het, and *MAPT Het neurons vs. isogenic controls (Fig. 2B), though the identities of the differential phosphosites varied between conditions (Fig. S3A).”
§ Multi-omic phenotyping of MAPT V337M neurons reveals early changes in axonogenesis and tau phosphorylation > Results > MAPT V337M and tau knockdown perturb phosphorylation of axonogenesis-related proteins
plainstates an association- Asserted: passes — The authors put it forward as true.
- Checkable: passes — It can be checked against evidence.
- Load-bearing: passes — The paper’s conclusions depend on it.
- Based: passes — The paper gives a reason why it holds.
24 more claims
Create a free account to see all 56 claims and to verify the 14 references still open.
- It may state two separate claims as one. 16
- Probably not a substantial claim. 15
Claims other papers make about this one
Each is checked against this paper’s own text: does it say what the citing paper says it does?
In the citing paper
“Proteins with decreased abundance in both MAPT variant patient brains and MAPT V337M iNeurons are enriched for neuron projection pathways, consistent with our previously published findings on V337M tau and its effects on axonogenesis 23 .”
From Tau is an m 6 A-associated RNA binding protein that causes RNA dysregulation in disease (2026) · cites this paper as [23]
In the citing paper
“Identification of differentially abundant proteins revealed substantial overlap with our previously published proteomics on MAPT V337M iNeurons ( Figure 1A, Data S1 ) 23 .”
From Tau is an m 6 A-associated RNA binding protein that causes RNA dysregulation in disease (2026) · cites this paper as [23]
In the citing paper
“Using short-read RNA sequencing for HNRNPA2B1 knockdown iNeurons (this study) and MAPT knockdown and MAPT V337M iNeurons from our previous publication 23 , we observe that both mRNAs with increased and decreased abundance are enriched for those with hnRNAPA2B1 and/or tau binding ( Figure 6A ).”
From Tau is an m 6 A-associated RNA binding protein that causes RNA dysregulation in disease (2026) · cites this paper as [23]
In the citing paper
“Recently, we reported that this mutation affects axonogenesis, phenocopying the MAPT knockdown in that context 23 .”
From Tau is an m 6 A-associated RNA binding protein that causes RNA dysregulation in disease (2026) · cites this paper as [23]
Self-check
Percentages, sums and reported differences re-computed from the paper’s own numbers.
Each contradiction between two passages listed here was confirmed by an independent check.
Rated major: it would touch a result — a value a result rests on, reported and recomputed p-values on opposite sides of the significance level, two passages that conflict with no sign which is right, or a cited work retracted before this paper was published.
In the paper
§ Multi-omic phenotyping of MAPT V337M neurons reveals early changes in axonogenesis and tau phosphorylation > Results > MAPT V337M and tau knockdown perturb phosphorylation of axonogenesis-related proteins
“Gene set enrichment analysis identified substantial enrichment of axonogenesis-related protein phosphorylation changes in the 45 conserved proteins with differential phosphorylation in MAPT Hom neurons, tau knockout mice, and P301S tau mice (Fig. 2E).”
§ Multi-omic phenotyping of MAPT V337M neurons reveals early changes in axonogenesis and tau phosphorylation > Results > MAPT V337M and tau knockdown perturb phosphorylation of axonogenesis-related proteins
“D Proteins with differential phosphorylation between MAPT Het vs. MAPT WT and two published mouse phosphoproteomics datasets, including tau KO mice and P301S mice vs. WT mice. Significance was calculated using multiple t-tests adjusted with Šidák single-step correction. Proteins with differential phosphorylation in all three datasets were filtered to identify 45 conserved proteins.”
Rated major: it would touch a result — a value a result rests on, reported and recomputed p-values on opposite sides of the significance level, two passages that conflict with no sign which is right, or a cited work retracted before this paper was published.
In the paper
§ Multi-omic phenotyping of MAPT V337M neurons reveals early changes in axonogenesis and tau phosphorylation > Results > MAPT V337M and tau knockdown disrupt axonogenesis
“Total neurite length (C), main axon length (D), axon branch length (E), and secondary neurite length (F) were quantified in day 5 neurons. Significance was calculated using one-way ANOVA with Šidák’s multiple comparison test.”
§ Multi-omic phenotyping of MAPT V337M neurons reveals early changes in axonogenesis and tau phosphorylation > Methods > Longitudinal image analysis
“One-way ANOVA with Dunnett’s multiple comparison test was performed on single timepoint data.”
Rated minor: it would not touch a result — a value no result rests on, a p-value that stays on the same side of the significance level, or a conflict that is clerical, resolved elsewhere in the paper, or outside its own findings.
In the paper
§ Multi-omic phenotyping of MAPT V337M neurons reveals early changes in axonogenesis and tau phosphorylation > Results > CRISPR screens uncover regulators of tau phosphorylation in neurons
“We transduced iPSCs with a lentiviral sgRNA library targeting 2,325 genes encoding kinases, phosphatases, and other proteins in the “druggable genome”36.”
§ Multi-omic phenotyping of MAPT V337M neurons reveals early changes in axonogenesis and tau phosphorylation > Results > CRISPR screens uncover regulators of tau phosphorylation in neurons
“a pooled “druggable genome” sgRNA library targeting 2,318 genes enriched for kinases and phosphatases.”
Citations
Cites
Amyloid oligomers exacerbate tau pathology in a mouse model of tauopathy
Selenica, M.-L. B., Brownlow, M., Jimenez, J. P., Lee, D. C., Pena, G., Dickey, C. A., Gordon, M. N., & Morgan, D. (2013) · Neurodegenerative Diseases · doi:10.1159/000337230 · Cited by 10,359
Enrichr: interactive and collaborative HTML5 gene list enrichment analysis tool
Chen, E. Y., Tan, C. M., Kou, Y., Duan, Q., Wang, Z., Meirelles, G. V., Clark, N. R., & Ma’ayan, A. (2013) · BMC Bioinformatics · doi:10.1186/1471-2105-14-128 · Cited by 7,814
An improved ATAC-seq protocol reduces background and enables interrogation of frozen tissues
Corces, M. R., Trevino, A. E., Hamilton, E. G., Greenside, P. G., Sinnott-Armstrong, N. A., Vesuna, S., Satpathy, A. T., Rubin, A. J., Montine, K. S., Wu, B., et al. (2017) · Nature Methods · doi:10.1038/nmeth.4396 · Cited by 2,496
Globally optimal stitching of tiled 3D microscopic image acquisitions
Preibisch, S., Saalfeld, S., & Tomancak, P. (2009) · Bioinformatics · doi:10.1093/bioinformatics/btp184 · Cited by 2,452
Tau in physiology and pathology
Wang, Y., & Mandelkow, E. (2016) · Nature Reviews Neuroscience · doi:10.1038/nrn.2015.1 · Cited by 2,251
Reducing Endogenous Tau Ameliorates Amyloid ß-Induced Deficits in an Alzheimer's Disease Mouse Model
Roberson, E. D., Scearce-Levie, K., Palop, J. J., Yan, F., Cheng, I. H., Wu, T., Gerstein, H., Yu, G.-Q., & Mucke, L. (2007) · Science · doi:10.1126/science.1141736 · Cited by 1,892
Dendritic Function of Tau Mediates Amyloid-β Toxicity in Alzheimer's Disease Mouse Models
Ittner, L. M., Ke, Y. D., Delerue, F., Bi, M., Gladbach, A., van Eersel, J., Wölfing, H., Chieng, B. C., Christie, M. J., Napier, I. A., et al. (2010) · Cell · doi:10.1016/j.cell.2010.06.036 · Cited by 1,821
Mutation-Specific Functional Impairments in Distinct Tau Isoforms of Hereditary FTDP-17
Hong, M. (1998) · Science · doi:10.1126/science.282.5395.1914 · Cited by 1,030
Horlbeck, M. A., Gilbert, L. A., Villalta, J. E., Adamson, B., Pak, R. A., Chen, Y., Fields, A. P., Park, C. Y., Corn, J. E., Kampmann, M., et al. (2016) · eLife · doi:10.7554/elife.19760 · Cited by 894
Self-citationStamer, K., Vogel, R., Thies, E., Mandelkow, E., & Mandelkow, E.-M. (2002) · The Journal of Cell Biology · doi:10.1083/jcb.200108057 · Cited by 885
Research works printed but not linked: 2
- Alzheimer, A. Uber eigenartige Erkrankung der Hirnrinde. All Z. Psychiatr. 64, 146–148 (1907).
- Naseri, N. N. et al. Specific Combinations of Physiological Tau Phosphorylation Regulate Tau-Microtubule Interactions in Developing Neurons. bioRxiv, (2025).
Cited by
Grosjean, P., Shevade, K., Nguyen, C., Ancheta, S., Mader, K., Franco, I., Heo, S.-J., Lewis, G. R., Zhao, D., Tolani, B., et al. (2025) · Nature Machine Intelligence · doi:10.1038/s42256-025-01156-x · Cited by 3
Self-citationRathore, S., Gupta, A., Shah, K., Chauhan, N. S., & Gupta, S. (2026) · Ageing Research Reviews · doi:10.1016/j.arr.2026.103301 · Cited by 2
Weitzman, S. A., Orrick, J., Fulton‐Howard, B., Renton, A. E., Fridrikh, M., McKetney, J., Dixon, G., Qi, L., Labrie‐Cleary, C., Rizzi, L., et al. (2026) · Neuron · doi:10.1016/j.neuron.2026.09.008 · Cited by 1
Self-citationTau is an m 6 A-associated RNA binding protein that causes RNA dysregulation in disease
Dixon, G., Keys, A., Rothamel, K., McKetney, J., Jiang, Y. X., Gordon, L. A., Page, M. L., Liu, C., Hou, K., Flanagan, K., et al. (2026) · doi:10.64898/2026.10.26.762095
Self-citationTsap, M. I., Navrotskaya, V., Labus, J., Ponimaskin, E. G., Yatsenko, A. S., & Shcherbata, H. R. (2026) · bioRxiv (Cold Spring Harbor Laboratory) · doi:10.64898/2026.08.24.746720
Metadata
- Authors
- Mohl, G. A., Dixon, G., Marzette, E., McKetney, J., Samelson, A. J., Serras, C. P., Jin, J., Ariqat, N., Keys, A., Chavira, C., Li, A., Boggess, S. C., Swaney, D. L., & Kampmann, M.
- Affiliations
- University of California, San Francisco (US)
- Gladstone Institutes (US)
- Corresponding author
- Kampmann, Martin
- ORCID
- Venue
- npj Dementia
- Published
- 2026-04-25
- Volume
- 2
- Issue
- 1
- Pages
- 24-24
- ISSN
- 3005-1940 (ISSN-L)
- PMC
- PMC13110130
- OpenAlex
- W7155651581
- Semantic Scholar
- b68a1dadd40ce1e2bfe2a5a84b9f13776ab141fb
- Cited by
- 5
- References
- 93
- Citations by year
- 2026: 4
- FWCI
- 5.73
- Type
- journal article
- Language
- en
- Open access
- hybrid
- doi.org
- Locations
- npj Dementia (publishedVersion, cc-by)
- bioRxiv (Cold Spring Harbor Laboratory) (submittedVersion, cc-by)
- PubMed (publishedVersion)
- PubMed Central (publishedVersion, cc-by)
- Funders
- A.P. Gianni Foundation (Postdoctoral Fellowship)
- National Institute for neurological disorders and stroke (U54 NS123746, U54 NS100717)
- National Institute on Aging (F32 AG063487, R01 AG062359)
- Alzheimer’s Association (23AARF-1027616)
- Rainwater Charitable Foundation (Tau Consortium Award)
- Chan Zuckerberg Initiative (Ben Barres Early Career Acceleration Award)
- Topics
- Life Sciences › Neuroscience › Cellular and Molecular Neuroscience › Alzheimer's disease research and treatments
- Health Sciences › Medicine › Psychiatry and Mental health › Dementia and Cognitive Impairment Research
- Health Sciences › Medicine › Clinical Neurology › Amyotrophic Lateral Sclerosis Research
- Keywords
- tau phosphorylation, axonogenesis, axon morphology, iPSC-derived neurons, p38 MAPK pathway, tau aggregation, Alzheimer's disease, frontotemporal dementia, neuronal development
About these checks
Registry, retraction, Cites and statistics results are computed, not judged, with one exception: a printed reference that no index lists is read once by a model before it counts as a citation error. Claims are extracted by a model and kept only when their quote appears verbatim in the text; each cited source is then checked, with a model’s help, for whether it says what the claim relies on. Those verdicts can be wrong — read the claim’s quote and the cited source before relying on one.
A language model drew the claims from the paper on 2026-11-13, under version 3 of the claim definition (model deepseek-v4.1-flash, prompt extract-v3).
A second model labelled each claim on 2026-11-13 (model jev-1.13-20260917, definition revision gold-guideline-v0.2).
Statistics and arithmetic are recomputed, not judged.
Confidence bands are shown only for fields calibrated on our annotated test set. None is calibrated yet, so no band is shown.
What counts as a claim ›How we measure confidence ›How we check this ›
Are you an author, or do you see a problem with this page? Request a review
Data sources
Bibliographic data: Semantic Scholar, OpenAlex, Crossref.
Contains information from the Semantic Scholar Academic Graph Datasets, made available under the ODC Attribution License (ODC-BY 1.0).
Semantic Scholar’s data is described in: Kinney, R., et al. (2023). The Semantic Scholar Open Data Platform. arXiv:2301.10140.
