

The DOI matches its Crossref record; 41 of the 41 references it cites were found in a registry or an index.
Hyaluronidase induces a transcapillary pressure gradient and improves the distribution and uptake of liposomal doxorubicin (Caelyx™) in human osteosarcoma xenografts
Open accessAbstract
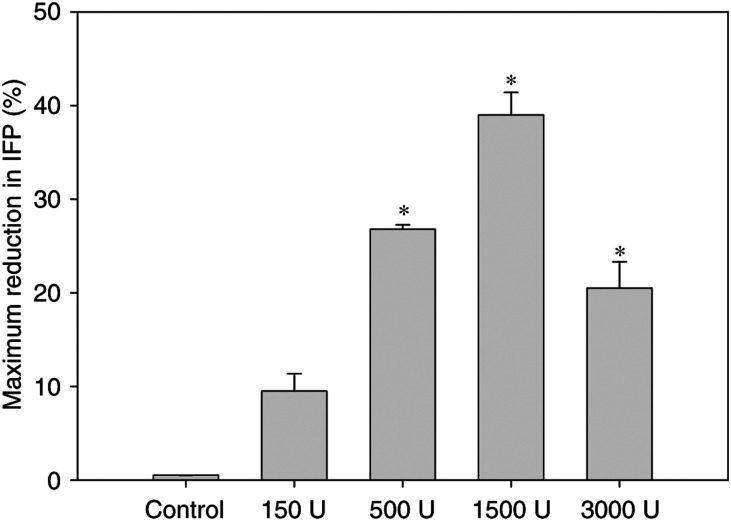
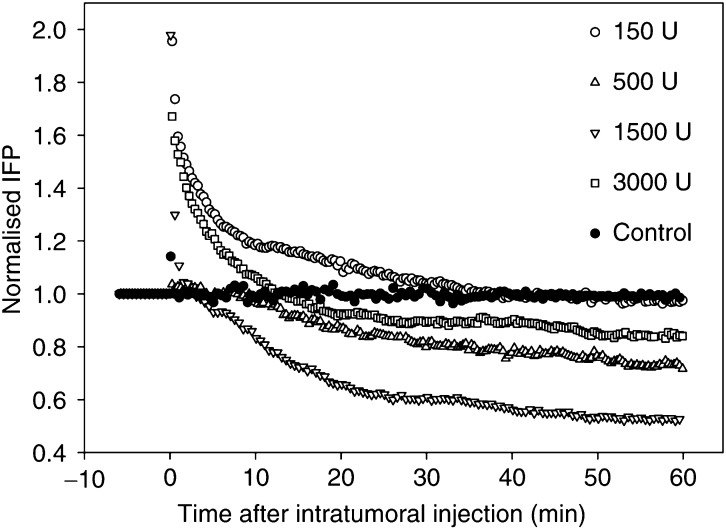
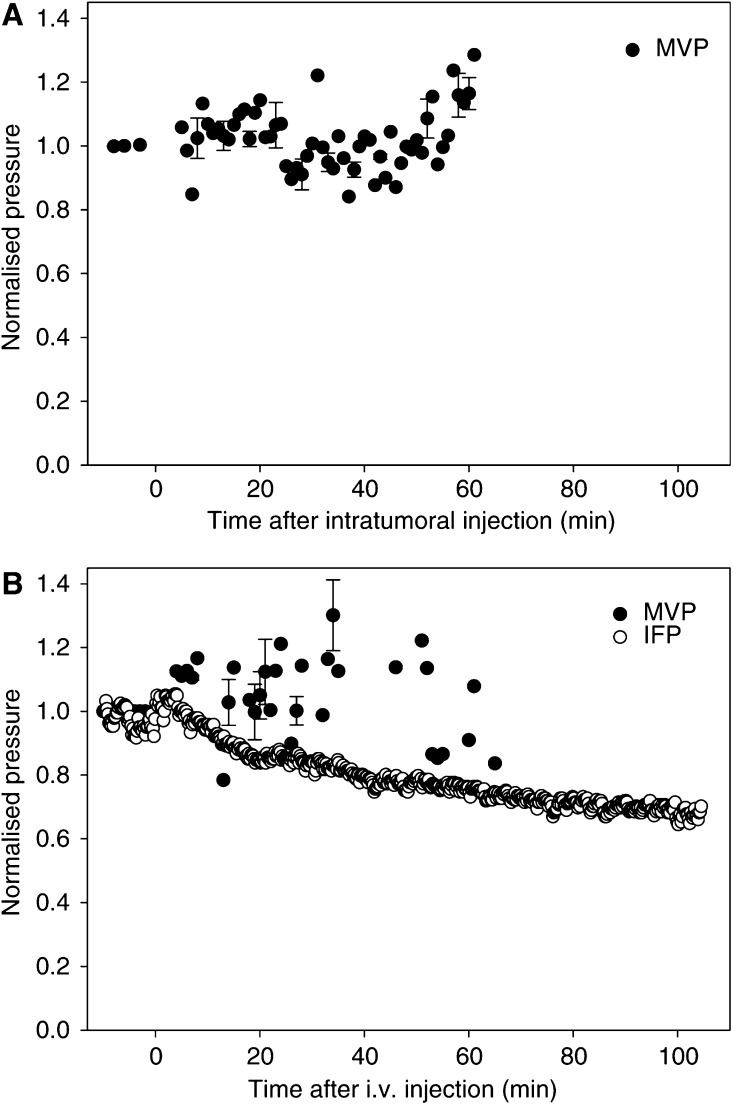
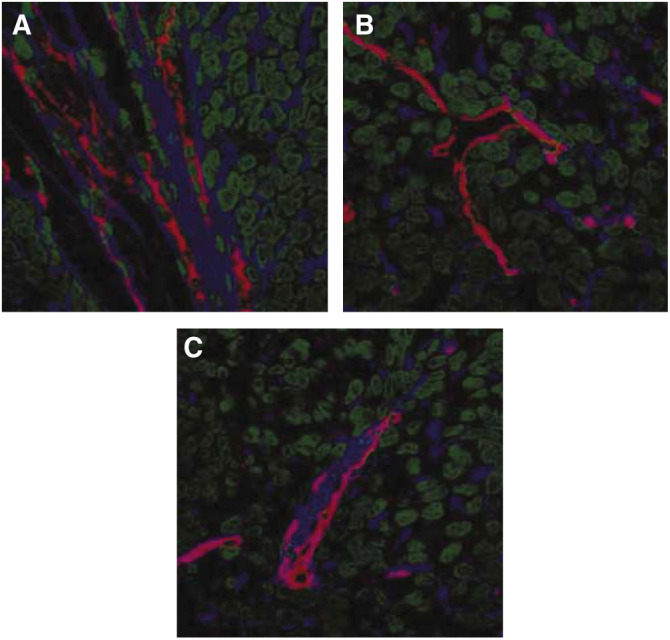
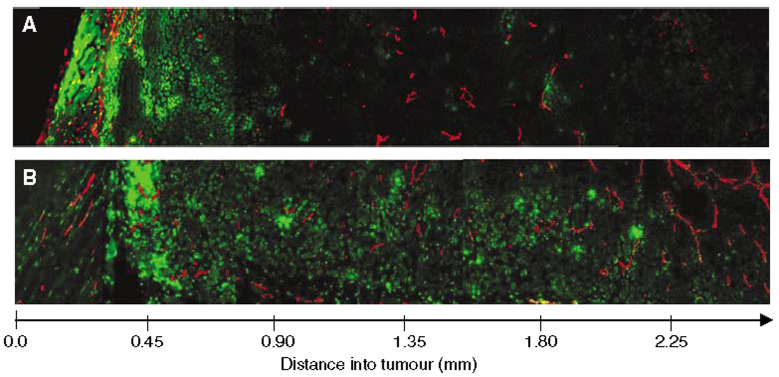
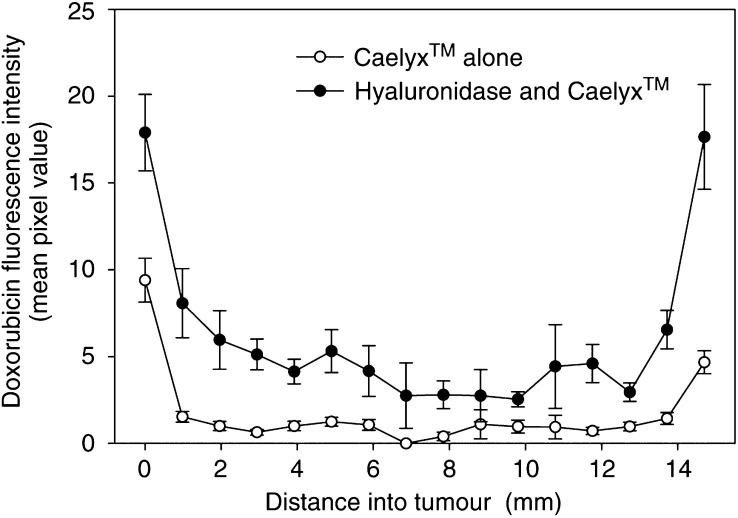
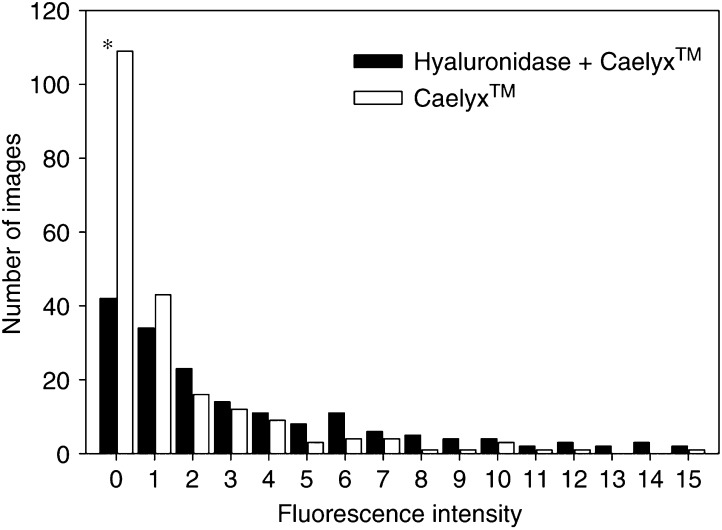
Liposomal drug delivery enhances the tumour selective localisation and may improve the uptake compared to free drug. However, the drug distribution within the tumour tissue may still be heterogeneous. Degradation of the extracellular matrix is assumed to improve the uptake and penetration of drugs. The effect of the ECM-degrading enzyme hyaluronidase on interstitial fluid pressure and microvascular pressure were measured in human osteosarcoma xenografts by the wick-in-needle and micropipette technique, respectively. The tumour uptake and distribution of liposomal doxorubicin were studied on tumour sections by confocal laser scanning microscopy. The drugs were injected i.v. 1 h after the hyaluronidase pretreatment. Intratumoral injection of hyaluronidase reduced interstitial fluid pressure in a nonlinear dose-dependent manner. Maximum interstitial fluid pressure reduction of approximately 50% was found after injection of 1500 U hyaluronidase. Neither intratumoral nor i.v. injection of hyaluronidase induced any changes in the microvascular pressure. Thus, hyaluronidase induced a transcapillary pressure gradient, resulting in a four-fold increase in the tumour uptake and improving the distribution of the liposomal doxorubicin. Hyaluronidase reduces a major barrier for drug delivery by inducing a transcapillary pressure gradient, and administration of hyaluronidase adjuvant with liposomal doxorubicin may thus improve the therapeutic outcome.
Overview
The claims and statistics of this paper haven’t been checked yet.
Run the check — free, no account needed. It reads the open-access text and checks the sources it cites.
Integrity signals
Registry
Cites
Statistics
Figures
Verification
Claims the paper makes
The claims and statistics of this paper haven’t been checked yet.
Run the check — free, no account needed. It reads the open-access text and checks the sources it cites.
Claims other papers make about this one
Each is checked against this paper’s own text: does it say what the citing paper says it does?
In the citing paper
“Besides, for the fibrotic lesion, degradation of the extracellular matrix using collagenase or hyaluronidase can be effective strategies to enhance accumulation [161, 162].”
From Non-viral delivery systems for CRISPR/Cas9-based genome editing: challenges and opportunities (2018) · cites this paper as [162]
Self-check
Percentages, sums and reported differences re-computed from the paper’s own numbers.
The self-check needs the paper’s full text.
Citations
Cites
Gabizón, A., Catane, R., Uziely, B., Kaufman, B., Safra, T., Cohen, R., Martin, F., Huang, A., & Barenholz, Y. (1994) · PubMed · Cited by 1,382
Yuan, F., Leunig, M., Huang, S. K., Berk, D. A., Papahadjopoulos, D., & Jain, R. K. (1994) · PubMed · Cited by 908
Dynamic imaging of collagen and its modulation in tumors in vivo using second-harmonic generation
Brown, E. B., McKee, T. D., DiTomaso, E., Pluen, A., Seed, B., Boucher, Y., & Jain, R. K. (2003) · Nature Medicine · doi:10.1038/nm879 · Cited by 844
(1990) · PubMed · Cited by 757
Jain, R. K., & Baxter, L. T. (1988) · PubMed · Cited by 710
Pluen, A., Boucher, Y., Ramanujan, S., McKee, T. D., Gohongi, T., di Tomaso, E., Brown, E. B., Izumi, Y., Campbell, R. B., Berk, D. A., et al. (2001) · Proceedings of the National Academy of Sciences · doi:10.1073/pnas.081626898 · Cited by 613
Harris, L. N., Batist, G., Belt, R. J., Rovira, D., Navari, R. M., Azarnia, N., Welles, L., Winer, E. P., & TLC D‐99 Study Group (2001) · Cancer · doi:10.1002/cncr.10201 · Cited by 517
Boucher, Y., & Jain, R. K. (1992) · PubMed · Cited by 510
Polyethylenglykol-umhülltes (pegyliertes) liposomales Doxorubicin
Gabizón, A., & Martin, F. (1997) · Drugs · doi:10.2165/00003495-199700544-00005 · Cited by 478
Pulsatile pressures in the microcirculation of frog's mesentery
Wiederhielm, C. A., Woodbury, J. W., Kirk, S., & Rushmer, R. F. (1964) · American Journal of Physiology-Legacy Content · doi:10.1152/ajplegacy.1964.207.1.173 · Cited by 439
Cited by
Sorted by citations
Items 201–221 of 221
Obstructions in Nanoparticles Conveyance, Nano-Drug Retention, and EPR Effect in Cancer Therapies
Fakhri, K. U., Sultan, A., Mushtaque, M., Hasan, M. R., Nafees, S., Hafeez, Z. B., Zafaryab, M., Rizwanullah, M., Sharma, D., Bano, F., et al. (2020) · Advances in medical diagnosis, treatment, and care (AMDTC) book series · doi:10.4018/978-1-7998-6530-8.ch026 · Cited by 2
Hyaluronan in the Extracellular Matrix of Hematological and Solid Tumors. Its Biological Effects
Icardi, A., Lompardía, S. L., Papademetrio, D. L., Rosales, P., Díaz, M., Pibuel, M. A., Alaniz, L. D., & Alvarez, E. E. (2022) · Biology of extracellular matrix · doi:10.1007/978-3-030-99708-3_7 · Cited by 2
Rafei, H., Başar, R., Rezvani, K., & Daher, M. (2023) · Elsevier eBooks · doi:10.1016/b978-0-12-822620-9.00021-5 · Cited by 1
Role of extracellular matrix in chordoma progression and therapeutic resistance
Ren, C., Hornicek, F. J., Rosenberg, A. E., Yue, B., & Duan, Z. (2025) · Critical Reviews in Oncology/Hematology · doi:10.1016/j.critrevonc.2025.105073 · Cited by 1
Engineering ECM-Responsive Nanomedicine to Overcome Tumor Stromal Barriers
Swain, K., & Pattnaik, S. (2026) · ACS Applied Bio Materials · doi:10.1021/acsabm.6c01118 · Cited by 1
Intravital Microscopy for Molecular Imaging in Cancer Research
Yu, H., & Gambhir, S. S. (2014) · Springer eBooks · doi:10.1007/978-94-017-9361-2_12
Makeen, H. A. (2012) · Bradford Scholars (University of Bradford)
Mikhail, A. S. (2013) · TSpace (University of Toronto)
Design and Synthesis of Self-Assembled Polymeric Nanoparticles for Cancer Drug Delivery
Logie, J. (2017) · TSpace (University of Toronto)
[A case of Marie-Leri syndrome].
Otto, L. (1966) · PubMed
Nanotechnology and Precision Medicine
Alonazi, N. A., Albukhari, T. A., & Alruwaili, N. M. (2023) · BENTHAM SCIENCE PUBLISHERS eBooks · doi:10.2174/9789815124606123010008
Al-Ahmady, Z. S. (2013) · UCL Discovery (University College London)
Jurj, A., Ionescu, C., Berindan‐Neagoe, I., & Braicu, C. (2022) · Figshare · doi:10.6084/m9.figshare.21151438
Morosi, L., Meroni, M., Ubezio, P., Fuso Nerini, I., Minoli, L., Porcu, L., Panini, N., Colombo, M., Blouw, B., Kang, D. W., et al. (2021) · Figshare · doi:10.6084/m9.figshare.16607067
Xu, L., Zhang, K., Ma, X., Li, Y., Jin, Y., Liang, C., Wang, Y., Duan, W., Zhang, H., Zhang, Z., et al. (2022) · Figshare · doi:10.6084/m9.figshare.21251785
Exploring drug delivery mechanisms and bioavailability for enhanced precision medicine
Priya, K., Saranya, E., Rajalakshmi, E., Merrin, S. B., Pooja, P., Petricia, R. A., Kapoor, A., & Ramya, M. (2026) · Elsevier eBooks · doi:10.1016/b978-0-443-41578-4.00017-1
Novruzov, M., Raval, K. Y., Mammadova, M., Khan, W. U., Inam, U. K., Shiraliyeva, U., & Saleem, A. (2026) · In Silico Pharmacology · doi:10.1007/s40203-026-00685-6
“…al. 2013 ; Ying et al. 2012), (3) ethanol-mediated oxidative stress (Wu and Cederbaum 2003 ; Seitz and Stickel 2007), and (4) protease-driven stromal remodeling (Parr et al. 2007; Egeblad et al. 2010), synergized by CHC-mediated collagen degradation (Matsushita et al. 1998; Eikenes et al. 2005 ).”
Sonopermeation to Overcome Barriers for Delivery of Drugs to Tumors and Brain Tissue
Davies, C. D. L., & Snipstad, S. (2026) · Cellular and Molecular Bioengineering · doi:10.1007/s12195-026-00928-8
Strategies to enhance drug retention after intratumoral and locoregional therapy: A scoping review
DEMIRORS, B., GODBOLE, N., BROCK, L. F., Bowers, J. B., Puri, R., Yadav, A., Mahesh, V., Jimenez, P. B., Manaise, H. K., Veenstra, B., et al. (2026) · Journal of Controlled Release · doi:10.1016/j.jconrel.2026.115416
Penetration of Paclitaxel in Multicellular Layers of Human Colorectal Cancer Cells
(2006) · Journal of Korean Pharmaceutical Sciences · doi:10.4333/kps.2006.36.6.385
Metadata
- Authors
- Eikenes, L., Tari, M., Tufto, I., Bruland, Ø. S., & de Lange Davies, C.
- Affiliations
- Norwegian University of Science and Technology (NO)
- University of Oslo (NO)
- Corresponding author
- Eikenes, L
- Venue
- British Journal of Cancer
- Published
- 2005-06-07
- Volume
- 93
- Issue
- 1
- Pages
- 81-88
- ISSN
- 0007-0920 (ISSN-L)
- 1532-1827
- PMC
- PMC2361478
- OpenAlex
- W1985957186
- Cited by
- 221
- References
- 41
- Citations by year
- 2026: 7 · 2025: 8 · 2024: 10 · 2023: 9 · 2022: 19 · 2021: 13 · 2020: 17 · 2019: 13 · 2018: 15 · 2017: 11 · 2016: 14 · 2015: 11 · 2014: 16 · 2013: 10 · 2012: 12
- FWCI
- 2.04
- Type
- journal article
- Language
- en
- Open access
- hybrid
- doi.org
- Licence
- cc-by-nc-sa
- www.springer.com/tdm (unspecified)
- Locations
- British Journal of Cancer (publishedVersion, cc-by-nc-sa)
- PubMed Central (publishedVersion, cc-by)
- PubMed (publishedVersion)
- Funders
- Kreftforeningen
- Topics
- Life Sciences › Biochemistry, Genetics and Molecular Biology › Cell Biology › Proteoglycans and glycosaminoglycans research
- Physical Sciences › Materials Science › Biomaterials › Nanoparticle-Based Drug Delivery
- Physical Sciences › Engineering › Biomedical Engineering › Ultrasound and Hyperthermia Applications
- Keywords
- hyaluronidase, liposomal doxorubicin, pegylated liposomal doxorubicin, osteosarcoma, interstitial fluid pressure, extracellular matrix degradation, microvascular pressure, tumor xenografts, drug delivery enhancement
- MeSH terms
- Animals, Antibiotics, Antineoplastic, Doxorubicin, Female, Humans, Hyaluronoglucosaminidase, Liposomes, Mice, Inbred BALB C, Osteosarcoma, Transplantation, Heterologous, Microscopy, Confocal, Mice
About these checks
Registry, retraction, Cites and statistics results are computed, not judged, with one exception: a printed reference that no index lists is read once by a model before it counts as a citation error. Claims are extracted by a model and kept only when their quote appears verbatim in the text; each cited source is then checked, with a model’s help, for whether it says what the claim relies on. Those verdicts can be wrong — read the claim’s quote and the cited source before relying on one.
Statistics and arithmetic are recomputed, not judged.
Confidence bands are shown only for fields calibrated on our annotated test set. None is calibrated yet, so no band is shown.
What counts as a claim ›How we measure confidence ›How we check this ›
Are you an author, or do you see a problem with this page? Request a review
