

The DOI matches its Crossref record; 35 of the 35 references it cites were found in a registry or an index.
Methotrexate used in combination with aminolaevulinic acid for photodynamic killing of prostate cancer cells
Open accessAbstract
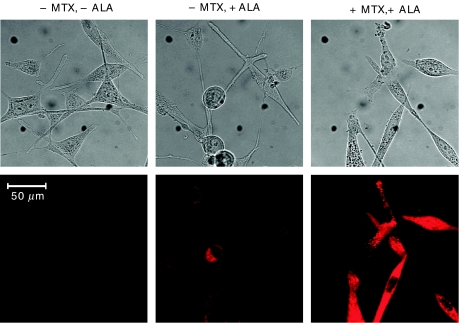
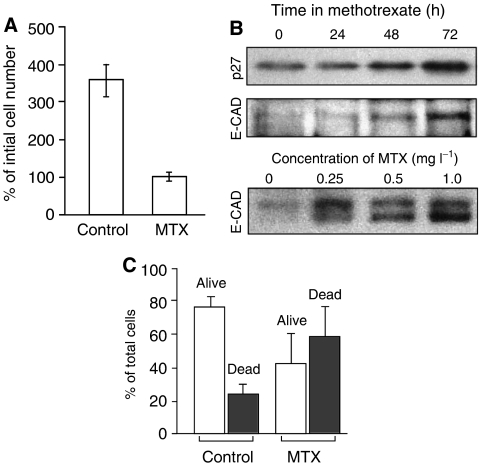
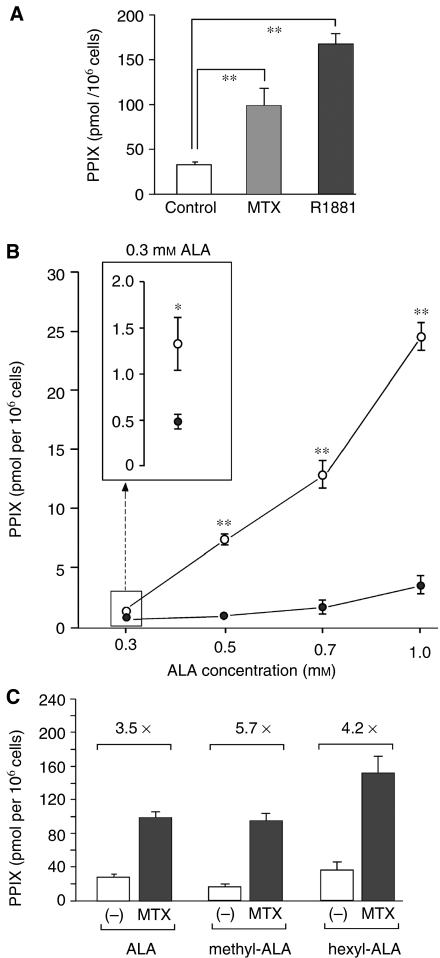
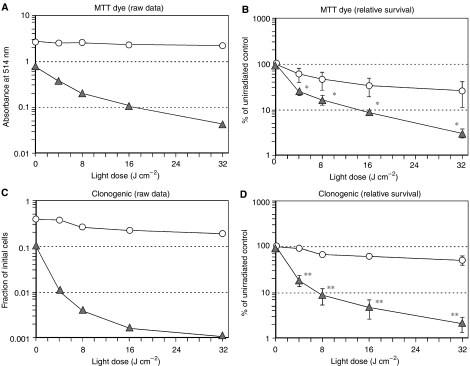
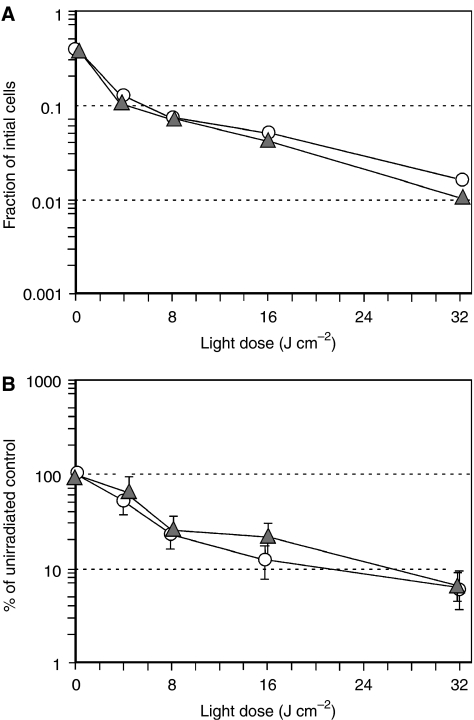
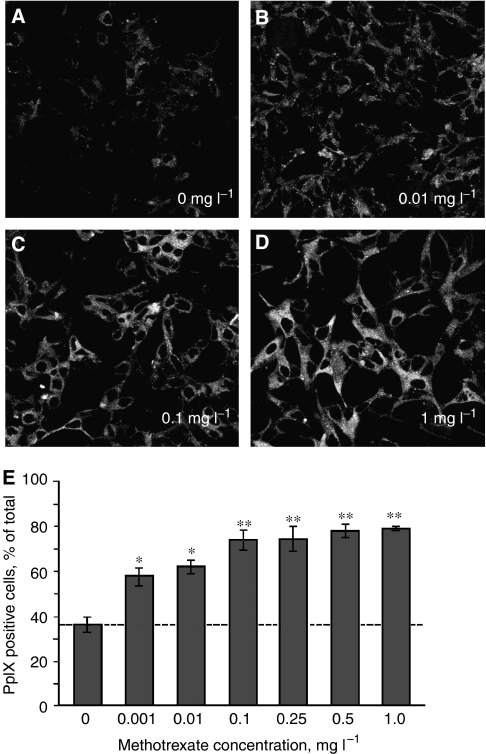
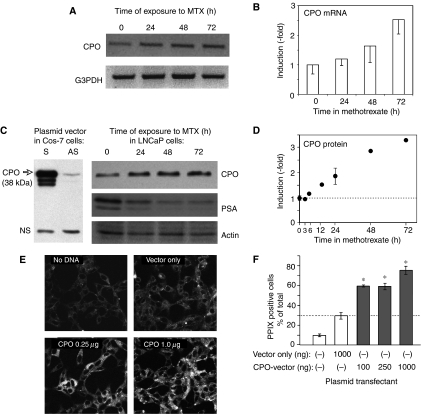
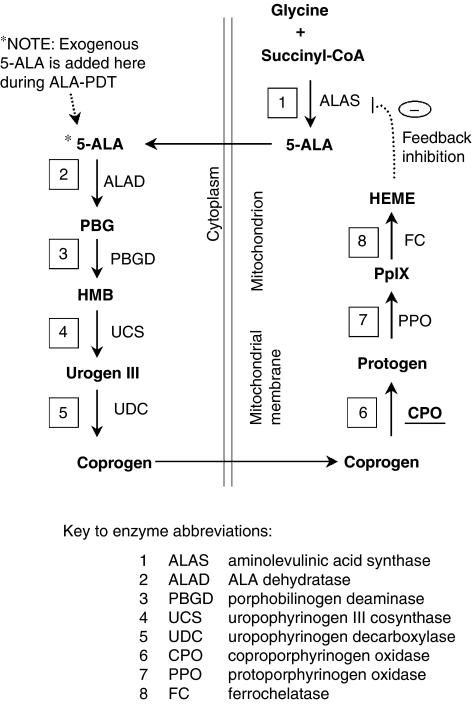
Photodynamic therapy (PDT) using 5-aminolaevulinic acid (ALA) to drive production of an intracellular photosensitiser, protoporphyrin IX (PpIX), is a promising cancer treatment. However, ALA-PDT is still suboptimal for thick or refractory tumours. Searching for new approaches, we tested a known inducer of cellular differentiation, methotrexate (MTX), in combination with ALA-PDT in LNCaP cells. Methotrexate alone promoted growth arrest, differentiation, and apoptosis. Methotrexate pretreatment (1 mg l(-1), 72 h) followed by ALA (0.3 mM, 4 h) resulted in a three-fold increase in intracellular PpIX, by biochemical and confocal analyses. After exposure to 512 nm light, killing was significantly enhanced in MTX-preconditioned cells. The reverse order of treatments, ALA-PDT followed by MTX, yielded no enhancement. Methotrexate caused a similar relative increase in PpIX, whether cells were incubated with ALA, methyl-ALA, or hexyl-ALA, arguing against a major effect upon ALA transport. Searching for an effect among porphyrin synthetic enzymes, we found that coproporphyrinogen oxidase (CPO) was increased three-fold by MTX at the mRNA and protein levels. Transfection of LNCaP cells with a CPO-expressing vector stimulated the accumulation of PpIX. Our data suggest that MTX, when used to modulate intracellular production of endogenous PpIX, may provide a new combination PDT approach for certain cancers.
Overview
The claims and statistics of this paper haven’t been checked yet.
Run the check — free, no account needed. It reads the open-access text and checks the sources it cites.
Integrity signals
Registry
Cites
Statistics
Figures
Verification
Claims the paper makes
The claims and statistics of this paper haven’t been checked yet.
Run the check — free, no account needed. It reads the open-access text and checks the sources it cites.
Claims other papers make about this one
Each is checked against this paper’s own text: does it say what the citing paper says it does?
The cited source says what the claim attributes to it.
In the citing paper
“Furthermore, it has been revealed that pretreatment of LNCaP tumor cells with methotrexate significantly improved ALA-PDT efficacy. This effect was related to increased synthesis of coproporphyrinogen oxidase, which stimulated the accumulation of PpIX [47].”
From Aminolevulinic Acid (ALA) as a Prodrug in Photodynamic Therapy of Cancer (2011) · cites this paper as [47]
Self-check
Percentages, sums and reported differences re-computed from the paper’s own numbers.
The self-check needs the paper’s full text.
Citations
Cites
Photodynamic therapy with endogenous protoporphyrin
Kennedy, J. C., Pottier, R. H., & Pross, D. C. (1990) · Journal of Photochemistry and Photobiology B: Biology · doi:10.1016/1011-1344(90)85083-9 · Cited by 1,509
Dermatology in General Medicine.
(1988) · Annals of Internal Medicine · doi:10.7326/0003-4819-108-3-503_2 · Cited by 1,242
Improved Detection of Urothelial Carcinoma In Situ With Hexaminolevulinate Fluorescence Cystoscopy
Schmidbauer, J., Witjes, F., Schmeller, N. T., Donat, R., Susani, M., Marberger, M., & MEMBERS OF THE HEXVIX PCB301/01 STUDY GROUP (2004) · The Journal of Urology · doi:10.1097/01.ju.0000100480.70769.0e · Cited by 346
Kennedy, J. C., Marcus, S. L., & Pottier, R. (1996) · Journal of Clinical Laser Medicine & Surgery · doi:10.1089/clm.1996.14.289 · Cited by 286
A mechanistic study of cellular photodestruction with 5-aminolaevulinic acid-induced porphyrin
Iinuma, S., Farshi, S., Ortel, B., & Hasan, T. (1994) · British Journal of Cancer · doi:10.1038/bjc.1994.244 · Cited by 240
Self-citationCampbell, M. J., Elstner, E., Holden, S., Uskoković, M. R., & Koeffler, H. P. (1997) · Journal of Molecular Endocrinology · doi:10.1677/jme.0.0190015 · Cited by 188
Role of antimetabolites of purine and pyrimidine nucleotide metabolism in tumor cell differentiation
Hatse, S., Clercq, E. D., & Balzarini, J. M. (1999) · Biochemical Pharmacology · doi:10.1016/s0006-2952(99)00035-0 · Cited by 186
Rud, E., Gederaas, O. A., Høgset, A., & Berg, K. (2000) · Photochemistry and Photobiology · doi:10.1562/0031-8655(2000)0710640aabnaa2.0.co2 · Cited by 170
A Review of Laser and Photodynamic Therapy for the Treatment of Nonmelanoma Skin Cancer
Marmur, E. S., Schmults, C. D., & Goldberg, D. J. (2004) · Dermatologic Surgery · doi:10.1111/j.1524-4725.2004.30083.x · Cited by 164
Berkowitz, R. S., GOLDSTEIN, D. P., & Bernstein, M. R. (1986) · Gynecologic Oncology · doi:10.1016/0090-8258(86)90123-x · Cited by 157
Waidelich, R. M., Stepp, H. G., Baumgartner, R., Weninger, E., Hofstetter, A. G., & Kriegmair, M. (2001) · The Journal of Urology · doi:10.1016/s0022-5347(05)66239-8 · Cited by 142
Bodner, A. J., Gallo, R. C., & Gallo, R. C. (1981) · JNCI Journal of the National Cancer Institute · doi:10.1093/jnci/67.5.1025 · Cited by 118
5-Aminolevulinic acid-based photodynamic detection and therapy of brain tumors (Review)
Friesen, S. A., Hjortland, G. O., Madsen, S. J., Hirschberg, H., Engebråten, O., Nesland, J. M., & Peng, Q. (2002) · International Journal of Oncology · doi:10.3892/ijo.21.3.577 · Cited by 112
Ortel, B. J., Chen, N., Brissette, J. L., P., D. G., Maytin, E. V., & Hasan, T. G. (1998) · British Journal of Cancer · doi:10.1038/bjc.1998.292 · Cited by 95
Self-citationMorphological differentiation of human choriocarcinoma cells induced by methotrexate.
Friedman, S., & Skehan, P. (1979) · PubMed · Cited by 93
Ortel, B. J., Sharlin, D. S., O'Donnell, D. A., Sinha, A. K., Maytin, E. V., & Hasan, T. G. (2002) · British Journal of Cancer · doi:10.1038/sj.bjc.6600575 · Cited by 79
Self-citationKohno, H., Furukawa, T., Yoshinaga, T., Tokunaga, R., & Taketani, S. (1993) · Journal of Biological Chemistry · doi:10.1016/s0021-9258(19)36931-5 · Cited by 67
Eker, C., Montan, S., Jaramillo, E., Koizumi, K., Rubio‐Terres, C., Andersson‐Engels, S., Svanberg, K., Svanberg, S. R., & Slezak, P. P. (1999) · Gut · doi:10.1136/gut.44.4.511 · Cited by 66
Hyaluronan suppresses epidermal differentiation in organotypic cultures of rat keratinocytes
Passi, A. G., Sadeghi, P., Kawamura, H., Anand, S., Sato, N., White, L. E., Hascall, V., & Maytin, E. V. (2004) · Experimental Cell Research · doi:10.1016/j.yexcr.2004.01.031 · Cited by 64
Self-citationGederaas, O. A., Holroyd, A., Brown, S. B., Vernon, D. I., Moan, J. E., & Berg, K. (2001) · Photochemistry and Photobiology · doi:10.1562/0031-8655(2001)0730164aameto2.0.co2 · Cited by 62
Conder, L., Woodard, S. I., & Dailey, H. A. (1991) · Biochemical Journal · doi:10.1042/bj2750321 · Cited by 62
Methotrexate induces apoptotic cell death in human keratinocytes
Heenen, M., Laporte, M., Noël, J., & Graef, C. D. (1998) · Archives of Dermatological Research · doi:10.1007/s004030050298 · Cited by 62
Methotrexate induces differentiation of human keratinocytes.
Schwartz, P. M., Barnett, S. K., Atillasoy, E. S., & Milstone, L. M. (1992) · Proceedings of the National Academy of Sciences · doi:10.1073/pnas.89.2.594 · Cited by 58
Differential Regulation of Coproporphyrinogen Oxidase Gene Between Erythroid and Nonerythroid Cells
Takahashi, S., Taketani, S., Akasaka, J.-E., Kobayashi, A., Hayashi, N., Yamamoto, M. P., & Nagai, T. (1998) · Blood · doi:10.1182/blood.v92.9.3436 · Cited by 38
The Biological Therapy of Cancer
Parkinson, D. R. (1992) · Canadian Journal of Infectious Diseases and Medical Microbiology · doi:10.1155/1992/420495 · Cited by 36
Taketani, S., Yoshinaga, T., Furukawa, T., Kohno, H., Tokunaga, R., Nishimura, K., & Inokuchi, H. (1995) · European Journal of Biochemistry · doi:10.1111/j.1432-1033.1995.0760h.x · Cited by 35
Burres, N. S., & Cass, C. E. (1987) · PubMed · Cited by 28
Taketani, S., Furukawa, T., & Furuyama, K. (2001) · European Journal of Biochemistry · doi:10.1046/j.1432-1033.2001.02045.x · Cited by 27
Hatse, S., Naesens, L. M. J., Clercq, E. D., & Balzarini, J. M. (1998) · Biochemical Pharmacology · doi:10.1016/s0006-2952(98)00058-6 · Cited by 19
Douer, D. (2000) · Current Treatment Options in Oncology · doi:10.1007/s11864-000-0013-1 · Cited by 14
Detection of bladder dysplasia using 5‐aminolaevulinic acid‐induced porphyrin fluorescence
Landry, J. L., Gelet, A., Bouvier, R., Dubernard, J. M., Martin, X. S., & Colombel, M. C. (2003) · British Journal of Urology · doi:10.1046/j.1464-410x.2003.04182.x · Cited by 12
Ross, S. A., Jones, C. S., & Luca, L. M. D. (1995) · International Journal of Cancer · doi:10.1002/ijc.2910620312 · Cited by 12
de Koning, B. A. E., Lindenbergh-Kortleve, D. J., Pieters, R., Rings, E. H. H. M., Büller, H. A., Renes, I. B., & Einerhand, A. W. C. (2005) · Cancer Chemotherapy and Pharmacology · doi:10.1007/s00280-005-0119-z · Cited by 10
Kessel, D. H. (2006) · Cited by 4
Maytin, E. V., Anand, S., Sato, N., Moore, B., Mack, J. A., Gasbarre, C. C., Keevey, S., Ortel, B. J., Sinha, A. K., & Khachemoune, A. (2006) · Proceedings of SPIE, the International Society for Optical Engineering/Proceedings of SPIE · doi:10.1117/12.646880 · Cited by 3
Self-citation
Cited by
Sorted by citations
Photodynamic therapy of cancer: An update
Agostinis, P., Berg, K., Cengel, K. A., Foster, T. H., Girotti, A. W., Gollnick, S. O., Hahn, S. M., Hamblin, M. R., Juzeniene, A., Kessel, D., et al. (2011) · CA: A Cancer Journal for Clinicians · doi:10.3322/caac.20114 · Cited by 5,145
Chemophototherapy: An Emerging Treatment Option for Solid Tumors
Luo, D., Carter, K. A., Miranda, D., & Lovell, J. F. (2016) · Advanced Science · doi:10.1002/advs.201600106 · Cited by 441
Koźmiński, P., Halik, P. K., Chesori, R., & Gniazdowska, E. (2020) · International Journal of Molecular Sciences · doi:10.3390/ijms21103483 · Cited by 326
Mechanisms of Resistance to Photodynamic Therapy
Casas, A. G., Venosa, G. M. D., Hasan, T. G., & Batlle, A. M. D. C. (2011) · Current Medicinal Chemistry · doi:10.2174/092986711795843272 · Cited by 327
Self-citationAminolevulinic Acid (ALA) as a Prodrug in Photodynamic Therapy of Cancer
Wachowska, M., Muchowicz, A., Firczuk, M., Gabrysiak, M., Winiarska, M., Wańczyk, M., Bojarczuk, K., & Golab, J. (2011) · Molecules · doi:10.3390/molecules16054140 · Cited by 265
Metadata
- Authors
- Sinha, A. K., Anand, S., Ortel, B. J., Chang, Y., Mai, Z., Hasan, T., & Maytin, E. V.
- Affiliations
- Harvard University (US)
- Cleveland Clinic (US)
- Corresponding author
- Maytin, E V
- Venue
- British Journal of Cancer
- Published
- 2006-07-25
- Volume
- 95
- Issue
- 4
- Pages
- 485-495
- ISSN
- 0007-0920 (ISSN-L)
- 1532-1827
- PMC
- PMC2360674
- OpenAlex
- W1994983260
- Cited by
- 114
- References
- 35
- Citations by year
- 2026: 2 · 2025: 3 · 2024: 4 · 2023: 6 · 2022: 4 · 2021: 2 · 2020: 9 · 2019: 3 · 2018: 5 · 2017: 4 · 2016: 7 · 2015: 5 · 2014: 12 · 2013: 4 · 2012: 9
- FWCI
- 5.62
- Type
- journal article
- Language
- en
- Open access
- hybrid
- doi.org
- Licence
- cc-by-nc-sa
- www.springer.com/tdm (unspecified)
- Locations
- British Journal of Cancer (publishedVersion, cc-by-nc-sa)
- PubMed Central (publishedVersion, cc-by)
- PubMed (publishedVersion)
- Funders
- Kansai Medical University
- National Institutes of Health
- Directorate for Biological Sciences
- National Cancer Institute (P01 CA84203, P01CA084203)
- Topics
- Life Sciences › Biochemistry, Genetics and Molecular Biology › Cancer Research › Photodynamic Therapy Research Studies
- Life Sciences › Biochemistry, Genetics and Molecular Biology › Molecular Biology › Porphyrin Metabolism and Disorders
- Physical Sciences › Engineering › Biomedical Engineering › Nanoplatforms for cancer theranostics
- Keywords
- methotrexate, 5-aminolevulinic acid, photodynamic therapy, prostate cancer, protoporphyrin IX, coproporphyrinogen oxidase, LNCaP cells, combination therapy, porphyrin synthesis, apoptosis, cell differentiation
- MeSH terms
- Aminolevulinic Acid, Cell Differentiation, Cell Survival, Coproporphyrinogen Oxidase, Humans, Male, Methotrexate, Models, Biological, Photochemotherapy, Prostatic Neoplasms, Protoporphyrins, Metribolone, Up-Regulation, Apoptosis, Photosensitizing Agents, Cell Line, Tumor, Cell Proliferation
About these checks
Registry, retraction, Cites and statistics results are computed, not judged, with one exception: a printed reference that no index lists is read once by a model before it counts as a citation error. Claims are extracted by a model and kept only when their quote appears verbatim in the text; each cited source is then checked, with a model’s help, for whether it says what the claim relies on. Those verdicts can be wrong — read the claim’s quote and the cited source before relying on one.
Statistics and arithmetic are recomputed, not judged.
Confidence bands are shown only for fields calibrated on our annotated test set. None is calibrated yet, so no band is shown.
What counts as a claim ›How we measure confidence ›How we check this ›
Are you an author, or do you see a problem with this page? Request a review
