

The DOI matches its Crossref record; 30 of the 30 references it cites were found in a registry or an index.
Unique in the Crowd: The privacy bounds of human mobility
Open accessAbstract
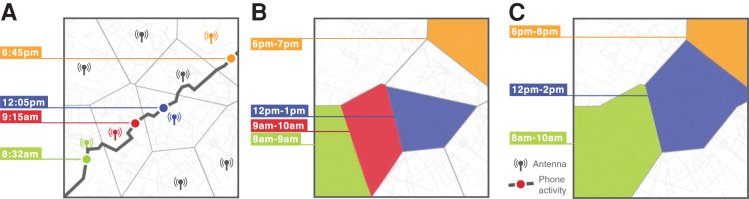
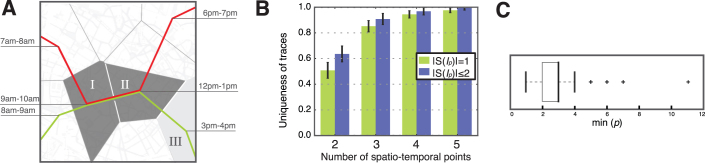
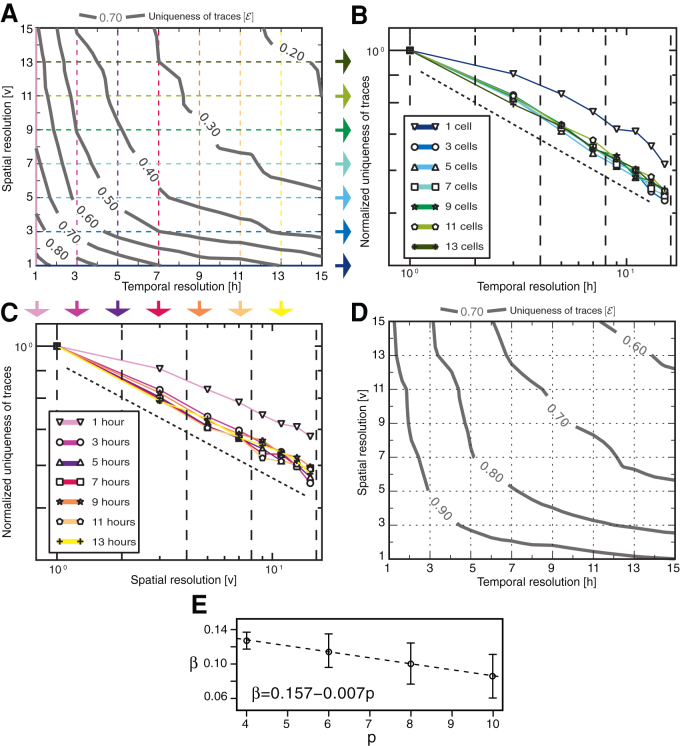
We study fifteen months of human mobility data for one and a half million individuals and find that human mobility traces are highly unique. In fact, in a dataset where the location of an individual is specified hourly, and with a spatial resolution equal to that given by the carrier's antennas, four spatio-temporal points are enough to uniquely identify 95% of the individuals. We coarsen the data spatially and temporally to find a formula for the uniqueness of human mobility traces given their resolution and the available outside information. This formula shows that the uniqueness of mobility traces decays approximately as the 1/10 power of their resolution. Hence, even coarse datasets provide little anonymity. These findings represent fundamental constraints to an individual's privacy and have important implications for the design of frameworks and institutions dedicated to protect the privacy of individuals.
Overview
The claims and statistics of this paper haven’t been checked yet.
Run the check — free, no account needed. It reads the open-access text and checks the sources it cites.
Integrity signals
Registry
Cites
Statistics
Figures
Verification
Claims the paper makes
The claims and statistics of this paper haven’t been checked yet.
Run the check — free, no account needed. It reads the open-access text and checks the sources it cites.
Claims other papers make about this one
Each is checked against this paper’s own text: does it say what the citing paper says it does?
In the citing paper
“Indeed, it is clear that it is possible to reverse engineer anonymization strategies by combing and combining datasets [56,57] unless the data are fully de-identified.”
From The ethics of smart cities and urban science (2016) · cites this paper as [57]
Self-check
Percentages, sums and reported differences re-computed from the paper’s own numbers.
The self-check needs the paper’s full text.
Citations
Cites
k-ANONYMITY: A MODEL FOR PROTECTING PRIVACY
SWEENEY, L. (2002) · International Journal of Uncertainty, Fuzziness and Knowledge-Based Systems · doi:10.1142/s0218488502001648 · Cited by 8,571 · cited 1×
“For instance, in one study, a medical database was successfully combined with a voters list to extract the health record of the governor of Massachusetts 27 .”
BackgroundNewman, M. (2010) · doi:10.1093/acprof:oso/9780199206650.001.0001 · Cited by 6,595
Understanding individual human mobility patterns
González, M. C., Hidalgo, C. A., & Barabási, A.-Ĺ. (2008) · Nature · doi:10.1038/nature06958 · Cited by 6,186
Self-citation(2011) · Cited by 5,203
Warren, S. D., & Brandeis, L. D. (1890) · University of Washington Press eBooks · doi:10.1515/9780295803661-014 · Cited by 4,092
Nonlinear Regression Analysis and Its Applications
Bates, D. M., & Watts, D. G. (1988) · Wiley series in probability and statistics · doi:10.1002/9780470316757 · Cited by 4,017
Limits of Predictability in Human Mobility
Song, C., Qu, Z., Blumm, N., & Barabási, A.-L. (2010) · Science · doi:10.1126/science.1177170 · Cited by 3,234 · cited 2×
“B] have been used in the past for research purposes 4–18 and to provide personalized services to users 19 .”
BackgroundInfluentialWarren, S. D., & Brandeis, L. D. (1890) · Harvard Law Review · doi:10.2307/1321160 · Cited by 2,760
Robust De-anonymization of Large Sparse Datasets
Narayanan, A., & Shmatikov, V. (2008) · 2008 IEEE Symposium on Security and Privacy (sp 2008) · doi:10.1109/sp.2008.33 · Cited by 2,372
The origin of bursts and heavy tails in human dynamics
Barabási, A.-L. (2005) · Nature · doi:10.1038/nature03459 · Cited by 2,210
Research works printed but not linked: 2
- Clanchy, M. T. From Memory to Written Records England 1066–1307 (Harvard University Press, Cambridge, 1979).
- Newman, M. E. J. Networks: An Introduction (Oxford University Press, New York, 2010).
Cited by
Sorted by citations
Decentralizing Privacy: Using Blockchain to Protect Personal Data
Zyskind, G., Nathan, O., & Pentland, A. '. (2015) · 2015 IEEE Security and Privacy Workshops · doi:10.1109/spw.2015.27 · Cited by 2,617
The Rise of Consumer Health Wearables: Promises and Barriers
Piwek, L., Ellis, D. A., Andrews, S., & Joinson, A. (2016) · PLoS Medicine · doi:10.1371/journal.pmed.1001953 · Cited by 1,301
Systematic review of the validity and reliability of consumer-wearable activity trackers
Evenson, K. R., Goto, M. M., & Furberg, R. D. (2015) · International Journal of Behavioral Nutrition and Physical Activity · doi:10.1186/s12966-015-0314-1 · Cited by 1,232
Human mobility: Models and applications
Barbosa, H., Barthélemy, M., Ghoshal, G., James, C. R., Lenormand, M., Louail, T., de Menezes, R. P., Ramasco, J. J., Simini, F., & Tomasini, M. (2018) · Physics Reports · doi:10.1016/j.physrep.2018.01.001 · Cited by 1,104
Dynamic population mapping using mobile phone data
Deville, P., Linard, C., Martin, S., Gilbert, M., Stevens, F. R., Gaughan, A. E., Blondel, V. D., & Tatem, A. J. (2014) · Proceedings of the National Academy of Sciences · doi:10.1073/pnas.1408439111 · Cited by 893
Self-citation
Metadata
- Authors
- de Montjoye, Y.-A., Hidalgo, C. A., Verleysen, M., & Blondel, V. D.
- Affiliations
- Harvard University (US)
- UCLouvain (BE)
- Massachusetts Institute of Technology (US)
- Venue
- Scientific Reports
- Published
- 2013-03-25
- Volume
- 3
- Issue
- 1
- Pages
- 1376-1376
- ISSN
- 2045-2322 (ISSN-L)
- PMC
- PMC3607247
- OpenAlex
- W2115240023
- Semantic Scholar
- 7fe16a270f403048f78fa89a64410e570ae5c16f
- Cited by
- 1,645
- References
- 29
- Citations by year
- 2026: 96 · 2025: 86 · 2024: 92 · 2023: 96 · 2022: 133 · 2021: 156 · 2020: 191 · 2019: 153 · 2018: 152 · 2017: 124 · 2016: 124 · 2015: 119 · 2014: 89 · 2013: 33
- FWCI
- 134.68
- Type
- journal article
- Language
- en
- Open access
- gold
- doi.org
- Licence
- Locations
- Scientific Reports (publishedVersion, cc-by-nc-nd)
- Europe PMC (PubMed Central) (publishedVersion, cc-by-nc-nd)
- PubMed Central (publishedVersion, cc-by-nc-nd)
- PubMed (publishedVersion)
- DSpace@MIT (Massachusetts Institute of Technology) (submittedVersion, cc-by-nc-nd)
- Digital Access to Libraries (Université catholique de Louvain (UCL), l'Université de Namur (UNamur) and the Université Saint-Louis (USL-B)) (submittedVersion, other-oa)
- Topics
- Physical Sciences › Computer Science › Artificial Intelligence › Privacy-Preserving Technologies in Data
- Social Sciences › Transportation › Human Mobility and Location-Based Analysis
- Social Sciences › Sociology and Political Science › Privacy, Security, and Data Protection
- Keywords
- human mobility, privacy, anonymity, spatiotemporal resolution, location data, privacy preservation
- MeSH terms
- Geography, Humans, Privacy, Databases as Topic, Cell Phone
About these checks
Registry, retraction, Cites and statistics results are computed, not judged, with one exception: a printed reference that no index lists is read once by a model before it counts as a citation error. Claims are extracted by a model and kept only when their quote appears verbatim in the text; each cited source is then checked, with a model’s help, for whether it says what the claim relies on. Those verdicts can be wrong — read the claim’s quote and the cited source before relying on one.
Statistics and arithmetic are recomputed, not judged.
Confidence bands are shown only for fields calibrated on our annotated test set. None is calibrated yet, so no band is shown.
What counts as a claim ›How we measure confidence ›How we check this ›
Are you an author, or do you see a problem with this page? Request a review
