

The DOI matches its Crossref record; 41 of the 41 references it cites were found in a registry or an index.
Using Mobile Phone Data to Predict the Spatial Spread of Cholera
Open accessAbstract
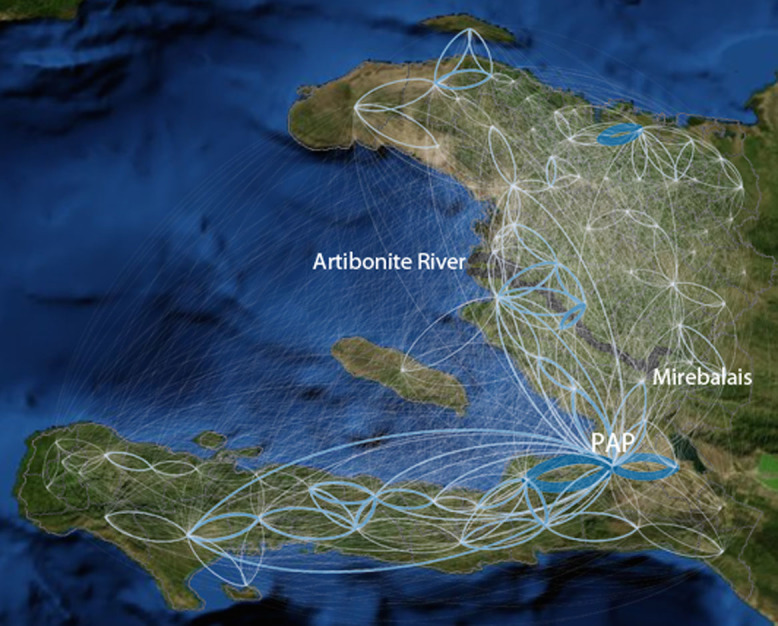
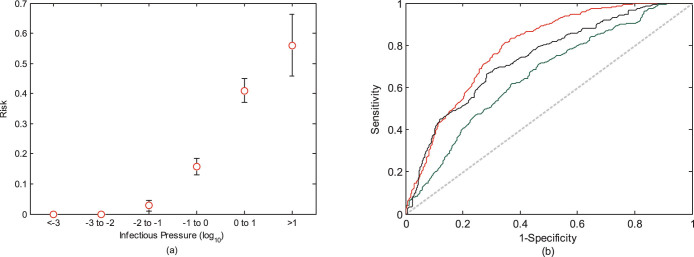
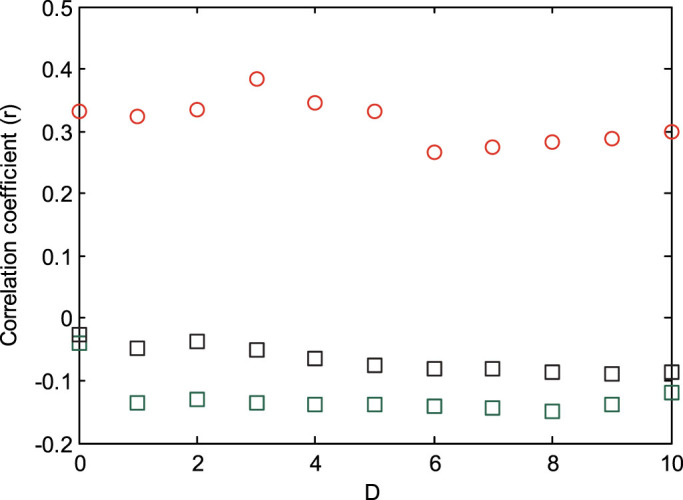
Effective response to infectious disease epidemics requires focused control measures in areas predicted to be at high risk of new outbreaks. We aimed to test whether mobile operator data could predict the early spatial evolution of the 2010 Haiti cholera epidemic. Daily case data were analysed for 78 study areas from October 16 to December 16, 2010. Movements of 2.9 million anonymous mobile phone SIM cards were used to create a national mobility network. Two gravity models of population mobility were implemented for comparison. Both were optimized based on the complete retrospective epidemic data, available only after the end of the epidemic spread. Risk of an area experiencing an outbreak within seven days showed strong dose-response relationship with the mobile phone-based infectious pressure estimates. The mobile phone-based model performed better (AUC 0.79) than the retrospectively optimized gravity models (AUC 0.66 and 0.74, respectively). Infectious pressure at outbreak onset was significantly correlated with reported cholera cases during the first ten days of the epidemic (p < 0.05). Mobile operator data is a highly promising data source for improving preparedness and response efforts during cholera outbreaks. Findings may be particularly important for containment efforts of emerging infectious diseases, including high-mortality influenza strains.
Overview
The claims and statistics of this paper haven’t been checked yet.
Run the check — free, no account needed. It reads the open-access text and checks the sources it cites.
Integrity signals
Registry
Cites
Statistics
Figures
Verification
Claims the paper makes
The claims and statistics of this paper haven’t been checked yet.
Run the check — free, no account needed. It reads the open-access text and checks the sources it cites.
Claims other papers make about this one
Each is checked against this paper’s own text: does it say what the citing paper says it does?
In the citing paper
“In the realm of infectious diseases, ML and AI have been applied to predict disease outbreaks and identify high-risk areas [19, 20].”
From Integrating machine learning and artificial intelligence in life-course epidemiology: pathways to innovative public health solutions (2024) · cites this paper as [20]
In the citing paper
“Bengtsson et al. (2015) utilized mobile phone data and machine learning techniques to predict the spatial spread of cholera in Haiti following the 2010 earthquake [20].”
From Integrating machine learning and artificial intelligence in life-course epidemiology: pathways to innovative public health solutions (2024) · cites this paper as [20]
Self-check
Percentages, sums and reported differences re-computed from the paper’s own numbers.
The self-check needs the paper’s full text.
Citations
Cites
Murray, C. J. L., Vos, T., Lozano, R., Naghavi, M., Flaxman, A. D., Michaud, C., Ezzati, M., Shibuya, K., Salomon, J. A., Abdalla, S., et al. (2012) · The Lancet · doi:10.1016/s0140-6736(12)61689-4 · Cited by 8,888
Infectious Diseases of Humans: Dynamics and Control
(1992) · Annals of Internal Medicine · doi:10.7326/0003-4819-117-2-174_4 · Cited by 7,819
The use of the area under the ROC curve in the evaluation of machine learning algorithms
Bradley, A. P. (1997) · Pattern Recognition · doi:10.1016/s0031-3203(96)00142-2 · Cited by 7,217
Understanding individual human mobility patterns
González, M. C., Hidalgo, C. A., & Barabási, A.-Ĺ. (2008) · Nature · doi:10.1038/nature06958 · Cited by 6,186
Infectious Diseases of Humans: Dynamics and Control
Anderson, R. M., & May, R. M. (1991) · doi:10.1093/oso/9780198545996.001.0001 · Cited by 6,179
Global, regional, and national causes of child mortality in 2008: a systematic analysis
Black, R. E., Cousens, S. N., Johnson, H. L., Lawn, J. E., Rudan, I., Bassani, D. G., Jha, P., Campbell, H. J., Walker, C. L. F., Cibulskis, R. E., et al. (2010) · The Lancet · doi:10.1016/s0140-6736(10)60549-1 · Cited by 3,062
Strategies for containing an emerging influenza pandemic in Southeast Asia
Ferguson, N. M., Cummings, D. A. T., Cauchemez, S., Fraser, C., Riley, S., Meeyai, A. C., Iamsirithaworn, S., & Burke, D. S. (2005) · Nature · doi:10.1038/nature04017 · Cited by 1,820
Pochet, P. (2006) · Griffith Research Online · Cited by 1,550
Multiscale mobility networks and the spatial spreading of infectious diseases
Balcan, D., Vittoria Colizza, A., Gonçalves, B., Hu, H., Ramasco, J. J., & Vespignani, A. (2009) · Proceedings of the National Academy of Sciences · doi:10.1073/pnas.0906910106 · Cited by 1,347
Containing Pandemic Influenza at the Source
Longini, I. M., Nizam, A., Xu, S., Ungchusak, K., Hanshaoworakul, W., Cummings, D. A. T., & Halloran, M. E. (2005) · Science · doi:10.1126/science.1115717 · Cited by 1,177
Research works printed but not linked: 2
Cited by
Sorted by citations
Items 201–280 of 280
Buckee, C. O., & Engø‐Monsen, K. (2016) · arXiv (Cornell University) · doi:10.13140/rg.2.1.5027.5440 · Cited by 4
The Ethics of Big Data as a Public Good: Which Public? Whose Good?Preprint
Taylor, L. (2016) · SSRN Electronic Journal · doi:10.2139/ssrn.2820580 · Cited by 5
Kangbai, J. B. (2016) · Journal of Tropical Diseases · doi:10.4172/2329-891x.1000214 · Cited by 3
“In Haiti, public health experts successfully predicted the spatial evolution of the 2010 cholera outbreak using cell phone calls and SMS messages obtained from more than 2 million mobile phone SIM cards [7].”
BackgroundComparing and integrating human mobility data sources for measles transmission modeling in Zambia
Kostandova, N., Prosperi, C., Mutembo, S., Nakazwe, C., Namukoko, H., Nachinga, B., Lai, S., Tatem, A. J., Duan, Q., Kabalo, E. N., et al. (2025) · PLOS Global Public Health · doi:10.1371/journal.pgph.0003906 · Cited by 3
“…including, but not limited to, surveys, mobile phone data (e.g., call detail records), Global Positioning System (GPS) loggers and other Global Navigation Satellite Systems, transportation flows (e.g., airline, railroad, sea, and subway), national censuses, and online social network data [2,19–22].”
How has Aggregated Mobility Data-informed public health research?
Turnnidge, J., Kuforiji, O. A., Sayyad, S., Greco, S., Kirupaharan, S., Roy, A., Dalgarno, N., Zhou, A., Mamun, M. S. A., Mamiya, H., et al. (2025) · Health Policy and Technology · doi:10.1016/j.hlpt.2025.101055 · Cited by 3
A Survey on Digital Epidemiology: Networks and Models
Pastor-Escuredo, D., & Olmos, L. E. (2022) · Medical Research Archives · doi:10.18103/mra.v10i10.3175 · Cited by 5
“However, mobile phone data has enabled the revolution of mobility for epidemics (Bengtsson et al., 2015; Bengtsson, Lu, Thorson, Garfield, & Von Schreeb, 2011; Tatem et al., 2014; Tizzoni et al., 2014; Wesolowski et al., 2012; Wesolowski et al., 2015).”
BackgroundExcess mortality in northern Haiti during the 2010 cholera epidemic
Medozile, M., Lovasi, G. S., Kolokotronis, S., & Hoepner, L. (2023) · PLoS neglected tropical diseases · doi:10.1371/journal.pntd.0011750 · Cited by 3
“A study conducted in Haiti [26] showed how mobile phone data were used to analyze mobility patterns, and to identify and even anticipate local outbreaks of cholera at the beginning of the epidemic in Haiti.”
BackgroundIdentifying Highly Influential Travellers for Spreading Disease on a Public Transport System
Shoghri, A. E., Liebig, J., Jurdak, R., Gardner, L., & Kanhere, S. S. (2020) · IEEE International Symposium on a World of Wireless, Mobile and Multimedia Networks (WoWMoM) · doi:10.1109/wowmom49955.2020.00020 · Cited by 4
“An important body of research has explored the use of call detail records (CDRs) and data from the global positioning system (GPS) to build epidemiological models and to study the spatial transmission of various diseases in a population at both city and country levels [13][14][15][16][17][18][19][20].”
BackgroundThe Privacy Implications of Using Data Technologies in a Pandemic
Matthan, R. (2020) · Journal of the Indian Institute of Science · doi:10.1007/s41745-020-00198-x · Cited by 3
“The use of data in this manner to map epidemiological spread was pioneered during the cholera outbreak in Haiti 2 and has since been used in the ebola outbreak in Sierra Leone 3 and the dengue outbreak in Pakistan 4 .”
MethodBig Data to Support Sustainable Development Goals (SDGs)
Paoli, A. D., & Addeo, F. (2020) · Smart innovation, systems and technologies · doi:10.1007/978-3-030-48279-4_69 · Cited by 3
Smart City: A Perspective of Emergency and Resilience at a Community Level in Shanghai
Shi, X., Sun, W.-C., Voß, S., & Jin, J. G. (2020) · Lecture notes in computer science · doi:10.1007/978-3-030-59747-4_34 · Cited by 3
Flow descriptors of human mobility networksPreprint
Pastor-Escuredo, D., & Frı́as-Martı́nez, E. (2020) · arXiv (Cornell University) · doi:10.48550/arxiv.2003.07279 · Cited by 3
“…prevent from the spread diseases outbreaks (Bengtsson et al., 2011) (Wesolowski et al., 2012) (Wesolowski et al., 2015) (Heesterbeek et al., 2015) (Bengtsson et al., 2015) and support humanitarian action during and after natural disasters (Bagrow et al., 2011) (Lu et al., 2012) (Pastor-Escuredo…”
BackgroundOhmukai, I., Yamamoto, Y., Ito, M., & Okumura, T. (2020) · arXiv (Cornell University) · doi:10.48550/arxiv.2003.06199 · Cited by 3
“and for managing the quarantine of cholera [13, 14, 15], which was then applied to modeling the spread of infectious diseases [16].”
BackgroundYabe, T., Zhang, Y., & Ukkusuri, S. V. (2020) · RePEc: Research Papers in Economics · doi:10.48550/arxiv.2004.11121 · Cited by 3
Towards socially equitable public transport systems: The effect of COVID-19 on taxi trip behavior
Gökaşar, I., Ozcan, E., & Deveci, M. (2024) · Case Studies on Transport Policy · doi:10.1016/j.cstp.2024.101305 · Cited by 3
Privacy preserving optimization of communication networks
Lei, D., Lin, X., Yu, X., Zhao, Z., Liu, F., Shi, Y., Zhuang, S., Gao, H., Barzel, B., & Boccaletti, S. (2025) · Nature Communications · doi:10.1038/s41467-025-63504-0 · Cited by 2
“Often, these restrictions are bypassed through aggregation and anonymization — for example, by tracking the sheer volume of users at each BS without collecting individual identi fi ers 33,34 .”
Fisman, D. N., & Tuite, A. R. (2019) · Proceedings of the National Academy of Sciences · doi:10.1073/pnas.1916910116 · Cited by 2
Cities' influence on spatial epidemics
Boris Podobnik, A., Lipić, T., Bojić, I., & Antulov-Fantulin, N. (2016) · Physics of Life Reviews · doi:10.1016/j.plrev.2016.10.009 · Cited by 2
Detecting Mobile Malware Associated With Global Pandemics
Pérez, A. J., Zeadally, S., & Tan, D. (2023) · IEEE Pervasive Computing · doi:10.1109/mprv.2023.3321218 · Cited by 2
“6 Using only anonymized mobile phone data from cellular operators, Bengtsson et al. 16 created a model to survey and track the spread of cholerae in the 2010 Haiti epidemic.”
BackgroundSharma, R. K., Srivastava, A., Vinay, M., & Sethi, R. (2020) · Journal of Statistics and Management Systems · doi:10.1080/09720510.2020.1838062 · Cited by 2
“Another study from Haiti suggested that mobile phone based data has been found very promising to track and monitor the outbreak of Cholera in 2010 [26].”
BackgroundMcGough, S. F., Clemente, C. L., Kutz, J. N., & Santillana, M. (2019) · bioRxiv (Cold Spring Harbor Laboratory) · doi:10.1101/666628 · Cited by 2
Mobile smartphone tracing can detect almost all SARS-CoV-2 infectionsPreprint
Prasse, B., & Mieghem, P. V. (2020) · arXiv (Cornell University) · doi:10.48550/arxiv.2006.14285 · Cited by 2
“Previous studies [11, 12, 13, 2] consider aggregated location information, in the form of mobility flow or population density.”
BackgroundThe Contact Network of Mexico City.Preprint
de Anda‐Jáuregui, G., Guzmán, P., & Hernández-Rosales, M. (2020) · arXiv (Cornell University) · Cited by 2
Laloum, M., & Ruiz-Arranz, M. (2021) · doi:10.18235/0003233 · Cited by 2
Building a Policy-Relevant Research Agenda on Environmental Migration in Africa
Mueller, V. (2022) · International handbooks of population · doi:10.1007/978-3-030-76433-3_8 · Cited by 2
CLIAS, Sabán, M., Esteban, S., CLIAS, Rubinstein, A., CLIAS, Cejas, C., CLIAS, Pérez-Acuña, K., & CLIAS (2023) · The Global Health Network eBooks · doi:10.48060/tghn.125 · Cited by 1
Yuan, Y., Wang, Y., Jiang, X., & Lai, C. S. (2024) · Clean Technologies · doi:10.3390/cleantechnol6010006 · Cited by 1
A Bayesian model for repeated cross-sectional epidemic prevalence survey data
Steyn, N., Chadeau‐Hyam, M., Elliott, P., & Donnelly, C. A. (2025) · PLoS Computational Biology · doi:10.1371/journal.pcbi.1013515 · Cited by 1
“Recently, novel surveillance methods, such as wastewater testing [2], mobile phone data [3,4], and social media monitoring [5], have been developed to complement traditional surveillance methods.”
Pullano, G., Bansal, S., Rubrichi, S., & Colizza, V. (2026) · PLoS Computational Biology · doi:10.1371/journal.pcbi.1014427 · Cited by 3
“…have demonstrated their usefulness for quantifying mobility networks and connectivity patterns [24–27], and they have been applied to a variety of infectious diseases including malaria [25,28], cholera [29,30], schistosomiasis [31], dengue [32], HIV [33,34], 2013–2016 Ebola outbreak [35,36].”
Ramezani, A., Bagheri, M., Mahmoudian, F., Fattahi, F., ghahroodi, F. N., Nasirmoghadas, P., Pourzardosht, N., Khalesi, B., Hashemi, Z. S., & Khalili, S. (2026) · Expert Review of Molecular Diagnostics · doi:10.1080/14737159.2026.2706000 · Cited by 1
“As an example, Bengtsson et al. used ML methods together with mobile phone data to predict the dynamic spread of disease in Haiti cholera outbreak in 2010 [145].”
Using mobile phone data to study dynamics of rural-urban mobility
Sanya, R., & Mubangizi, M. (2016) · International Conference on Data Science and Engineering · doi:10.1109/icdse.2016.7823963 · Cited by 1
“Mobile phone call detail records (CDR) are the latest data source for studying human mobility patterns, for example [3], [4], [5], [6], [7], [8], [9]].”
BackgroundHafnidar, H., Junita, N., & Aidilof, H. A. K. (2021) · AMCA Journal of Education and Behavioral Change · doi:10.51773/ajeb.v1i2.93 · Cited by 1
Epidemics on evolving networks with varying degrees
Sanhedrai, H., & Havlin, S. (2022) · New Journal of Physics · doi:10.1088/1367-2630/ac64b8 · Cited by 1
Syndromic Surveillance 2.0: Emerging Global Surveillance Strategies for Infectious Disease Epidemics
Ramchand, R., Ahluwalia, S. C., Avriette, M., Cecchine, G., Cooper, M., Foran, C., Hicks, D., Lander, N., & Lee, S. D. (2023) · Rand health quarterly · doi:10.7249/rhq-11-01-08 · Cited by 1
Modelling Approaches to Borders, Geography, and Infectious Diseases
Fisman, D. N. (2024) · Routledge eBooks · doi:10.4324/9781003394006-40 · Cited by 1
Mobile phones and their use to study dynamics of the COVID-19 pandemic
Berke, A., & Larson, K. (2024) · Elsevier eBooks · doi:10.1016/b978-0-323-95646-8.00049-4 · Cited by 1
Predicting Higher-order Dynamics without Network Topology by Ridge Regression
Zhou, Z., Li, C., Qu, B., & Li, X. (2024) · IEEE International Symposium on Circuits and Systems proceedings · doi:10.1109/iscas58744.2024.10558445 · Cited by 1
“The prediction of future dynamics on networks, such as predicting the spread of infectious disease on human contact networks [8]–[10] with collected observation data, is of particular interest.”
BackgroundNanyonga, S., Medina, P. B., Kozlakidis, Z., Garcia, D. L., Ivanova, D., & Katsaounis, P. (2024) · Sustainable development goals series · doi:10.1007/978-3-031-62332-5_25 · Cited by 1
Auditing the fairness of the US COVID-19 forecast hub’s case prediction models
Abrar, S. M., Awasthi, N., Smolyak, D., Sigalo, N., & Martinez, V. F. (2025) · PLoS ONE · doi:10.1371/journal.pone.0319383 · Cited by 1
Landau, S. M. (2020) · New Security Paradigms Workshop · doi:10.1145/3442167.3442171 · Cited by 3
“showed that such phone records could be used in the future for improving response efforts [18].”
MethodIntegrating Social Sciences to Mitigate Against Covid
Paul, R. E. L., Telle, O., & Benkimoun, S. (2021) · Economics, law, and institutions in Asia Pacific · doi:10.1007/978-981-16-5727-6_3 · Cited by 1
“Aggregated,anonymized, passivelycollectedmobilephonedatahavepreviouslyusedininfectiousdisease modellingofmanyinfectiousdiseases,includingcholera(Bengtssonetal.2015; Finger et al. 2016), dengue (Wesolowski et al. 2015), Ebola (Peak et al. 2018), malaria (Wesolowski et al. 2012) and measles…”
BackgroundUsing mobile network data to color epidemic risk maps
Cabana, E., Lutu, A., Frı́as-Martı́nez, E., & Laoutaris, N. (2022) · doi:10.1145/3557995.3566120 · Cited by 1
“In the latter case, mobile network data has helped to study the risk of infectious diseases contagion [8, 43], the spatial spread of cholera [3], to predict the risk of viruses such as the Zika, malaria or the dengue fever [32, 41, 48, 51], and COVID-19 [17, 19, 26].”
SIMULATION OF EPIDEMIC PROCESSES: A REVIEW OF MODERN METHODS, MODELS AND APPROACHES
Chumachenko, T., & Chumachenko, D. (2022) · Inter Collegas · doi:10.35339/ic.9.1.66-75 · Cited by 1
Wang, M., Wang, C., & Peng, X. (2022) · Frontiers in Sociology · doi:10.3389/fsoc.2022.1053970 · Cited by 1
“Studies have found that SMS reduced negative emotions in the public (Bengtsson et al., 2015; Mao et al., 2016; Panigutti et al., 2017).”
BackgroundEarly Warning of COVID-19 Hotspots using Mobility of High Risk Users from Web Search QueriesPreprint
Yabe, T., Tsubouchi, K., & Ukkusuri, S. V. (2020) · arXiv (Cornell University) · doi:10.48550/arxiv.2010.13254 · Cited by 1
Small World Model for scaling up prediction result based on SEIR modelPreprint
Lin, G., Feng, D., Li, P., Zhao, Y., Zhang, H., & Song, X. (2021) · arXiv (Cornell University) · doi:10.48550/arxiv.2104.06658 · Cited by 1
“using individual level data such as mobile phone data [9]– [11] to analyze the impact of epidemic.”
MethodKey opportunities and challenges for the use of big data in migration research and policyPreprint
Franklinos, L. H. V., Parrish, R., Burns, R., Caflisch, A. C., Mallick, B., Rahman, T., Routsis, V., López, A. S., Tatem, A. J., & Trigwell, R. (2021) · doi:10.14324/111.444/000042.v2 · Cited by 1
Joseph, G., Milusheva, S., Sturrock, H. J. W., Kashangura, F. M., Ayling, S. C. E., & Hoo, Y. R. (2023) · World Bank, Washington, DC eBooks · doi:10.1596/1813-9450-10327 · Cited by 1
DemOpts: Fairness Corrections in COVID-19 Case Prediction Models (Preprint)Preprint
Awasthi, N., Abrar, S. M., Smolyak, D., & Frías-Martínez, V. (2025) · doi:10.2196/preprints.78235 · Cited by 1
SOCIAL NETWORK ANALYSIS OF CELLPHONE SURVEILLANCE DATA FOR EBOLA IN SIERRA LEONE
Kangbai, J. B. (2016) · UKnowledge (University of Kentucky)
Improving Disease Outbreak Forecasting Models for Efficient Targeting of Public Health ResourcesPreprint
Fernando, L., Lokanathan, S., Perera, A. S., Ghouse, A., & Tissera, H. A. (2017) · SSRN Electronic Journal · doi:10.2139/ssrn.3072086
Robin, N., Klein, T., & Jütting, J. (2018) · doi:10.1787/f21ff556-ko
Predicting COVID-19 Spread from Large-Scale Mobility DataPreprint
Schwabe, A., Persson, J., & Feuerriegel, S. (2021) · arXiv (Cornell University) · doi:10.48550/arxiv.2106.00356
“In previous work, epidemic forecasting using mobility has been evaluated for dengue fever [23], Ebola [21], and cholera [2].”
BackgroundSustaining Planetary Health in the Anthropocene
Haines, A., & Frumkin, H. (2021) · Cambridge University Press eBooks · doi:10.1017/9781108698054.012
Rinaldo, A., Gatto, M., & Rodriguez-Iturbe, I. (2020) · Cambridge University Press eBooks · doi:10.1017/9781108775014.004
Rinaldo, A., Gatto, M., & Rodriguez-Iturbe, I. (2020) · Cambridge University Press eBooks · doi:10.1017/9781108775014.002
Rinaldo, A., Gatto, M., & Rodriguez-Iturbe, I. (2020) · Cambridge University Press eBooks · doi:10.1017/9781108775014.003
Rinaldo, A., Gatto, M., & Rodriguez-Iturbe, I. (2020) · Cambridge University Press eBooks · doi:10.1017/9781108775014.005
Rinaldo, A., Gatto, M., & Rodriguez-Iturbe, I. (2020) · Cambridge University Press eBooks · doi:10.1017/9781108775014.006
Rinaldo, A., Gatto, M., & Rodriguez-Iturbe, I. (2020) · Cambridge University Press eBooks · doi:10.1017/9781108775014.007
Pastor-Escuredo, D. (2020) · Revista Diecisiete Investigación Interdisciplinar para los Objetivos de Desarrollo Sostenible · doi:10.36852/2695-4427_2020_03.07
Rinaldo, A., Gatto, M., & Rodriguez-Iturbe, I. (2020) · Cambridge University Press eBooks · doi:10.1017/9781108775014.001
Rinaldo, A., Gatto, M., & Rodriguez-Iturbe, I. (2020) · Cambridge University Press eBooks · doi:10.1017/9781108775014.008
Improving epidemic risk maps using mobility information from mobile network data
Cabana, E., Lutu, A., Frı́as-Martı́nez, E., & Nikolaos Laoutaris, B. (2022) · ACM SIGSPATIAL International Conference on Advances in Geographic Information Systems (SIGSPATIAL GIS) · doi:10.1145/3557915.3561012
“To capture this, mobile network data can be effectively exploited to improve our understanding of human mobility dynamics and its impact on infectious diseases contagion [5], the spatial spread of cholera [2].”
BackgroundSieg, L., & Cheshire, J. A. (2024) · Geographical Analysis · doi:10.1111/gean.12406
Infectious Disease Surveillance
Rajahram, G. S., & Heymann, D. (2024) · Elsevier eBooks · doi:10.1016/b978-0-323-99967-0.00324-0
Pullano, G., Bansal, S., Rubrichi, S., & Vittoria Colizza, A. (2024) · medRxiv · doi:10.1101/2024.10.11.24315335
“Mobile phone traces indeed have been helpful to understand the spatial transmission of many outbreaks including malaria 13,15 , cholera 12,16 , schizosomiasis 17 , Ebola 21,22 , dengue 18 , HIV 19,20 .”
BackgroundHotspot analysis of COVID-19 infection in Tokyo based on influx patterns
Kimura, Y., Seki, T., Chujo, K., Murata, T., Sakurai, T., Miyata, S., Inoue, H., & Ito, N. (2025) · Scientific Reports · doi:10.1038/s41598-024-82962-y
The Ethics of Big Data as a Public Good
Taylor, L. (2025) · doi:10.1093/oso/9780198879145.003.0015 · Cited by 1
Reinventing the Social Contract in an Age of Big Data
Lepri, B., Oliver, N., & Pentland, A. (2025) · doi:10.1093/oso/9780198879145.003.0007
Corgel, R., Grantz, K. H., Gardner, L., Cummings, D. A. T., de Silva, H., Somaratne, T., Silva, D., Fernando, L., & Wesolowski, A. (2026) · Proceedings of the National Academy of Sciences · doi:10.1073/pnas.2533465123
“Beyond COVID - 19, a substantial body of evidence shows that spatial disease dynamics for other communicable pathogens such as influenza (3, 4), malaria (5), dengue (6), yellow fever (7), cholera (8), Ebola (9), and measles (10) are driven by the movement of people from one location to another.”
Awasthi, N., Abrar, S. M., Smolyak, D., & Frías-Martínez, V. (2025) · Online Journal of Public Health Informatics · doi:10.2196/78235 · Cited by 2
The COVID-19 pandemic and telecommunications interaction: a general and corporate approach
Calvo, Á. C. M. (2026) · Journal of Evolutionary Studies in Business-JESB · doi:10.1344/jesb.47321
Sallah, K. L. (2017) · theses.fr (ABES) · doi:10.70675/99f05318zde2fz4d39z9fd9zed27b0e67337
Self-citationOuédraogo, B. (2018) · theses.fr (ABES) · doi:10.70675/e7101e2dzee09z4275zb408z1f54041999d6
Cebeillac, A. (2018) · theses.fr (ABES) · doi:10.70675/5d547c6fzffe0z4316zb36cz89231dffc829
Aubourg, T. (2020) · theses.fr (ABES) · doi:10.70675/839b38a4z7123z4a81zb34bz89e057455a67
Lyle, K., Samuel, G. N., & Lucassen, A. (2026) · Sociology of Health & Illness · doi:10.1111/1467-9566.70205
“These approaches are applied to aims ranging from predicting and preventing disease (Bengtsson et al. 2015), enabling more accurate diagnoses (Gurovich et al. 2019), modelling population health (Naghavi et al. 2010), optimising treatments and transforming drug discovery (Topol 2019) and supporting…”
DiffMove: Group Mobility Tendency Enhanced Trajectory Recovery via Diffusion Model
Long, Q., Rong, C., Wang, H., Shaw, R., & Li, Y. (2026) · IEEE Transactions on Mobile Computing · doi:10.1109/tmc.2026.3712253
“H UMAN mobility data reveals people’s activity patterns and mobility intentions, making it of significant value in various fields such as epidemic control [1], [2], [3], urban planning [4], [5], [6], [7], and transportation engineering [8], [9].”
Metadata
- Authors
- Bengtsson, L., Gaudart, J., Lu, X., Moore, S., Wetter, E., Sallah, K., Rebaudet, S., & Piarroux, R.
- Affiliations
- Karolinska Institutet (SE)
- Inserm (FR)
- National University of Defense Technology (CN)
- Aix-Marseille Université (FR)
- Stockholm School of Economics (SE)
- Corresponding author
- Bengtsson, Linus
- ORCID
- Venue
- Scientific Reports
- Published
- 2015-03-09
- Volume
- 5
- Issue
- 1
- Pages
- 8923-8923
- ISSN
- 2045-2322 (ISSN-L)
- PMC
- PMC4352843
- OpenAlex
- W1993035486
- Cited by
- 281
- References
- 41
- Citations by year
- 2026: 6 · 2025: 15 · 2024: 18 · 2023: 20 · 2022: 25 · 2021: 46 · 2020: 66 · 2019: 17 · 2018: 20 · 2017: 20 · 2016: 27 · 2015: 1
- FWCI
- 18.06
- Type
- journal article
- Language
- en
- Open access
- gold
- doi.org
- Locations
- Scientific Reports (publishedVersion, cc-by)
- Europe PMC (PubMed Central) (publishedVersion, cc-by)
- PubMed Central (publishedVersion, cc-by)
- PubMed (publishedVersion)
- HAL (submittedVersion, other-oa)
- Funders
- National Natural Science Foundation of China (71301165, 71101013)
- Vetenskapsrådet
- Topics
- Health Sciences › Medicine › Epidemiology › Data-Driven Disease Surveillance
- Social Sciences › Transportation › Human Mobility and Location-Based Analysis
- Life Sciences › Immunology and Microbiology › Microbiology › Vibrio bacteria research studies
- Keywords
- cholera, mobile phone data, human mobility, gravity model, outbreak risk prediction, epidemic preparedness and response, emerging infectious diseases
- MeSH terms
- Cholera, Disease Outbreaks, Haiti, Humans, Population Surveillance, Sensitivity and Specificity, Reproducibility of Results, Geographic Information Systems, Cell Phone, Spatio-Temporal Analysis, Geographic Mapping
About these checks
Registry, retraction, Cites and statistics results are computed, not judged, with one exception: a printed reference that no index lists is read once by a model before it counts as a citation error. Claims are extracted by a model and kept only when their quote appears verbatim in the text; each cited source is then checked, with a model’s help, for whether it says what the claim relies on. Those verdicts can be wrong — read the claim’s quote and the cited source before relying on one.
Statistics and arithmetic are recomputed, not judged.
Confidence bands are shown only for fields calibrated on our annotated test set. None is calibrated yet, so no band is shown.
What counts as a claim ›How we measure confidence ›How we check this ›
Are you an author, or do you see a problem with this page? Request a review
