

The DOI matches its Crossref record; 50 of the 52 references it cites were found in a registry or an index.
Word pair classification during imagined speech using direct brain recordings
Open accessAbstract
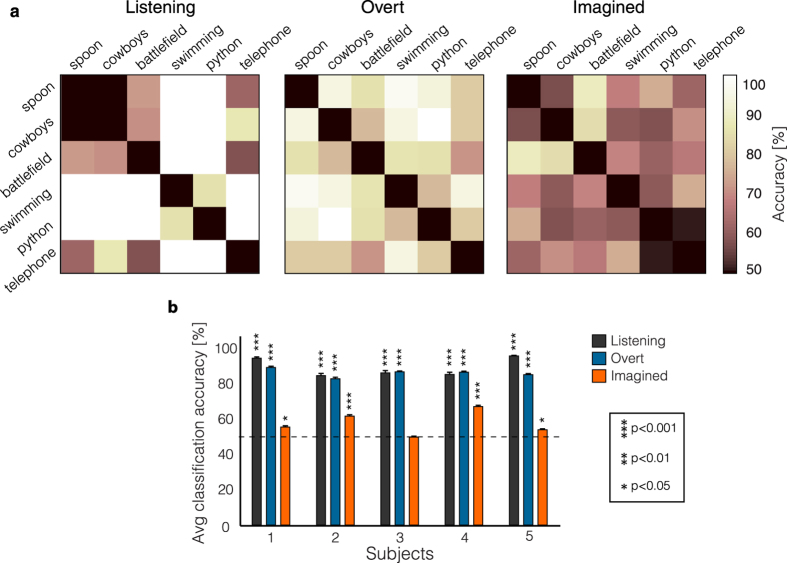
People that cannot communicate due to neurological disorders would benefit from an internal speech decoder. Here, we showed the ability to classify individual words during imagined speech from electrocorticographic signals. In a word imagery task, we used high gamma (70–150 Hz) time features with a support vector machine model to classify individual words from a pair of words. To account for temporal irregularities during speech production, we introduced a non-linear time alignment into the SVM kernel. Classification accuracy reached 88% in a two-class classification framework (50% chance level), and average classification accuracy across fifteen word-pairs was significant across five subjects (mean = 58%; p < 0.05). We also compared classification accuracy between imagined speech, overt speech and listening. As predicted, higher classification accuracy was obtained in the listening and overt speech conditions (mean = 89% and 86%, respectively; p < 0.0001), where speech stimuli were directly presented. The results provide evidence for a neural representation for imagined words in the temporal lobe, frontal lobe and sensorimotor cortex, consistent with previous findings in speech perception and production. These data represent a proof of concept study for basic decoding of speech imagery, and delineate a number of key challenges to usage of speech imagery neural representations for clinical applications.
Overview
The claims and statistics of this paper haven’t been checked yet.
Free: it reads the open-access text and checks the first 5 claims that cite a source we can check. Create a free account to check every claim.
Integrity signals
Registry
Cites
Statistics
Figures



Verification
Claims the paper makes
The claims and statistics of this paper haven’t been checked yet.
Free: it reads the open-access text and checks the first 5 claims that cite a source we can check. Create a free account to check every claim.
Claims other papers make about this one
Each is checked against this paper’s own text: does it say what the citing paper says it does?
The cited source says what the claim attributes to it.
In the citing paper
“Along these lines, when able speakers are instructed to imagine speaking or hearing a word, neural activity in the STG can be used to decode those words with above-chance accuracy59–63.”
From The speech neuroprosthesis (2024) · cites this paper as [59]
Self-check
Percentages, sums and reported differences re-computed from the paper’s own numbers.
The self-check needs the paper’s full text.
Citations
Cites
Controlling the False Discovery Rate: A Practical and Powerful Approach to Multiple Testing
Benjamini, Y., & Hochberg, Y. (1995) · Journal of the Royal Statistical Society Series B: Statistical Methodology · doi:10.1111/j.2517-6161.1995.tb02031.x · Cited by 109,482
LIBSVM: A library for support vector machines
Chang, C.-C., & Lin, C.-J. (2011) · ACM Transactions on Intelligent Systems and Technology · doi:10.1145/1961189.1961199 · Cited by 40,918 · cited 1×
“For all the computations, we used the LIBSVM package 44 .”
MethodThe Elements of Statistical Learning
Hastie, T., Tibshirani, R., & Friedman, J. (2009) · Springer Series in Statistics · doi:10.1007/978-0-387-84858-7 · Cited by 25,970
Fundamentals of speech recognition
Rabiner, L. R., & Juang, B.-H. F. (1993) · Cited by 7,680
Dynamic Programming Algorithm Optimization for Spoken Word Recognition
Sakoe, H., & Chiba, S. (1978) · IEEE Transactions on Acoustics Speech and Signal Processing · doi:10.1109/tassp.1978.1163055 · Cited by 6,727 · cited 2×
“We used dynamic time warping 30,36 (DTW) to locally expand or compress two time series, and find their optimal alignment in time.”
MethodBCI2000: A General-Purpose Brain-Computer Interface (BCI) System
Schalk, G., McFarland, D. J., Hinterberger, T., Birbaumer, N., & Wolpaw, J. R. (2004) · IEEE Transactions on Biomedical Engineering · doi:10.1109/tbme.2004.827072 · Cited by 3,024
Self-citationMultiple Kernel Learning Algorithms
Gönen, M., & Alpaydın, E. (2011) · Journal of Machine Learning Research · doi:10.5555/1953048.2021071 · Cited by 2,173 · cited 2×
“For the final kernel computation, we used a multiple kernel learning approach 37,45 (MKL; see section “Multiple kernel learning” for details) to deal with the multiple kernel matrices – by doing a weighted average of the kernels associated with each electrode (Fig.”
MethodPrice, C. J. (2012) · NeuroImage · doi:10.1016/j.neuroimage.2012.04.062 · Cited by 2,159 · cited 1×
“…imaging studies have shown that imagined speech activates Wernicke’s area 2–8 (superior temporal gyrus and superior temporal sulcus) and Broca’s area 9,10 (inferior frontal gyrus) – two essential language areas involved in speech comprehension and production, respectively (see 11,12 for reviews).”
BackgroundToga, A. W., & Thompson, P. M. (2003) · Nature Reviews Neuroscience · doi:10.1038/nrn1009 · Cited by 1,495
Significance Test for Sphericity of a Normal $n$-Variate Distribution
Mauchly, J. W. (1940) · The Annals of Mathematical Statistics · doi:10.1214/aoms/1177731915 · Cited by 1,136
Cited by
Rhythmic facilitation of sensory processing: A critical review
Haegens, S., & Zion Golumbic, E. (2018) · Neuroscience & Biobehavioral Reviews · doi:10.1016/j.neubiorev.2017.12.002 · Cited by 343
“These observations have prompted some researchers to propose that the stress pattern itself forms a metrical or rhythmic framework that guides speech processing (Martin, 1972; Cutler and Foss, 1977; Hayes, 1984; Cutler, 1986; Cutler and Norris, 1988).”
BackgroundInferring imagined speech using EEG signals: a new approach using Riemannian manifold features
Nguyen, C. H., Karavas, G. K., & Artemiadis, P. (2018) · Journal of Neural Engineering · doi:10.1088/1741-2552/aa8235 · Cited by 289
Towards reconstructing intelligible speech from the human auditory cortex
Akbari, H., Khalighinejad, B., Herrero, J. L., Mehta, A. D., & Mesgarani, N. (2019) · Scientific Reports · doi:10.1038/s41598-018-37359-z · Cited by 221
Speech synthesis from ECoG using densely connected 3D convolutional neural networks
Angrick, M., Herff, C., Mugler, E., Tate, M. C., Slutzky, M. W., Krusienski, D. J., & Schultz, T. (2019) · Journal of Neural Engineering · doi:10.1088/1741-2552/ab0c59 · Cited by 225
“Initial studies in the decoding of attempted [71] and imagined speech [72] emphasize this point.”
BackgroundDecoding speech perception from non-invasive brain recordings
Défossez, A., Caucheteux, C., Rapin, J., Kabeli, O., & King, J.-R. (2023) · Nature Machine Intelligence · doi:10.1038/s42256-023-00714-5 · Cited by 215
“To reach the performance obtained with clinical recordings [7, 8, 37, 52, 59, 61, 66, 93], decoding intended communication will thus require addressing several challenges.”
BackgroundImagined speech can be decoded from low- and cross-frequency intracranial EEG features
Proix, T., Delgado Saa, J., Christen, A., Martin, S., Pasley, B. N., Knight, R. T., Tian, X., Poeppel, D., Doyle, W. K., Devinsky, O., et al. (2022) · Nature Communications · doi:10.1038/s41467-021-27725-3 · Cited by 212
Self-citationBiosignal-Based Spoken Communication: A Survey
Schultz, T., Wand, M., Hueber, T., Krusienski, D. J., Herff, C., & Brumberg, J. S. (2017) · IEEE/ACM Transactions on Audio, Speech, and Language Processing · doi:10.1109/taslp.2017.2752365 · Cited by 201
Encoding and Decoding Models in Cognitive Electrophysiology
Holdgraf, C., Rieger, J. W., Micheli, C., Martin, S., Knight, R. T., & Theunissen, F. E. (2017) · Frontiers in Systems Neuroscience · doi:10.3389/fnsys.2017.00061 · Cited by 181
“…Chang, 2014), phonemes (Chang et al., 2010; Brumberg et al., 2011; Mugler et al., 2014), syllables (Blakely et al., 2008), words (Kellis et al., 2010; Martin et al., 2016), sentences (Zhang et al., 2012), segmental features (Lotte et al., 2015), and semantic information (Degenhart et al., 2011).”
BackgroundInfluentialSelf-citationKim, T., Shin, Y., Kang, K., Kim, K., Kim, G., Byeon, Y., Kim, H., Gao, Y., Lee, J. R., Son, G., et al. (2022) · Nature Communications · doi:10.1038/s41467-022-33457-9 · Cited by 157
Decoding spoken phonemes from sensorimotor cortex with high-density ECoG grids
Ramsey, N. F., Salari, E., Aarnoutse, E. J., Vansteensel, M. J., Bleichner, M. G., & Freudenburg, Z. V. (2018) · NeuroImage · doi:10.1016/j.neuroimage.2017.10.011 · Cited by 124
“Imagined speaking in people without speech impediments appears to be significantly less decodable from auditory cortex than overt or heard speech (Martin et al., 2016).”
InfluentialAngrick, M., Ottenhoff, M. C., Diener, L., Ivucic, D., Ivucic, G., Goulis, S., Saal, J., Colon, A. J., Wagner, L., Krusienski, D. J., et al. (2021) · Communications Biology · doi:10.1038/s42003-021-02578-0 · Cited by 125
Decoding Inner Speech Using Electrocorticography: Progress and Challenges Toward a Speech Prosthesis
Martin, S., Iturrate, I., Millán, J. D. R., Knight, R. T., & Pasley, B. N. (2018) · Frontiers in Neuroscience · doi:10.3389/fnins.2018.00422 · Cited by 115
Self-citationMin, B., Kim, J., Park, H.-J., & Lee, B. (2016) · BioMed Research International · doi:10.1155/2016/2618265 · Cited by 136
“Moreover, several studies using ECoG reported quite good results in the gamma frequency for imagined speech classification [35, 36], and these findings are consistent with our results.”
ResultBrain-Computer Interface: Applications to Speech Decoding and Synthesis to Augment Communication
Luo, S., Rabbani, Q., & Crone, N. E. (2022) · Neurotherapeutics · doi:10.1007/s13311-022-01190-2 · Cited by 106
“Despite these challenges, multiple studies have shown success in phoneme [42, 43], word [50], and sentence classification [28] from ECoG signals (see detailed review of covert speech decoding in [105]).”
BackgroundA State-of-the-Art Review of EEG-Based Imagined Speech Decoding
Lopez-Bernal, D., Balderas, D., Ponce, P., & Molina, A. (2022) · Frontiers in Human Neuroscience · doi:10.3389/fnhum.2022.867281 · Cited by 107
“For example, in Martin et al. (2016) imagined speech pairwise classification reached an accuracy of 88.3% through ECoG recording.”
MethodInfluentialNeurolinguistics Research Advancing Development of a Direct-Speech Brain-Computer Interface
Cooney, C., Folli, R., & Coyle, D. (2018) · iScience · doi:10.1016/j.isci.2018.09.016 · Cited by 122
Neural ensemble dynamics in dorsal motor cortex during speech in people with paralysis
Stavisky, S. D., Willett, F. R., Wilson, G. H., Murphy, B. A., Rezaii, P., Avansino, D. T., Memberg, W. D., Miller, J. P., Kirsch, R. F., Hochberg, L. R., et al. (2019) · eLife · doi:10.7554/elife.46015 · Cited by 105
Silva, A. B., Littlejohn, K. T., Liu, J. R., Moses, D. A., & Chang, E. F. (2024) · Nature Reviews Neuroscience · doi:10.1038/s41583-024-00819-9 · Cited by 103
“Along these lines, when able speakers are instructed to imagine speaking or hearing a word, neural activity in the STG can be used to decode those words with above-chance accuracy 59–63 .”
Towards an EEG-based Intuitive BCI Communication System Using Imagined Speech and Visual Imagery
Lee, S., Lee, M., Jeong, J.-H., & Lee, S. (2019) · Conference proceedings/Conference proceedings - IEEE International Conference on Systems, Man, and Cybernetics · doi:10.1109/smc.2019.8914645 · Cited by 103
Multiclass Classification of Word Imagination Speech With Hybrid Connectivity Features
Qureshi, M. N. I., Min, B., Park, H.-J., Cho, D., Choi, W., & Lee, B. (2017) · IEEE Transactions on Biomedical Engineering · doi:10.1109/tbme.2017.2786251 · Cited by 104
Tang, C., Xu, M., Yi, W., Zhang, Z., Occhipinti, E., Dong, C., Ravenscroft, D., Jung, S., Lee, S., Gao, S., et al. (2024) · npj Flexible Electronics · doi:10.1038/s41528-024-00315-1 · Cited by 112
Dimensions of Ethical Direct-to-Consumer Neurotechnologies
Kreitmair, K. (2019) · AJOB Neuroscience · doi:10.1080/21507740.2019.1665120 · Cited by 97
“With electrocorticography (ECoG), researchers have been able to decode the words a person is thinking to herself (Martin et al. 2016).”
BackgroundRepresentation of internal speech by single neurons in human supramarginal gyrus
Wandelt, S. K., Bjånes, D. A., Pejsa, K., Lee, B., Liu, C., & Andersen, R. A. (2024) · Nature Human Behaviour · doi:10.1038/s41562-024-01867-y · Cited by 74
“31 investigated the decoding of six words during internal speech.”
BackgroundSpeech Recognition with No Speech or with Noisy Speech
Krishna, G., Tran, C., Yu, J., & Tewfik, A. H. (2019) · IEEE International Conference on Acoustics Speech and Signal Processing · doi:10.1109/icassp.2019.8683453 · Cited by 79
Identification of vowels in consonant–vowel–consonant words from speech imagery based EEG signals
Chengaiyan, S., Sree, R. A., & Kavitha, A. (2019) · Cognitive Neurodynamics · doi:10.1007/s11571-019-09558-5 · Cited by 86
Brain2Char: a deep architecture for decoding text from brain recordings
Sun, P., Anumanchipalli, G. K., & Chang, E. F. (2020) · Journal of Neural Engineering · doi:10.1088/1741-2552/abc742 · Cited by 77
Dynamic time warping in classification and selection of motion capture data
Świtoński, A., Josiński, H., & Wojciechowski, K. W. (2018) · Multidimensional Systems and Signal Processing · doi:10.1007/s11045-018-0611-3 · Cited by 70
Deep-Learning-Based BCI for Automatic Imagined Speech Recognition Using SPWVD
Kamble, A., Ghare, P. H., & Kumar, V. (2022) · IEEE Transactions on Instrumentation and Measurement · doi:10.1109/tim.2022.3216673 · Cited by 91
“In addition, Martin et al. [24] have chosen words to maximize variability in terms of acoustic features, the number of syllables, and semantic categories.”
BackgroundDecoding Imagined Speech Based on Deep Metric Learning for Intuitive BCI Communication
Lee, D.-Y., Lee, M., & Lee, S. (2021) · IEEE Transactions on Neural Systems and Rehabilitation Engineering · doi:10.1109/tnsre.2021.3096874 · Cited by 83
Mégevand, P., Mercier, M. R., Groppe, D. M., Golumbic, E. Z., Mesgarani, N., Beauchamp, M. S., Schroeder, C. E., & Mehta, A. D. (2020) · Journal of Neuroscience · doi:10.1523/jneurosci.0555-20.2020 · Cited by 67
“Efforts to track the neuronal correlates of speech imagery have struggled with the temporal alignment between cortical activity and the presumed (physically absent) speech, even for single words (Martin et al., 2016).”
BackgroundDeep Learning the EEG Manifold for Phonological Categorization from Active Thoughts
Saha, P., Fels, S., & Abdul-Mageed, M. (2019) · IEEE International Conference on Acoustics Speech and Signal Processing · doi:10.1109/icassp.2019.8682330 · Cited by 69
Rainey, S., Martin, S., Christen, A., Mégevand, P., & Fourneret, E. (2020) · Science and Engineering Ethics · doi:10.1007/s11948-020-00218-0 · Cited by 65
Self-citationFocal versus distributed temporal cortex activity for speech sound category assignment
Bouton, S., Chambon, V., Tyrand, R., Guggisberg, A. G., Seeck, M., Karkar, S., Ville, D. V. D., & Giraud, A. (2018) · Proceedings of the National Academy of Sciences · doi:10.1073/pnas.1714279115 · Cited by 67
Mel Frequency Cepstral Coefficients Enhance Imagined Speech Decoding Accuracy from EEG
Cooney, C., Folli, R., & Coyle, D. (2018) · Irish Signals and Systems Conference · doi:10.1109/issc.2018.8585291 · Cited by 78
Direct-Sense Brain–Computer Interfaces and Wearable Computers
Lin, C., & Do, T. (2020) · IEEE Transactions on Systems Man and Cybernetics Systems · doi:10.1109/tsmc.2020.3041382 · Cited by 70
“without sound [82], [83], [96]–[100], known as imagined articulations [97], [99] or imagined words [98], and silent”
BackgroundMethodA Bimodal Deep Learning Architecture for EEG-fNIRS Decoding of Overt and Imagined Speech
Cooney, C., Folli, R., & Coyle, D. (2021) · IEEE Transactions on Biomedical Engineering · doi:10.1109/tbme.2021.3132861 · Cited by 70
Multiclass covert speech classification using extreme learning machine
Pawar, D., & Dhage, S. (2020) · Biomedical Engineering Letters · doi:10.1007/s13534-020-00152-x · Cited by 64
“However, several ECoG based studies were reported with optimized results for imagined speech classification in gamma frequency band [34, 35], this study might be the first report which reveals the significance of gamma frequency bands in EEG based covert speech classification of words.”
BackgroundDataset of Speech Production in intracranial Electroencephalography
Verwoert, M., Ottenhoff, M. C., Goulis, S., Colon, A., Wagner, L., Tousseyn, S., van Dijk, J. P., Kubben, P., & Herff, C. (2022) · Scientific Data · doi:10.1038/s41597-022-01542-9 · Cited by 68
Speech Recognition via fNIRS Based Brain Signals
Liu, Y., & Ayaz, H. (2018) · Frontiers in Neuroscience · doi:10.3389/fnins.2018.00695 · Cited by 55
“investigated the classification of individual words from a pair of imagined word using ECoG and a 58% binary classification accuracy has been achieved (Martin et al., 2016).”
MethodSpectral Analysis of EEG Signals for Automatic Imagined Speech Recognition
Kamble, A., Ghare, P. H., Kumar, V., Kothari, A., & Keskar, A. G. (2023) · IEEE Transactions on Instrumentation and Measurement · doi:10.1109/tim.2023.3300473 · Cited by 67
“The EEG-based BCI for imagined speech recognition has applications for both healthy and disabled people, such as those with speech production and speaking disabilities, neuromuscular illness, and other diseases [14], [15], [27].”
BackgroundRoussel, P., Godais, G. L., Bocquelet, F., Palma, M., Jiang, H., Zhang, S., Giraud, A., Mégevand, P., Miller, K. J., Gehrig, J., et al. (2020) · Journal of Neural Engineering · doi:10.1088/1741-2552/abb25e · Cited by 60
“…shown by several groups that spectral features of imagined speech or silent articulation can be predicted from low or high-gamma signals recorded in patients not overtly speaking (Pei et al., 2011; Ikeda et al., 2014; Martin et al., 2014, 2016; Bocquelet et al., 2016a; Anumanchipalli et al., 2019).”
BackgroundSoroush, P. Z., Herff, C., Ries, S. K., Shih, J. J., Schultz, T., & Krusienski, D. J. (2023) · NeuroImage · doi:10.1016/j.neuroimage.2023.119913 · Cited by 48
Word-Based Classification of Imagined Speech Using EEG
Hashim, N., Ali, A., & Mohd-Isa, W.-N. (2018) · Lecture notes in electrical engineering · doi:10.1007/978-981-10-8276-4_19 · Cited by 57
Electroencephalography‐based imagined speech recognition using deep long short‐term memory network
Agarwal, P., & Kumar, S. (2022) · ETRI Journal · doi:10.4218/etrij.2021-0118 · Cited by 48
“The authors [16] used the Gaussian SVM classifier and achieved an accuracy of 57.7% for six classes and 88% for pairwise classification, respectively.”
BackgroundMethodInfluentialRupp, K., Roos, M. J., Milsap, G., Caceres, C. A., Ratto, C. R., Chevillet, M. A., Crone, N. E., & Wolmetz, M. E. (2017) · NeuroImage · doi:10.1016/j.neuroimage.2016.12.074 · Cited by 51
Speech-imagery-based brain–computer interface system using ear-EEG
Kaongoen, N., Choi, J.-H., & Jo, S. (2020) · Journal of Neural Engineering · doi:10.1088/1741-2552/abd10e · Cited by 48
“Martin et al [12] recorded ECoG responses for six words in three conditions: listening, imagined speech, and overt speech.”
Towards reconstructing intelligible speech from the human auditory cortexPreprint
Akbari, H., Khalighinejad, B., Herrero, J. L., Mehta, A. D., & Mesgarani, N. (2018) · bioRxiv (Cold Spring Harbor Laboratory) · doi:10.1101/350124 · Cited by 49
Direct speech reconstruction from sensorimotor brain activity with optimized deep learning models
Berezutskaya, J., Freudenburg, Z. V., Vansteensel, M. J., Aarnoutse, E. J., Ramsey, N. F., & van Gerven, M. A. J. (2023) · Journal of Neural Engineering · doi:10.1088/1741-2552/ace8be · Cited by 42
Direct Speech Reconstruction from Sensorimotor Brain Activity with Optimized Deep Learning Models
Berezutskaya, J., Freudenburg, Z. V., Vansteensel, M. J., Aarnoutse, E. J., Ramsey, N. F., & van Gerven, M. A. J. (2022) · doi:10.1101/2022.08.02.502503 · Cited by 42
Real-time classification of auditory sentences using evoked cortical activity in humans
Moses, D. A., Leonard, M. K., & Chang, E. F. (2018) · Journal of Neural Engineering · doi:10.1088/1741-2552/aaab6f · Cited by 49
Neuroprosthetic Speech: The Ethical Significance of Accuracy, Control and Pragmatics
Rainey, S., Maslen, H., Mégevand, P., Arnal, L. H., Fourneret, É., & Yvert, B. (2019) · Cambridge Quarterly of Healthcare Ethics · doi:10.1017/s0963180119000604 · Cited by 44
“Further work showed that it was possible to decode which one of a pair of more complex words was imagined.(17)”
BackgroundIljina, O., Derix, J., Schirrmeister, R. T., Schulze‐Bonhage, A., Auer, P. L., Aertsen, A., & Ball, T. (2017) · Brain-Computer Interfaces · doi:10.1080/2326263x.2017.1330611 · Cited by 38
The LightGBM-based classification algorithm for Chinese characters speech imagery BCI system
Pan, H., Li, Z., Chen, T., Wang, L., Fu, Y., Qin, X., & Liu, F. (2022) · Cognitive Neurodynamics · doi:10.1007/s11571-022-09819-w · Cited by 37
“The average classification accuracy of the four Chinese characters of the BCI system reached 70% (Miaomiao and Zhiguang 2018).”
BackgroundLu, L., Sheng, J., Liu, Z., & Gao, J. (2021) · NeuroImage · doi:10.1016/j.neuroimage.2021.117724 · Cited by 36
Human hippocampal pre-activation predicts behavior
Jafarpour, A., Piai, V., Lin, J. J., & Knight, R. T. (2017) · Scientific Reports · doi:10.1038/s41598-017-06477-5 · Cited by 35
Self-citationEinizade, A., Mozafari, M., Jalilpour, S., Bagheri, S., & Sardouie, S. H. (2022) · Neuroscience Informatics · doi:10.1016/j.neuri.2022.100091 · Cited by 37
Canny, E., Vansteensel, M. J., van der Salm, S. M. A., Müller-Putz, G., & Berezutskaya, J. (2023) · Journal of NeuroEngineering and Rehabilitation · doi:10.1186/s12984-023-01272-y · Cited by 42
“In parallel, decoding of speech has shown success in decoding individual words [28, 138, 186, 192, 198, 274], phonemes [36, 42, 116, 199, 242], syllables [171, 274] and even continuous decoding of full phrases and sentences [14, 115, 116, 183, 198, 278, 304].”
BackgroundRestoring Speech Using Brain–Computer Interfaces
Stavisky, S. D. (2025) · Annual Review of Biomedical Engineering · doi:10.1146/annurev-bioeng-110122-012818 · Cited by 51
Huggins, J. E., Guger, C., Ziat, M., Zander, T. O., Taylor, D., Tangermann, M., Soria‐Frisch, A., Simeral, J. D., Scherer, R., Rupp, R., et al. (2017) · Brain-Computer Interfaces · doi:10.1080/2326263x.2016.1275488 · Cited by 34
Self-citationAngrick, M., Herff, C., Johnson, G. D., Shih, J. J., Krusienski, D. J., & Schultz, T. (2019) · Neurocomputing · doi:10.1016/j.neucom.2018.10.080 · Cited by 32
Classification of imagined spoken word-pairs using convolutional neural networks
Cooney, C., Folli, R., & Coyle, D. (2019) · Ulster University Research Portal (Ulster University) · doi:10.3217/978-3-85125-682-6-62 · Cited by 41
Optimized Rational Dilation Wavelet Transform for Automatic Imagined Speech Recognition
Kamble, A., Ghare, P. H., & Kumar, V. (2023) · IEEE Transactions on Instrumentation and Measurement · doi:10.1109/tim.2023.3241973 · Cited by 27
“Experiments considering imagined speech started attracting researchers to facilitate healthy people and those with severe brain disabilities in terms of portability and user-friendliness [6], [7], [8], [9], [10], [11], [12], [13], [14], [15], [16], [17], [18], [19], [20], [21].”
BackgroundSpoken and Inner Speech-related EEG Connectivity in Different Spatial Direction
Kiroy, V. N., Бахтин, О. М., Krivko, E., Lazurenko, D. M., Aslanyan, E. V., Shaposhnikov, D. G., & Щербань, И. В. (2021) · Biomedical Signal Processing and Control · doi:10.1016/j.bspc.2021.103224 · Cited by 33
Imagined Speech Classification Using Six Phonetically Distributed Words
Varshney, Y. V., & Khan, A. (2022) · Frontiers in Signal Processing · doi:10.3389/frsip.2022.760643 · Cited by 28
“In recent years, several studies have addressed the imagined speech recognition problem for establishing the BCI using EEG (Deng et al., 2010; Pei et al., 2011; Martin et al., 2016; Min et al., 2016; Hashim et al., 2018).”
BackgroundEEG-based imagined words classification using Hilbert transform and deep networks
Agarwal, P., & Kumar, S. (2023) · Multimedia Tools and Applications · doi:10.1007/s11042-023-15664-8 · Cited by 28
Bhadra, K., Giraud, A., & Marchesotti, S. (2025) · Communications Biology · doi:10.1038/s42003-025-07464-7 · Cited by 33
“, 2014), most often in comparison with overt speech (Brumberg et al., 2016; Leuthardt et al., 2012; Martin et al., 2016; Pei et al., 2011; Proix et al., 2022; Soroush et al., 2022), only a handful of BCI studies have attempted to decode imagined speech in real time, with promising but often limited effectiveness (Angr…”
A Novel Online Bci System Using Speech Imagery and Ear-Eeg for Home Appliances Control
Kaongoen, N., Choi, J.-H., & Jo, S. (2022) · Computer Methods and Programs in Biomedicine · doi:10.1016/j.cmpb.2022.107022 · Cited by 25
Wu, X., Wellington, S., Fu, Z., & Zhang, D. (2024) · Journal of Neural Engineering · doi:10.1088/1741-2552/ad593a · Cited by 27
Feasibility of decoding covert speech in ECoG with a Transformer trained on overt speech
Komeiji, S., Mitsuhashi, T., Iimura, Y., Suzuki, H., Sugano, H., Shinoda, K., & Tanaka, T. (2024) · Scientific Reports · doi:10.1038/s41598-024-62230-9 · Cited by 34
“It has been shown that the activities of SMC contribute to decoding text from overt speech 8,10,17 .”
Transformer-Based Estimation of Spoken Sentences Using Electrocorticography
Komeiji, S., Shigemi, K., Mitsuhashi, T., Iimura, Y., Suzuki, H., Sugano, H., Shinoda, K., & Tanaka, T. (2022) · IEEE International Conference on Acoustics Speech and Signal Processing · doi:10.1109/icassp43922.2022.9747443 · Cited by 26
de Borman, A., Wittevrongel, B., Dauwe, I., Carrette, E., Meurs, A., Roost, D. V., Boon, P., & Hulle, M. M. V. (2024) · Communications Biology · doi:10.1038/s42003-024-06518-6 · Cited by 24
“One notable exception is Martin et al. 16 where the decoder was trained on ECoG recordings of performed speech and tested on those of imagined speech.”
Dash, D., Ferrari, P., Heitzman, D., & Wang, J. (2019) · Annual International Conference of the IEEE Engineering in Medicine and Biology Society (EMBC) · doi:10.1109/embc.2019.8857874 · Cited by 21
“Although EEG is considered as the present standard for BCIs, its low spatial resolution results in intermediate accuracy [4]–[6].”
BackgroundPark, H.-J., & Lee, B. (2023) · Frontiers in Human Neuroscience · doi:10.3389/fnhum.2023.1186594 · Cited by 20
“Furthermore, several ECoG studies have reported that the high gamma band contains information related to speech processing (Greenlee et al., 2011; Llorens et al., 2011; Martin et al., 2016; Panachakel and Ramakrishnan, 2021a).”
BackgroundGeneral principles of machine learning for brain-computer interfacing
Iturrate, I., Chavarriaga, R., & Millán, J. D. R. (2020) · Handbook of clinical neurology · doi:10.1016/b978-0-444-63934-9.00023-8 · Cited by 26
Self-citationOnline internal speech decoding from single neurons in a human participant
Wandelt, S. K., Bjånes, D. A., Pejsa, K., Lee, B., Liu, C., & Andersen, R. A. (2022) · doi:10.1101/2022.11.02.22281775 · Cited by 17
“The tasks cued six words informed by Martin et al., 2016 (Spoon, Python, Battlefield, Cowboy, Swimming, Telephone) as well as two pseudowords (Bindip, Nifzig).”
BackgroundMethodInfluentialCooney, C., Folli, R., & Coyle, D. (2022) · Neuroscience & Biobehavioral Reviews · doi:10.1016/j.neubiorev.2022.104783 · Cited by 19
“, 2014), with studies demonstrating that 1s is enough for participants to produce single words in overt speech (Martin et al., 2016; Mugler et al., 2014).”
BackgroundMethodInfluentialNeural tracking of speech mental imagery during rhythmic inner counting
Lu, L., Wang, Q., Sheng, J., Liu, Z., Qin, L., Li, L., & Gao, J. (2019) · eLife · doi:10.7554/elife.48971 · Cited by 16
Advancing Speech Synthesis using EEG
Krishna, G., Tran, C., Carnahan, M., & Tewfik, A. H. (2021) · International IEEE/EMBS Conference on Neural Engineering · doi:10.1109/ner49283.2021.9441306 · Cited by 19
Meng, K., Grayden, D. B., Cook, M. J., Vogrin, S. J., & Goodarzy, F. (2021) · International Winter Conference on Brain-Computer Interface (BCI) · doi:10.1109/bci51272.2021.9385355 · Cited by 20
“Discriminative power and classification accuracies obtained for IMAGINE trials were lower than for LISTEN and SPEAK trials, similar to [12, 19].”
BackgroundResultInfluentialImagined word pairs recognition from non-invasive brain signals using Hilbert transform
Agarwal, P., & Kumar, S. (2021) · International Journal of Systems Assurance Engineering and Management · doi:10.1007/s13198-021-01283-9 · Cited by 13
Imaginary Speech Recognition Using a Convolutional Network with Long-Short Memory
Rusnac, A.-L., & Grigore, O. (2022) · Applied Sciences · doi:10.3390/app122211873 · Cited by 13
Decoding Semantic Categories from EEG Activity in Object-Based Decision Tasks
Rekrut, M., Sharma, M., Schmitt, M., Alexandersson, J., & Krüger, A. (2020) · International Winter Conference on Brain-Computer Interface (BCI) · doi:10.1109/bci48061.2020.9061628 · Cited by 14
Decoding Semantic Categories from EEG Activity in Silent Speech Imagination Tasks
Rekrut, M., Sharma, M., Schmitt, M., Alexandersson, J., & Krüger, A. (2021) · International Winter Conference on Brain-Computer Interface (BCI) · doi:10.1109/bci51272.2021.9385357 · Cited by 16
Intracranial Electrophysiology in Language Research
Flinker, A., Piai, V., & Knight, R. T. (2018) · Oxford University Press eBooks · doi:10.1093/oxfordhb/9780198786825.013.43 · Cited by 12
Self-citationCommon and distinct neural representations of imagined and perceived speech
Lu, L., Han, M., Zou, G., Zheng, L., & Gao, J.-H. (2023) · Cerebral Cortex · doi:10.1093/cercor/bhac519 · Cited by 11
Improving Silent Speech BCI Training Procedures Through Transfer from Overt to Silent Speech
Rekrut, M., Selim, A. M., & Krüger, A. (2022) · Conference proceedings/Conference proceedings - IEEE International Conference on Systems, Man, and Cybernetics · doi:10.1109/smc53654.2022.9945447 · Cited by 15
“…authors contributed equally to this work. field has shown impressive results with invasive measurement methods like Electrocorticography (ECoG) [5], [6] but also non-invasive methods as for example Electroencephalography (EEG) have shown to be suitable to decode single imag-ined words from…”
BackgroundSelf-Supervised Learning of Neural Speech Representations From Unlabeled Intracranial Signals
Lesaja, S., Stuart, M., Shih, J. J., Soroush, P. Z., Schultz, T., Manic, M., & Krusienski, D. J. (2022) · IEEE Access · doi:10.1109/access.2022.3230688 · Cited by 12
“Recent efforts have progressed to real-time synthesis or classification, and decoding of imagined speech [8], [9], [10], [11], [12], [13].”
BackgroundSilent speech classification based upon various feature extraction methods
Agarwal, P., Kale, R. K., Kumar, M., & Kumar, S. (2020) · International Conference on Signal Processing and Integrated Networks (SPIN) · doi:10.1109/spin48934.2020.9070969 · Cited by 12
“These channels are located in the motor cortex region, which is an essential language area responsible for speech perception and production [17].”
BackgroundHuman brain function and brain-computer interfaces
Ramsey, N. F. (2020) · Handbook of clinical neurology · doi:10.1016/b978-0-444-63934-9.00001-9 · Cited by 16
ILIOPOULOS, A. C., & Papasotiriou, I. (2021) · Neuroscience · doi:10.1016/j.neuroscience.2021.11.045 · Cited by 12
Stuart, M., Lesaja, S., Shih, J. J., Schultz, T., Manic, M., & Krusienski, D. J. (2022) · IEEE Transactions on Neural Systems and Rehabilitation Engineering · doi:10.1109/tnsre.2022.3207624 · Cited by 10
“Recent efforts have progressed to real-time decoding and synthesis of overt and imagined speech [13], [14], [15], [16], [17], [18].”
BackgroundXue, P., Wang, K., Ma, C., Chen, C., Yin, M., & Diao, D. (2025) · Carbon · doi:10.1016/j.carbon.2025.120720 · Cited by 10
Mangiaruga, A., D’Atri, A., Scarpelli, S., Alfonsi, V., Camaioni, M., Annarumma, L., Gorgoni, M., Pazzaglia, M., & Gennaro, L. D. (2021) · SLEEP · doi:10.1093/sleep/zsab284 · Cited by 11
Don’t put words in my mouth: speech perception can falsely activate a brain-computer interface
Schippers, A., Vansteensel, M. J., Freudenburg, Z. V., Luo, S., Crone, N. E., & Ramsey, N. F. (2025) · Journal of NeuroEngineering and Rehabilitation · doi:10.1186/s12984-025-01689-7 · Cited by 8
Prediction of Speech Onset by Micro-Electrocorticography of the Human Brain
Delfino, E., Pastore, A., Zucchini, E., Cruz, M. F. P., Ius, T., Vomero, M., D’Ausilio, A., Casile, A., Škrap, M., Stieglitz, T., et al. (2021) · International Journal of Neural Systems · doi:10.1142/s0129065721500258 · Cited by 11
Benitez-Andonegui, A., Lührs, M., Nagels-Coune, L., Ivanov, D., Goebel, R., & Sorger, B. (2021) · Neurophotonics · doi:10.1117/1.nph.8.2.025012 · Cited by 13
DAIS: The Delft Database of EEG Recordings of Dutch Articulated and Imagined Speech
Dekker, B., Schouten, A. C., & Scharenborg, O. (2023) · IEEE International Conference on Acoustics Speech and Signal Processing · doi:10.1109/icassp49357.2023.10096145 · Cited by 15
“The neural signals that give the best results in BCIs are obtained using electrocorticography (ECoG) [4][5][6].”
MethodIndividual Word Classification During Imagined Speech Using Intracranial Recordings
Martin, S., Iturrate, I., Brunner, P., Millán, J. D. R., Schalk, G., Knight, R. T., & Pasley, B. N. (2019) · Springer briefs in electrical and computer engineering · doi:10.1007/978-3-030-05668-1_8 · Cited by 7
Self-citationSaa, J. F. D., Christen, A., Martin, S., Pasley, B. N., Knight, R. T., & Giraud, A. (2020) · Scientific Reports · doi:10.1038/s41598-020-63303-1 · Cited by 7
Self-citationRekrut, M., Fey, A., Nadig, M., Ihl, J., Jungbluth, T., & Krüger, A. (2022) · IEEE International Conference on Metrology for eXtended Reality, Artificial Intelligence and Neural Engineering (MetroXRAINE) · doi:10.1109/metroxraine54828.2022.9967665 · Cited by 8
“This process of silent or imagined speech is comparable to the inner monologue of a person like speaking to oneself or reading a book silently and has become a widely researched topic over the last years [1]–[3].”
Background
Metadata
- Authors
- Martin, S., Brunner, P., Iturrate, I., Millán, J. D. R., Schalk, G., Knight, R. T., & Pasley, B. N.
- Affiliations
- École Polytechnique Fédérale de Lausanne (CH)
- New York State Department of Health (US)
- University of California, Berkeley (US)
- Corresponding author
- Pasley, Brian N.
- ORCID
- Venue
- Scientific Reports
- Published
- 2016-05-11
- Volume
- 6
- Issue
- 1
- Pages
- 25803-25803
- ISSN
- 2045-2322 (ISSN-L)
- PMC
- PMC4863149
- OpenAlex
- W2388216700
- Cited by
- 171
- References
- 52
- Citations by year
- 2026: 14 · 2025: 17 · 2024: 16 · 2023: 15 · 2022: 25 · 2021: 21 · 2020: 17 · 2019: 21 · 2018: 12 · 2017: 11 · 2016: 2
- FWCI
- 9.76
- Type
- journal article
- Language
- en
- Update notices
- correction (2017-03-23)
- Open access
- gold
- doi.org
- Licence
- cc-by
- creativecommons.org/licenses/by/4.0 (tdm)
- creativecommons.org/licenses/by/4.0 (vor)
- Locations
- Scientific Reports (publishedVersion, cc-by)
- PubMed Central (publishedVersion, cc-by)
- PubMed (publishedVersion)
- Infoscience (Ecole Polytechnique Fédérale de Lausanne) (submittedVersion, cc-by-nc-nd)
- Infoscience (Ecole Polytechnique Fédérale de Lausanne) (submittedVersion)
- Funders
- National Institutes of Health (EB018783)
- National Institute on Deafness and Other Communication Disorders (K99DC012804)
- National Institute of Neurological Disorders and Stroke (R37NS021135, EB00856, R3721135)
- National Institute of Biomedical Imaging and Bioengineering (R01EB006356, R01EB000856, P41EB018783)
- Army Research Office (W911NF-14-1, W911NF-08-1, W911NF-14-1-0440, W911NF-12-1-0109, W911NF, W911NF-08-1-0216)
- Topics
- Life Sciences › Neuroscience › Cognitive Neuroscience › EEG and Brain-Computer Interfaces
- Life Sciences › Neuroscience › Cognitive Neuroscience › Neurobiology of Language and Bilingualism
- Life Sciences › Neuroscience › Cognitive Neuroscience › Tactile and Sensory Interactions
- Keywords
- imagined speech, electrocorticography, high-gamma oscillations, support vector machine, overt speech, speech perception, sensorimotor cortex, temporal lobe, frontal lobe, neuroprosthetics
- MeSH terms
- Acoustic Stimulation, Auditory Perception, Brain, Brain Mapping, Discrimination, Psychological, Electrodes, Electroencephalography, Humans, Imagination, ROC Curve, Speech, Time Factors, Vocabulary, Gamma Rhythm
About these checks
Registry, retraction, Cites and statistics results are computed, not judged, with one exception: a printed reference that no index lists is read once by a model before it counts as a citation error. Claims are extracted by a model and kept only when their quote appears verbatim in the text; each cited source is then checked, with a model’s help, for whether it says what the claim relies on. Those verdicts can be wrong — read the claim’s quote and the cited source before relying on one.
Statistics and arithmetic are recomputed, not judged.
Confidence bands are shown only for fields calibrated on our annotated test set. None is calibrated yet, so no band is shown.
What counts as a claim ›How we measure confidence ›How we check this ›
Are you an author, or do you see a problem with this page? Request a review
Data sources
Bibliographic data: Semantic Scholar, OpenAlex, Crossref.
Contains information from the Semantic Scholar Academic Graph Datasets, made available under the ODC Attribution License (ODC-BY 1.0).
Semantic Scholar’s data is described in: Kinney, R., et al. (2023). The Semantic Scholar Open Data Platform. arXiv:2301.10140.
