

The DOI matches its Crossref record; 56 of the 56 references it cites were found in a registry or an index.
Antibiotic-induced perturbations in gut microbial diversity influences neuro-inflammation and amyloidosis in a murine model of Alzheimer’s disease
Open accessAbstract
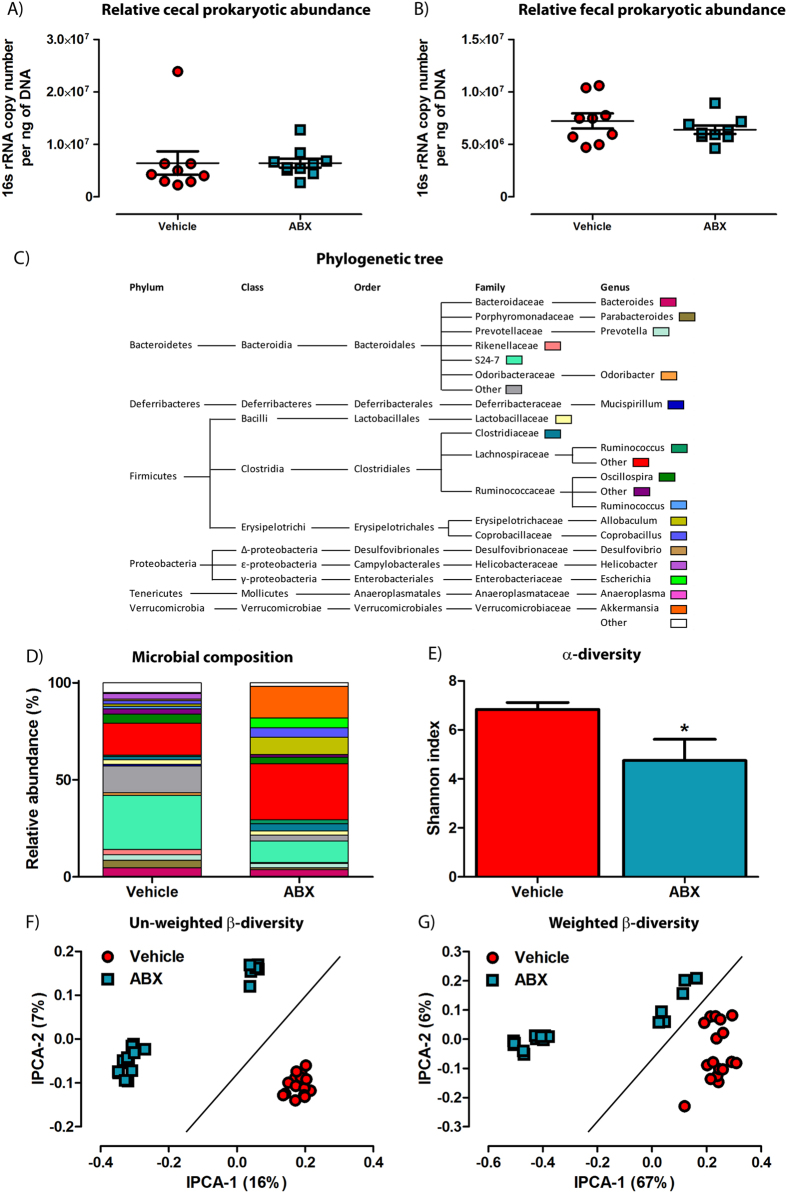
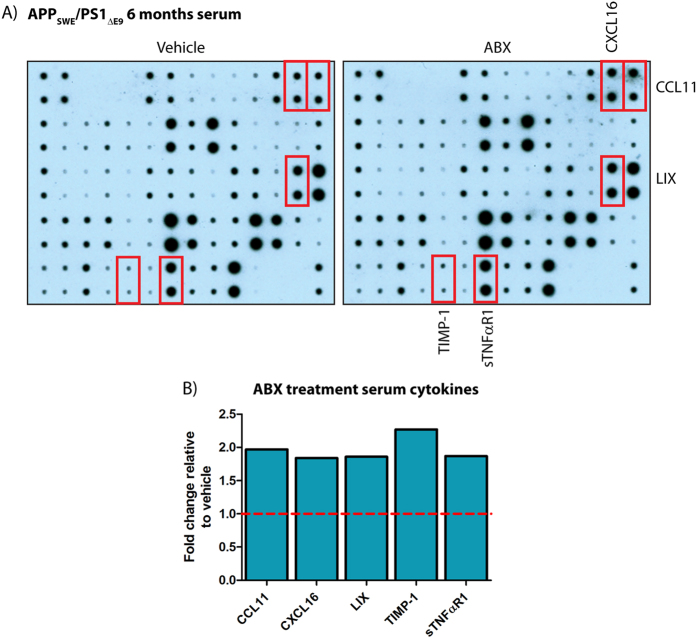
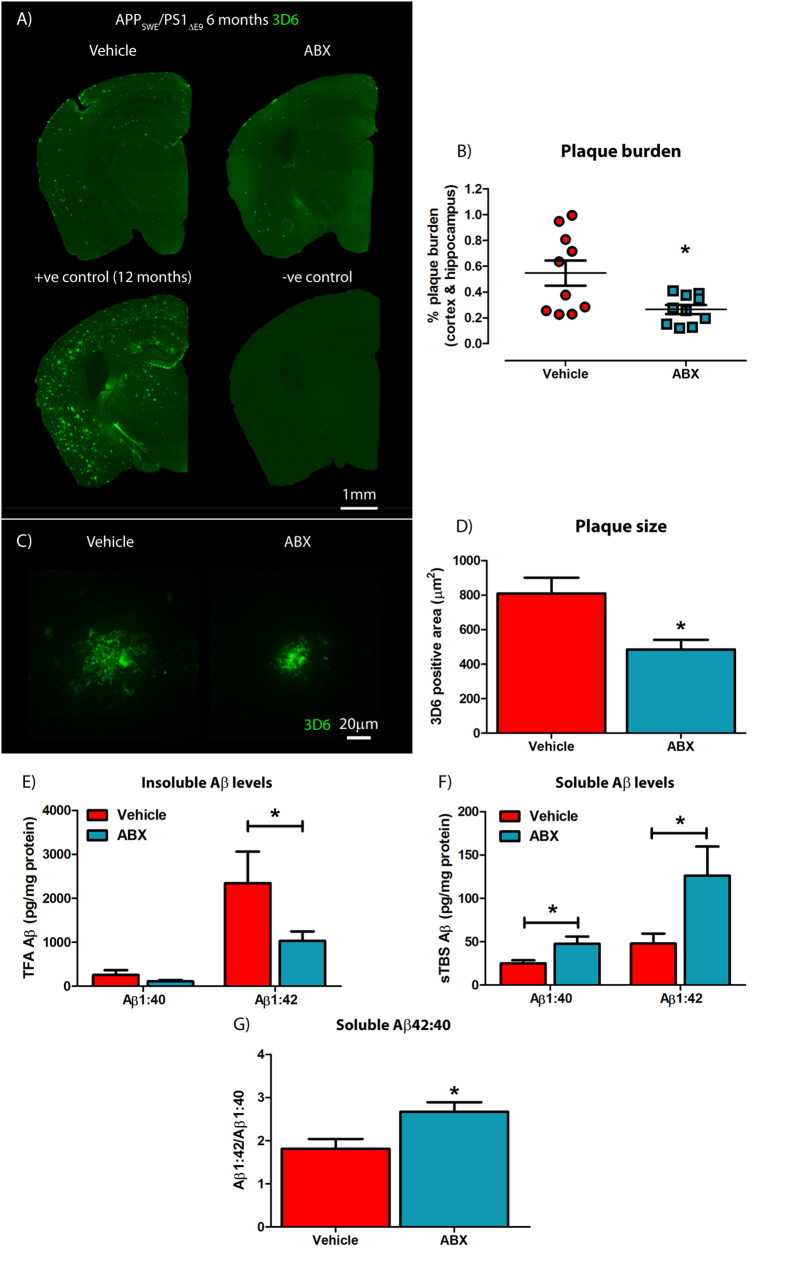
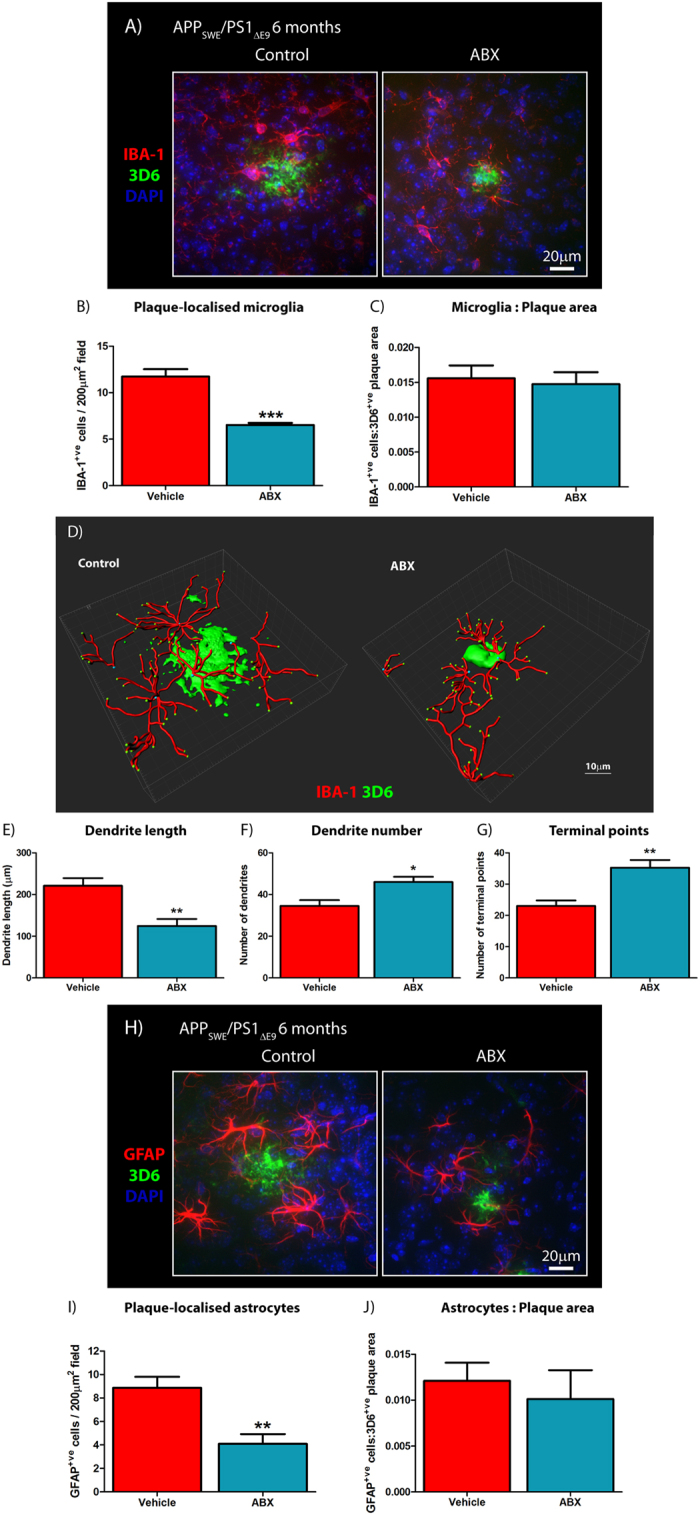
Severe amyloidosis and plaque-localized neuro-inflammation are key pathological features of Alzheimer’s disease (AD). In addition to astrocyte and microglial reactivity, emerging evidence suggests a role of gut microbiota in regulating innate immunity and influencing brain function. Here, we examine the role of the host microbiome in regulating amyloidosis in the APP SWE /PS1 ΔE9 mouse model of AD. We show that prolonged shifts in gut microbial composition and diversity induced by long-term broad-spectrum combinatorial antibiotic treatment regime decreases Aβ plaque deposition. We also show that levels of soluble Aβ are elevated and that levels of circulating cytokine and chemokine signatures are altered in this setting. Finally, we observe attenuated plaque-localised glial reactivity in these mice and significantly altered microglial morphology. These findings suggest the gut microbiota community diversity can regulate host innate immunity mechanisms that impact Aβ amyloidosis.
Overview
The claims and statistics of this paper haven’t been checked yet.
Run the check — free, no account needed. It reads the open-access text and checks the sources it cites.
Integrity signals
Registry
Cites
Statistics
Figures
Verification
Claims the paper makes
The claims and statistics of this paper haven’t been checked yet.
Run the check — free, no account needed. It reads the open-access text and checks the sources it cites.
Claims other papers make about this one
Each is checked against this paper’s own text: does it say what the citing paper says it does?
The cited source says what the claim attributes to it.
In the citing paper
“antibiotic-induced perturbations in gut microbial diversity influence neuroinflammation with altered microglial morphology (105–107).”
From The Role of Short-Chain Fatty Acids From Gut Microbiota in Gut-Brain Communication (2020) · cites this paper as [105]
In the citing paper
“However, antibiotics can reduce Aβ deposition and plaque-associated glial reactivity in an AD mouse model [585].”
From Molecular and cellular mechanisms underlying the pathogenesis of Alzheimer’s disease (2020) · cites this paper as [585]
In the citing paper
“Eliminating gut bacteria can reduce plaque load and microglial activation in an amyloid model of AD in mice [80].”
From The endotoxin hypothesis of neurodegeneration (2019) · cites this paper as [80]
In the citing paper
“In Aβ-mice, manipulating gut microbiota influences Aβ deposition and alters microglial reactivity and morphology by unknown mechanisms149.”
From Microglia in neurodegeneration (2018) · cites this paper as [149]
In the citing paper
“Indeed, one study demonstrated that APP/PS1ΔE9 mice chronically administered a cocktail of high dose antibiotics to modulate microbiome composition had significantly reduced Aβ plaque load, reduced plaque size, increased soluble Aβ42 levels and reduced plaque-associated microglia and reactive astrocytes (Minter et al., 2016).”
From Alzheimer Disease: An Update on Pathobiology and Treatment Strategies (2019) · cites this paper as Minter et al., 2016
In the citing paper
“Perturbations in microbial diversity, secondary to antimicrobials, have been shown to influence pro-inflammatory cytokine secretion in the CNS and alter microglial morphology (268–270).”
From Signalling cognition: The gut microbiota and hypothalamic-pituitary-adrenal axis (2023) · cites this paper as [268]
Self-check
Percentages, sums and reported differences re-computed from the paper’s own numbers.
The self-check needs the paper’s full text.
Citations
Cites
QIIME allows analysis of high-throughput community sequencing data
Caporaso, J. G., Kuczynski, J., Stombaugh, J., Bittinger, K., Bushman, F. D., Costello, E. K., Fierer, N., Peña, A. G., Goodrich, J. K., Gordon, J. I., et al. (2010) · Nature Methods · doi:10.1038/nmeth.f.303 · Cited by 34,887
Naive Bayesian Classifier for Rapid Assignment of rRNA Sequences into the New Bacterial Taxonomy
Wang, Q., Garrity, G. M., Tiedje, J. M., & Cole, J. R. (2007) · Applied and Environmental Microbiology · doi:10.1128/aem.00062-07 · Cited by 20,145
FastTree 2 – Approximately Maximum-Likelihood Trees for Large Alignments
Price, M. N., Dehal, P. S., & Arkin, A. P. (2010) · PLoS ONE · doi:10.1371/journal.pone.0009490 · Cited by 14,894
UniFrac: a New Phylogenetic Method for Comparing Microbial Communities
Lozupone, C., & Knight, R. (2005) · Applied and Environmental Microbiology · doi:10.1128/aem.71.12.8228-8235.2005 · Cited by 8,227
Glutamate neurotoxicity and diseases of the nervous system
Choi, D. W. (1988) · Neuron · doi:10.1016/0896-6273(88)90162-6 · Cited by 8,188
McDonald, D. T., Price, M. N., Goodrich, J. K., Nawrocki, E. P., DeSantis, T. Z., Probst, A. J., Andersen, G. L., Knight, R. D., & Hugenholtz, P. (2011) · The ISME Journal · doi:10.1038/ismej.2011.139 · Cited by 5,144
Host microbiota constantly control maturation and function of microglia in the CNS
Erny, D., Hrabě de Angelis, A. L., Jaitin, D., Wieghofer, P., Staszewski, O., David, E., Keren-Shaul, H., Mahlakoiv, T., Jakobshagen, K., Buch, T., et al. (2015) · Nature Neuroscience · doi:10.1038/nn.4030 · Cited by 3,569
PyNAST: a flexible tool for aligning sequences to a template alignment
Caporaso, J. G., Bittinger, K. L., Bushman, F. D., DeSantis, T. Z., Andersen, G. L., & Knight, R. D. (2009) · Bioinformatics · doi:10.1093/bioinformatics/btp636 · Cited by 3,449
Harold, D., Abraham, R., Hollingworth, P., Sims, R., Gerrish, A., Hamshere, M. L., Pahwa, J. S., Moskvina, V., Dowzell, K., Williams, A., et al. (2009) · Nature Genetics · doi:10.1038/ng.440 · Cited by 3,326
TREM2 Variants in Alzheimer's Disease
Guerreiro, R., Wojtas, A., Bras, J., Carrasquillo, M., Rogaeva, E., Majounie, E., Cruchaga, C., Sassi, C., Kauwe, J. S. K., Younkin, S., et al. (2013) · New England Journal of Medicine · doi:10.1056/nejmoa1211851 · Cited by 3,020
Cited by
Sorted by citations
Cryan, J. F., O'Riordan, K. J., Cowan, C. S. M., Sandhu, K. V., Bastiaanssen, T. F. S., Boehme, M., Codagnone, M. G., Cussotto, S., Fulling, C., Golubeva, A. V., et al. (2019) · Physiological Reviews · doi:10.1152/physrev.00018.2018 · Cited by 5,286
Gut microbiota regulate motor deficits and neuroinflammation in a model of Parkinson's disease
Sampson, T. R., Debelius, J. W., Thron, T., Janssen, S., Shastri, G. G., Ilhan, Z. E., Challis, C., Schretter, C. E., Rocha, S., Gradinaru, V., et al. (2016) · Cell · doi:10.1016/j.cell.2016.11.018 · Cited by 3,622
Alzheimer Disease: An Update on Pathobiology and Treatment Strategies
Long, J. M., & Holtzman, D. M. (2019) · Cell · doi:10.1016/j.cell.2019.09.001 · Cited by 3,204
Self-citationMicrobiota in health and diseases
Hou, K., Wu, Z.-X., Chen, X.-Y., Wang, J.-Q., Zhang, D., Xiao, C., Zhu, D., Koya, J. B., Wei, L., Li, J., et al. (2022) · Signal Transduction and Targeted Therapy · doi:10.1038/s41392-022-00974-4 · Cited by 3,171
The Role of Short-Chain Fatty Acids From Gut Microbiota in Gut-Brain Communication
Silva, Y. P., Bernardi, A., & Frozza, R. L. (2020) · Frontiers in Endocrinology · doi:10.3389/fendo.2020.00025 · Cited by 3,043
Metadata
- Authors
- Minter, M. R., Zhang, C., Leone, V., Ringus, D. L., Zhang, X., Oyler-Castrillo, P., Musch, M. W., Liao, F., Ward, J. F., Holtzman, D. M., Chang, E. B., Tanzi, R. E., & Sisodia, S. S.
- Affiliations
- University of Chicago (US)
- Massachusetts General Hospital (US)
- Washington University in St. Louis (US)
- Corresponding author
- Sisodia, Sangram S.
- ORCID
- Venue
- Scientific Reports
- Published
- 2016-07-21
- Volume
- 6
- Issue
- 1
- Pages
- 30028-30028
- ISSN
- 2045-2322 (ISSN-L)
- PMC
- PMC4956742
- OpenAlex
- W2479642761
- Cited by
- 655
- References
- 56
- Citations by year
- 2026: 40 · 2025: 63 · 2024: 76 · 2023: 66 · 2022: 102 · 2021: 89 · 2020: 74 · 2019: 59 · 2018: 47 · 2017: 33 · 2016: 6
- FWCI
- 38.90
- Type
- journal article
- Language
- en
- Open access
- gold
- doi.org
- Locations
- Scientific Reports (publishedVersion, cc-by)
- PubMed Central (publishedVersion, cc-by)
- PubMed (publishedVersion)
- Digital Commons@Becker (Washington University School of Medicine) (submittedVersion)
- Funders
- University of Chicago (DK42086)
- Cure Alzheimer's Fund
- National Institute of Diabetes and Digestive and Kidney Diseases (DK42086, P30DK042086)
- Argonne National Laboratory
- Topics
- Life Sciences › Neuroscience › Cellular and Molecular Neuroscience › Alzheimer's disease research and treatments
- Life Sciences › Biochemistry, Genetics and Molecular Biology › Molecular Biology › Gut microbiota and health
- Life Sciences › Neuroscience › Neurology › Neuroinflammation and Neurodegeneration Mechanisms
- Keywords
- Alzheimer's disease, gut microbiota, antibiotic-induced dysbiosis, amyloid plaques, neuroinflammation, APPswe/PS1ΔE9 mice, soluble amyloid-beta, microglial morphology, glial activation, innate immunity, cytokines and chemokines, gut-brain axis
- MeSH terms
- Gastrointestinal Microbiome, Alzheimer Disease, Amyloidosis, Animals, Anti-Bacterial Agents, Disease Models, Animal, Immunity, Innate, Inflammation, Mice, Dysbiosis
About these checks
Registry, retraction, Cites and statistics results are computed, not judged, with one exception: a printed reference that no index lists is read once by a model before it counts as a citation error. Claims are extracted by a model and kept only when their quote appears verbatim in the text; each cited source is then checked, with a model’s help, for whether it says what the claim relies on. Those verdicts can be wrong — read the claim’s quote and the cited source before relying on one.
Statistics and arithmetic are recomputed, not judged.
Confidence bands are shown only for fields calibrated on our annotated test set. None is calibrated yet, so no band is shown.
What counts as a claim ›How we measure confidence ›How we check this ›
Are you an author, or do you see a problem with this page? Request a review
