

The DOI matches its Crossref record; 1 of the 1 references it cites were found in a registry or an index.
Proposal for a tiered dietary bioaccumulation testing strategy for engineered nanomaterials using fish
Abstract
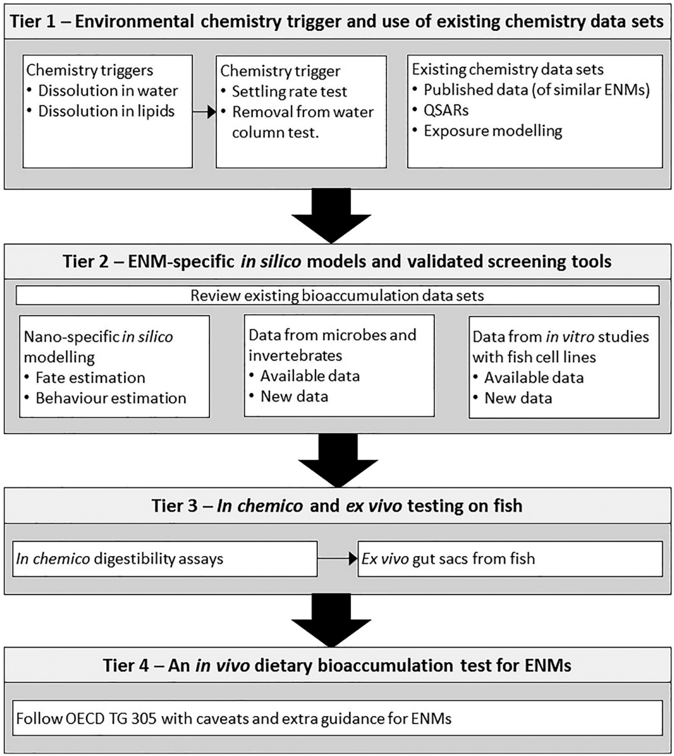
The scientific community has invested effort into standardising methodologies for the regulatory ecotoxicity testing of engineered nanomaterials (ENMs), but the practical requirements for bioaccumulation testing of ENMs have been given less attention.
Overview
The claims and statistics of this paper haven’t been checked yet.
Run the check — free, no account needed. It reads the open-access text and checks the sources it cites.
Integrity signals
Registry
Cites
Statistics
Figures
Verification
Claims the paper makes
The claims and statistics of this paper haven’t been checked yet.
Run the check — free, no account needed. It reads the open-access text and checks the sources it cites.
Claims other papers make about this one
Each is checked against this paper’s own text: does it say what the citing paper says it does?
In the citing paper
“Notably, agreement has yet to be reached on bioaccumulation tests for NPs [259].”
From Particle toxicology and health - where are we? (2019) · cites this paper as [259]
Self-check
Percentages, sums and reported differences re-computed from the paper’s own numbers.
The self-check needs the paper’s full text.
Citations
Cites
Manufactured nanoparticles: their uptake and effects on fish—a mechanistic analysis
Handy, R. D., Henry, T. B., Scown, T. M., Johnston, B. D., & Tyler, C. R. (2008) · Ecotoxicology · doi:10.1007/s10646-008-0205-1 · Cited by 447
Self-citation
Research works printed but not linked: 84
- Strempel, 2012, Environ. Sci. Technol., 46, 5680, 10.1021/es3002713 · DOI · Paper page
- Klaine, 2008, Environ. Toxicol. Chem., 27, 1825, 10.1897/08-090.1 · DOI
- Lowry, 2012, Environ. Sci. Technol., 46, 6893, 10.1021/es300839e · DOI
- Peijnenburg, 2015, Crit. Rev. Environ. Sci. Technol., 45, 2084, 10.1080/10643389.2015.1010430 · DOI
- Kahru, 2010, Toxicology, 269, 105, 10.1016/j.tox.2009.08.016 · DOI
- Klaine, 2012, Environ. Toxicol. Chem., 31, 3, 10.1002/etc.733 · DOI
- Schultz, 2014, Environ. Chem., 11, 207, 10.1071/EN13221 · DOI
- R. D. Handy and F. B.Eddy , in Physicochemical Kinetics and Transport at Chemical-Biological Interphases , ed. H. P. V. L. W. Köster , John Wiley , Chichester , 2004 , pp. 337–356
- Shaw, 2011, Environ. Int., 37, 1083, 10.1016/j.envint.2011.03.009 · DOI
- Al-Jubory, 2013, Nanotoxicology, 7, 1282, 10.3109/17435390.2012.735268 · DOI
- Shaw, 2012, Aquat. Toxicol., 116, 90, 10.1016/j.aquatox.2012.02.032 · DOI
- Khan, 2012, Environ. Sci. Technol., 46, 7621, 10.1021/es301253s · DOI
- Wang, 2013, Environ. Sci. Technol., 47, 10601, 10.1021/es4017188 · DOI
- Felix, 2013, Environ. Sci. Technol., 47, 6589, 10.1021/es401403p · DOI
- Bjorkland, 2017, Environ. Sci.: Nano, 4, 747
- Veith, 1979, J. Fish. Res. Board Can., 36, 1040, 10.1139/f79-146 · DOI
- Handy, 2012, Environ. Toxicol. Chem., 31, 15, 10.1002/etc.706 · DOI
- Law, 2006, Environ. Toxicol. Chem., 25, 1757, 10.1897/05-445R.1 · DOI
- Barber, 2008, Environ. Toxicol. Chem., 27, 755, 10.1897/07-462.1 · DOI
- Arnot, 2015, Environ. Sci. Technol., 49, 4783, 10.1021/es506251q · DOI
- OECD , Bioaccumulation in fish: aqueous and dietary exposure. OECD guidelines for testing of chemicals. Technical Guidance (TG) 305 , Organisation for Economic Cooperation and Development (OECD) Publishing , Paris, France , Available at: 10.1787/9789264185296-en , 2012 · DOI
- Handy, 2008, Ecotoxicology, 17, 287, 10.1007/s10646-008-0199-8 · DOI
- Felix, 2017, Aquat. Toxicol., 192, 58, 10.1016/j.aquatox.2017.09.008 · DOI
- Gitrowski, 2014, Toxicol. Lett., 226, 264, 10.1016/j.toxlet.2014.02.014 · DOI · Paper page
- Ferry, 2009, Nat. Nanotechnol., 4, 441, 10.1038/nnano.2009.157 · DOI
- Skjolding, 2014, Aquat. Toxicol., 157, 101, 10.1016/j.aquatox.2014.10.005 · DOI
- Croteau, 2011, Nanotoxicology, 5, 79, 10.3109/17435390.2010.501914 · DOI
- Clearwater, 2002, Comp. Biochem. Physiol., Part C: Toxicol. Pharmacol., 132, 269, 10.1016/S1096-4959(01)00539-5 · DOI
- R. D. Handy , J. C.McGeer , H. E.Allen , P. E.Drevnick , J. W.Gorsuch , A. S.Green , A.-K.Lundebye-Haldorsen , S. E.Hook , D. R.Mount and W. A.Stubblefield , in Toxicity of Dietborne Metals to Aquatic Organisms , ed. J. S. Meyer , W. J. Adams , K. V. Brix , S. N. Luoma , D. R. Mount , W. A. Stubblefield and C. M. Wood , SETAC Press Pensacola , USA , 2005 , pp. 59–112
- Fisk, 1998, Environ. Toxicol. Chem., 17, 951, 10.1002/etc.5620170526 · DOI
- Ramsden, 2009, Ecotoxicology, 18, 939, 10.1007/s10646-009-0357-7 · DOI
- Fraser, 2011, Nanotoxicology, 5, 98, 10.3109/17435390.2010.502978 · DOI
- Arts, 2015, Regul. Toxicol. Pharmacol., 71, S1, 10.1016/j.yrtph.2015.03.007 · DOI
- Oomen, 2015, Int. J. Environ. Res. Public Health, 12, 13415, 10.3390/ijerph121013415 · DOI
- K. Sellers , N. M.Deleebeeck , M.Messiean , M.Jackson , E. A. J.Bleeker , D. T. H. M.Sijm and F. A.Van Broekhuizen , Grouping nanomaterials: A strategy towards grouping and read-across. Rijksinstituut voor Volksgezondheid en Milieu RIVM. , 2015
- Walser, 2015, Regul. Toxicol. Pharmacol., 72, 569, 10.1016/j.yrtph.2015.05.031 · DOI
- Hristovski, 2011, J. Environ. Sci. Health, Part A: Toxic/Hazard. Subst. Environ. Eng., 46, 636, 10.1080/10934529.2011.562859 · DOI
- Ottofülling, 2011, Environ. Sci. Technol., 45, 10045, 10.1021/es2023225 · DOI
- Praetorius, 2014, Environ. Sci. Technol., 48, 10690, 10.1021/es501655v · DOI
- OECD , Dispersion Stability of Nanomaterials in Simulated Environmental Media. OECD guidelines for testing of chemicals. Technical Guidance (TG) 318 , Organisation for Economic Cooperation and Development (OECD) Publishing , Paris, France , Available at: 10.1787/9789264284142-en , 2017 · DOI
- OECD , Test No. 107: Partition Coefficient (n-octanol/water): Shake Flask Method , 1995 · DOI
- Fernández-Cruz, 2018, Environ. Sci.: Nano, 5, 381
- Landsiedel, 2016, Environ. Pollut., 218, 1376, 10.1016/j.envpol.2015.10.060 · DOI
- A. Worth , K.Aschberger , D.Asturiol Bofill , J.Bessems , K.Gerloff , R.Graepel , E.Joossens , L.Lamon , T.Palosaari and A.Richarz , Evaluation of the availability and applicability of computational approaches in the safety assessment of nanomaterials , EUR 28617 EN, Publications Office of the European Union , Luxembourg , 2017, ISBN 978-92-79-68708-2, 10.2760/248139 , JRC106386, 2017 · DOI
- Toropova, 2015, Mini-Rev. Med. Chem., 15, 608, 10.2174/1389557515666150219121652 · DOI
- Wang, 2015, Q. Rev. Biophys., 48, 488, 10.1017/S0033583515000190 · DOI
- Ambure, 2015, Chemom. Intell. Lab. Syst., 147, 1, 10.1016/j.chemolab.2015.07.007 · DOI
- Chen, 2017, Int. J. Mol. Sci., 18, 1504, 10.3390/ijms18071504 · DOI
- Gottschalk, 2013, Environ. Pollut., 181, 287, 10.1016/j.envpol.2013.06.003 · DOI · Paper page
- Sun, 2017, Environ. Sci. Technol., 51, 2854, 10.1021/acs.est.6b05702 · DOI
- Winkler, 2016, Toxicol. Appl. Pharmacol., 299, 96, 10.1016/j.taap.2015.12.016 · DOI
- Costa, 2016, Toxicol. Appl. Pharmacol., 299, 101, 10.1016/j.taap.2015.12.014 · DOI
- Crane, 2008, Ecotoxicology, 17, 421, 10.1007/s10646-008-0215-z · DOI
- Bourgeault, 2015, Environ. Sci. Technol., 49, 2451, 10.1021/es504638f · DOI
- Dalai, 2014, Aquat. Toxicol., 152, 139, 10.1016/j.aquatox.2014.04.002 · DOI
- Hernando, 2012, Anal. Bioanal. Chem., 404, 2749, 10.1007/s00216-012-6256-4 · DOI
- Geppert, 2016, Environ. Sci.: Nano, 3, 388
- Yue, 2015, Nanotoxicology, 9, 54, 10.3109/17435390.2014.889236 · DOI
- Bermejo-Nogales, 2017, Ecotoxicol. Environ. Saf., 138, 309, 10.1016/j.ecoenv.2016.12.039 · DOI
- Susewind, 2016, Nanotoxicology, 10, 53
- Oomen, 2002, Environ. Sci. Technol., 36, 3326, 10.1021/es010204v · DOI
- Denys, 2012, Environ. Sci. Technol., 46, 6252, 10.1021/es3006942 · DOI
- Wragg, 2011, Sci. Total Environ., 409, 4016
- Carter, 1999, Aquaculture, 179, 57, 10.1016/S0044-8486(99)00152-0 · DOI
- Rungruangsak-Torrissen, 2002, J. Sci. Food Agric., 82, 644, 10.1002/jsfa.1089 · DOI
- Tervonen, 2010, Environ. Toxicol. Chem., 29, 1072, 10.1002/etc.124 · DOI
- Hopson, 1963, J. Anim. Sci., 22, 448, 10.2527/jas1963.222448x · DOI
- Ong, 2014, PLoS One, 9, e90650, 10.1371/journal.pone.0090650 · DOI
- San, 2011, Angew. Chem., 123, 12130, 10.1002/ange.201101833 · DOI
- Besinis, 2014, Nanotoxicology, 8, 1, 10.3109/17435390.2012.742935 · DOI
- Shaw, 2013, Chemosphere, 92, 1136, 10.1016/j.chemosphere.2013.01.065 · DOI
- Hoyle, 2005, Aquat. Toxicol., 72, 147, 10.1016/j.aquatox.2004.11.015 · DOI
- Handy, 2000, J. Exp. Biol., 203, 2365, 10.1242/jeb.203.15.2365 · DOI
- Clark, 1995, Toxicol. Lett., 81, 33, 10.1016/0378-4274(95)03400-5 · DOI
- Connolly, 2016, Sci. Total Environ., 551, 334, 10.1016/j.scitotenv.2016.01.186 · DOI
- Andersen, 1996, Aquacult. Nutr., 2, 41, 10.1111/j.1365-2095.1996.tb00006.x · DOI
- Vielma, 1998, Aquaculture, 160, 117, 10.1016/S0044-8486(97)00300-1 · DOI
- Davies, 2006, Aquacult. Nutr., 12, 451, 10.1111/j.1365-2095.2006.00448.x · DOI
- Petersen, 2009, Environ. Sci. Technol., 43, 2969, 10.1021/es8029363 · DOI
- Shaw, 2006, Aquat. Toxicol., 76, 111, 10.1016/j.aquatox.2005.10.002 · DOI
- Baker, 1998, Mar. Environ. Res., 45, 357, 10.1016/S0141-1136(98)00098-1 · DOI
- Gray, 2013, Environ. Sci. Technol., 47, 14315, 10.1021/es403558c · DOI
- Lee, 2014, Environ. Sci. Technol., 48, 10291, 10.1021/es502422v · DOI
- Al-Bairuty, 2013, Aquat. Toxicol., 126, 104, 10.1016/j.aquatox.2012.10.005 · DOI
Cited by
Sorted by citations
Particle toxicology and health - where are we?
Riediker, M., Zink, D., Kreyling, W., Oberdörster, G., Elder, A., Graham, U., Lynch, I., Duschl, A., Ichihara, G., Ichihara, S., et al. (2019) · Particle and Fibre Toxicology · doi:10.1186/s12989-019-0302-8 · Cited by 237
Self-citation
Metadata
- Authors
- Handy, R. D., Ahtiainen, J., Navas, J. M., Goss, G., Bleeker, E. A. J., & von der Kammer, F.
- Venue
- Environmental Science: Nano
- Publisher
- Royal Society of Chemistry (RSC)
- Published
- 2018
- Volume
- 5
- Issue
- 9
- Pages
- 2030-2046
- ISSN
- 2051-8153
- 2051-8161
- Cited by
- 18
- References
- 1
- Language
- en
About these checks
Registry, retraction, Cites and statistics results are computed, not judged, with one exception: a printed reference that no index lists is read once by a model before it counts as a citation error. Claims are extracted by a model and kept only when their quote appears verbatim in the text; each cited source is then checked, with a model’s help, for whether it says what the claim relies on. Those verdicts can be wrong — read the claim’s quote and the cited source before relying on one.
Statistics and arithmetic are recomputed, not judged.
Confidence bands are shown only for fields calibrated on our annotated test set. None is calibrated yet, so no band is shown.
What counts as a claim ›How we measure confidence ›How we check this ›
Are you an author, or do you see a problem with this page? Request a review
How to cite
Cite CoChat for the checks on this page, and the paper for its own findings.
- This page
- CoChat. (2026). Citation check: Proposal for a tiered dietary bioaccumulation testing strategy for engineered nanomaterials using fish. https://app.cochat.ai/papers/10.1039/c7en01139c
- The paper
- Handy, R. D., Ahtiainen, J., Navas, J. M., Goss, G., Bleeker, E. A. J., & von der Kammer, F. (2018). Proposal for a tiered dietary bioaccumulation testing strategy for engineered nanomaterials using fish. Environmental Science: Nano. https://doi.org/10.1039/c7en01139c
