Student or educator? Sign up with your school email and get 6 months of Pro free.
Cited by 30

The DOI matches its Crossref record; 50 of the 50 references it cites were found in a registry or an index.

C-terminal low-complexity sequence repeats of Mycobacterium smegmatis Ku modulate DNA binding

Kushwaha, Ambuj K., Grove, Anne·2013·Bioscience Reports

Abstract

Ku protein is an integral component of the NHEJ (non-homologous end-joining) pathway of DSB (double-strand break) repair. Both eukaryotic and prokaryotic Ku homologues have been characterized and shown to bind DNA ends. A unique feature of Mycobacterium smegmatis Ku is its basic C-terminal tail that contains several lysine-rich low-complexity PAKKA repeats that are absent from homologues encoded by obligate parasitic mycobacteria. Such PAKKA repeats are also characteristic of mycobacterial Hlp (histone-like protein) for which they have been shown to confer the ability to appose DNA ends. Unexpectedly, removal of the lysine-rich extension enhances DNA-binding affinity, but an interaction between DNA and the PAKKA repeats is indicated by the observation that only full-length Ku forms multiple complexes with a short stem-loop-containing DNA previously designed to accommodate only one Ku dimer. The C-terminal extension promotes DNA end-joining by T4 DNA ligase, suggesting that the PAKKA repeats also contribute to efficient end-joining. We suggest that low-complexity lysine-rich sequences have evolved repeatedly to modulate the function of unrelated DNA-binding proteins.

Overview

The claims and statistics of this paper haven’t been checked yet.

Run the check — free, no account needed. It reads the open-access text and checks the sources it cites.

A few free checks a day · papers already verified open instantly · results are public

Integrity signals

Registry

Crossref · 10.1042/bsr20120105

Cites

50 of 50 references verified0 citation errors · 0 not checkable

Statistics

Figures

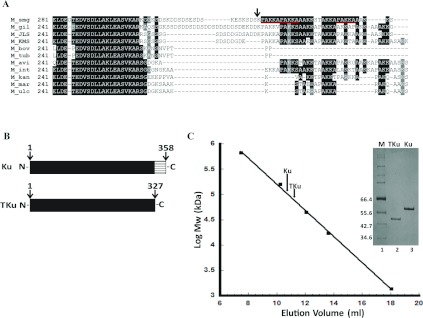
Figure 1 Ku protein from M. smegmatis (A) Sequence alignment of the C-terminal protein sequence of various mycobacterial Ku homologues. Low complexity PAKKA repeats of M. smegmatis Ku protein are underlined in red. M_smg, M. smegmatis; M_gil, M. gilvum; M_JLS, Mycobacterium sp. JLS; M_KMS, Mycobacterium sp. KMS; M_bov, M. bovis; M_tub, M. tuberculosis; M_avi, M. avium; M_int, M. intracellulare; M_kan, M. kansasii; M_mar, M. marinum; M_ulc, M. ulcerans. The site of truncation is marked with an arrow. (B) Schematic representation of the N-terminal domain (solid box) and the lysine rich C-terminal tail. Mutant protein lacking C-terminal PAKKA repeats is TKu. (C) Gel filtration analysis of Ku and TKu. Linear calibration curve represents the logarithm of molecular mass as a function of elution volume. The elution volumes of dimeric Ku and TKu are indicated by arrows. Inset: Coomassie Brilliant Blue-stained SDS/PAGE gel (12% gel) showing purified proteins. Lane 1, molecular-mass markers in kDa; lanes 2–3, purified TKu and Ku, respectively.
Figure 1 Ku protein from M. smegmatis (A) Sequence alignment of the C-terminal protein sequence of various mycobacterial Ku homologues. Low complexity PAKKA repeats of M. smegmatis Ku protein are underlined in red. M_smg, M. smegmatis; M_gil, M. gilvum; M_JLS, Mycobacterium sp. JLS; M_KMS, Mycobacterium sp. KMS; M_bov, M. bovis; M_tub, M. tuberculosis; M_avi, M. avium; M_int, M. intracellulare; M_kan, M. kansasii; M_mar, M. marinum; M_ulc, M. ulcerans. The site of truncation is marked with an arrow. (B) Schematic representation of the N-terminal domain (solid box) and the lysine rich C-terminal tail. Mutant protein lacking C-terminal PAKKA repeats is TKu. (C) Gel filtration analysis of Ku and TKu. Linear calibration curve represents the logarithm of molecular mass as a function of elution volume. The elution volumes of dimeric Ku and TKu are indicated by arrows. Inset: Coomassie Brilliant Blue-stained SDS/PAGE gel (12% gel) showing purified proteins. Lane 1, molecular-mass markers in kDa; lanes 2–3, purified TKu and Ku, respectively.CC BY-NC · PubMed Central
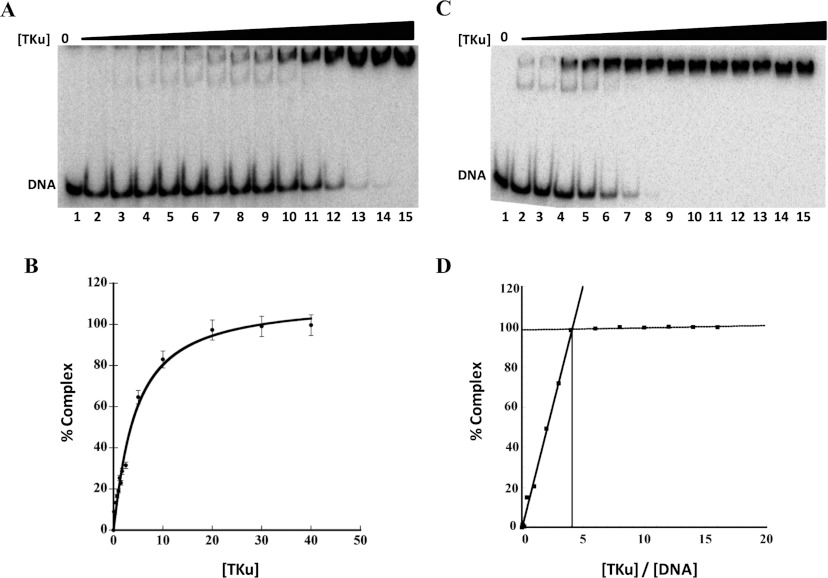
Figure 2 Binding affinity and stoichiometry determination of TKu (A) Titration of TKu with 36 bp DNA in reaction mixture containing 300 mM NaCl and [DNA]<Kd. Lane 1, 36 bp DNA (0.5 nM) only; lanes 2–15, 36 bp DNA titrated with increasing concentrations (0.1–40 nM) of TKu. (B) Binding isotherm for TKu binding to 36 bp DNA. The best fit to the data were obtained using the Hill equation (R2=0.9883 and n=1.1±0.1). Error bars represent S.D. (C) Titration of TKu with 36 bp DNA in a reaction mixture containing 50 mM NaCl and [DNA]> Kd (stoichiometric conditions). Lane 1, 36 bp (5 nM) only; lanes 2–15, 36 bp titrated with increasing concentrations (1–120 nM) of TKu. (D) TKu-36 bp DNA binding stoichiometry plot. Percentage complex plotted against the ratio of TKu and 36 bp DNA concentrations. Gels contained 8% acrylamide.
Figure 2 Binding affinity and stoichiometry determination of TKu (A) Titration of TKu with 36 bp DNA in reaction mixture containing 300 mM NaCl and [DNA]<Kd. Lane 1, 36 bp DNA (0.5 nM) only; lanes 2–15, 36 bp DNA titrated with increasing concentrations (0.1–40 nM) of TKu. (B) Binding isotherm for TKu binding to 36 bp DNA. The best fit to the data were obtained using the Hill equation (R2=0.9883 and n=1.1±0.1). Error bars represent S.D. (C) Titration of TKu with 36 bp DNA in a reaction mixture containing 50 mM NaCl and [DNA]> Kd (stoichiometric conditions). Lane 1, 36 bp (5 nM) only; lanes 2–15, 36 bp titrated with increasing concentrations (1–120 nM) of TKu. (D) TKu-36 bp DNA binding stoichiometry plot. Percentage complex plotted against the ratio of TKu and 36 bp DNA concentrations. Gels contained 8% acrylamide.CC BY-NC · PubMed Central
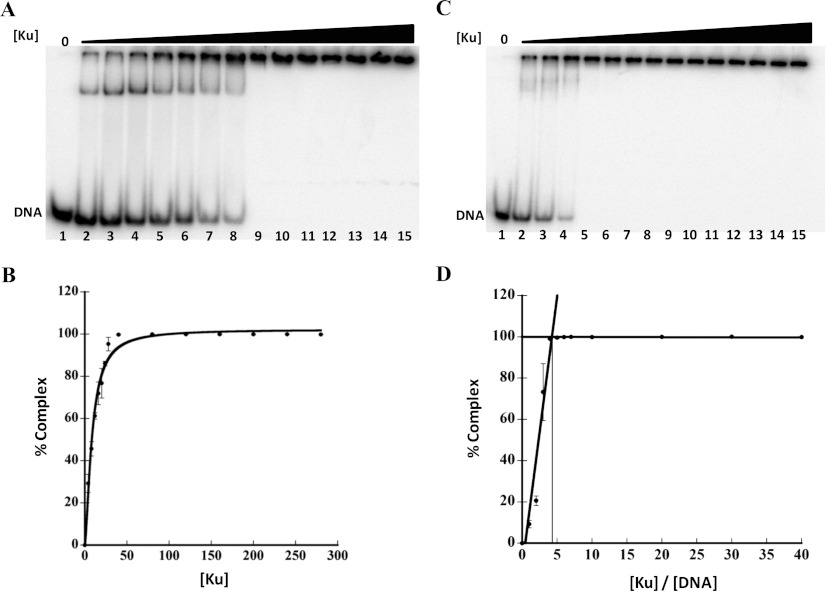
Figure 3 Binding affinity and stoichiometry determination of Ku (A) Titration of Ku with 37 bp DNA in a reaction mixture containing 50 mM NaCl and [DNA]<Kd. Lane 1, 37 bp DNA (5 nM) only; lanes 2–15, 37 bp DNA titrated with increasing concentrations (4–800 nM) of Ku. (B) Binding isotherm for Ku binding to 37 bp DNA. The best fit to the data were obtained using the Hill equation (R2=0.9878 and n=1.6±0.1). Error bars represent S.D. (C) Titration of Ku with 37 bp DNA in a reaction mixture containing 50 mM NaCl and [DNA]> Kd (stoichiometric conditions). Lane 1, 37 bp (40 nM) only; lanes 2–15, 37 bp titrated with increasing concentrations (40–2800 nM) of Ku. (D) Ku-37 bp DNA binding stoichiometry plot. Percent complex plotted against the ratio of Ku and 37 bp DNA concentrations. Gels contained 8% acrylamide.
Figure 3 Binding affinity and stoichiometry determination of Ku (A) Titration of Ku with 37 bp DNA in a reaction mixture containing 50 mM NaCl and [DNA]<Kd. Lane 1, 37 bp DNA (5 nM) only; lanes 2–15, 37 bp DNA titrated with increasing concentrations (4–800 nM) of Ku. (B) Binding isotherm for Ku binding to 37 bp DNA. The best fit to the data were obtained using the Hill equation (R2=0.9878 and n=1.6±0.1). Error bars represent S.D. (C) Titration of Ku with 37 bp DNA in a reaction mixture containing 50 mM NaCl and [DNA]> Kd (stoichiometric conditions). Lane 1, 37 bp (40 nM) only; lanes 2–15, 37 bp titrated with increasing concentrations (40–2800 nM) of Ku. (D) Ku-37 bp DNA binding stoichiometry plot. Percent complex plotted against the ratio of Ku and 37 bp DNA concentrations. Gels contained 8% acrylamide.CC BY-NC · PubMed Central
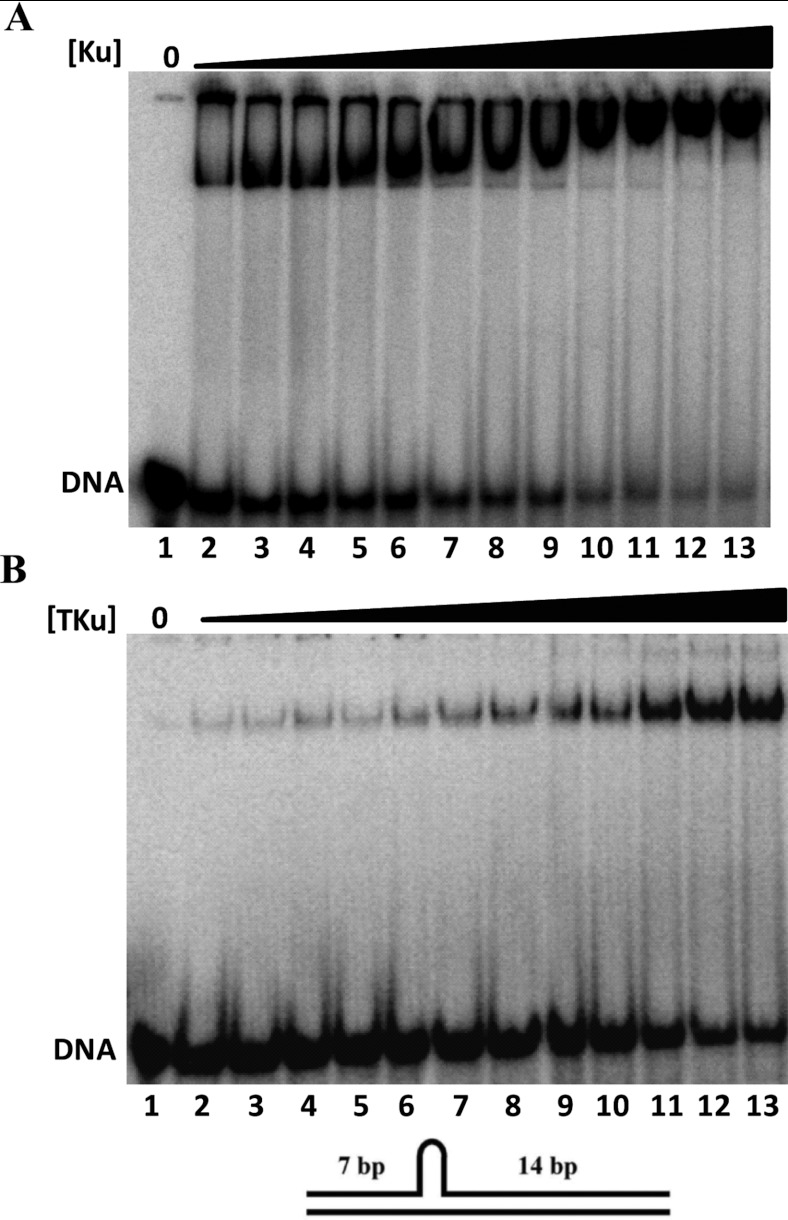
Figure 4 Electrophoretic analysis of 21/34 nt hairpin DNA (A) EMSA of 21/34 nt hairpin DNA with Ku. Lane 1, 21/34 bp hairpin DNA (5 nM) only; lanes 2–13, DNA titrated with increasing concentrations (4–200 nM) of Ku. (B) EMSA of 21/34 nt hairpin DNA with TKu. Lane 1, 21/34 nt hairpin DNA (5 nM) only; lanes 2–13, DNA titrated with increasing concentrations (1–40 nM) of TKu. Reaction mixture for both Ku and TKu contained 50 mM NaCl. In the cartoon 7 and 14 bp duplex region of 21/34 nt hairpin DNA is shown.
Figure 4 Electrophoretic analysis of 21/34 nt hairpin DNA (A) EMSA of 21/34 nt hairpin DNA with Ku. Lane 1, 21/34 bp hairpin DNA (5 nM) only; lanes 2–13, DNA titrated with increasing concentrations (4–200 nM) of Ku. (B) EMSA of 21/34 nt hairpin DNA with TKu. Lane 1, 21/34 nt hairpin DNA (5 nM) only; lanes 2–13, DNA titrated with increasing concentrations (1–40 nM) of TKu. Reaction mixture for both Ku and TKu contained 50 mM NaCl. In the cartoon 7 and 14 bp duplex region of 21/34 nt hairpin DNA is shown.CC BY-NC · PubMed Central
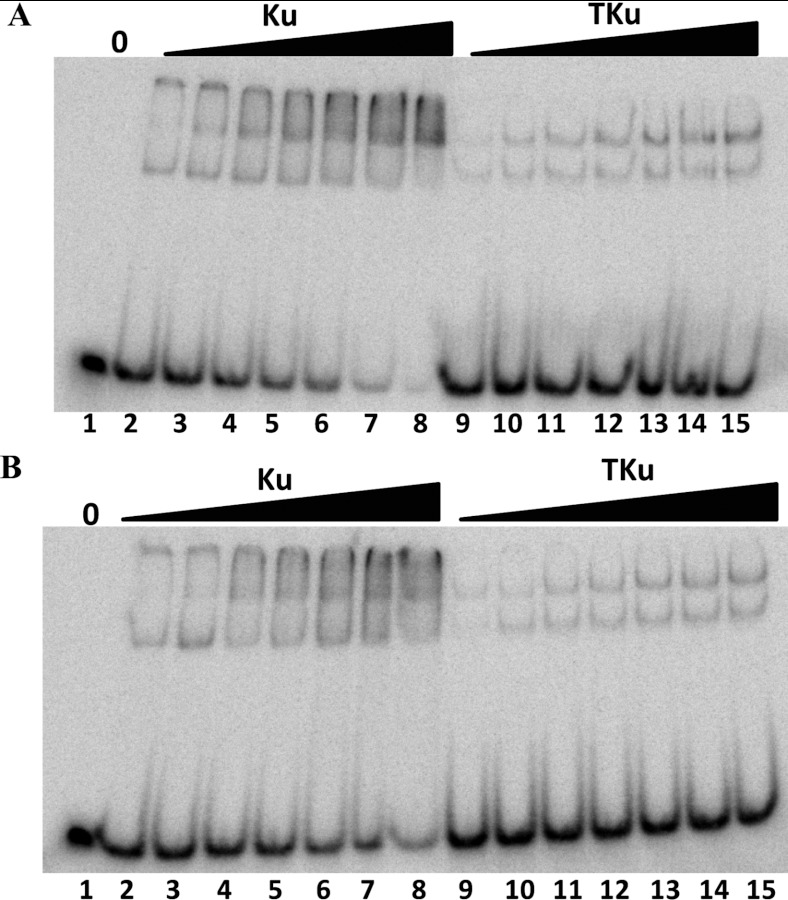
Figure 5 Electrophoretic analysis on a 6% polyacrylamide gel (A) Equimolar concentrations of 32P-labelled and non-radioactive 37 bp DNA (5 fmoles each) titrated with Ku and TKu. Lane 1, 32P-labelled and non-radioactive 37 bp DNA (5 fmoles each); lanes 2–8, 32P-labelled and non-radioactive 37 bp DNA with increasing concentrations (4–28 nM) of Ku; lanes 9–15, 32P-labelled and non-radioactive 37 bp DNA with increasing concentrations (4–28 nM) of TKu. (B) Equimolar mixed concentrations of 32P-labelled 37 bp and non-radioactive 50 bp DNA (5 fmoles each) titrated with Ku and TKu. Lane 1, 32P-labelled 37 bp and non-radioactive 50 bp DNA (5 fmoles each); lanes 2–8, 32P-labelled 37 bp and non-radioactive 50 bp DNA with increasing concentrations (4–28 nM) of Ku; lanes 9–15, 32P-labelled 37 bp and non-radioactive 50 bp DNA with increasing concentrations (4–28 nM) of TKu.
Figure 5 Electrophoretic analysis on a 6% polyacrylamide gel (A) Equimolar concentrations of 32P-labelled and non-radioactive 37 bp DNA (5 fmoles each) titrated with Ku and TKu. Lane 1, 32P-labelled and non-radioactive 37 bp DNA (5 fmoles each); lanes 2–8, 32P-labelled and non-radioactive 37 bp DNA with increasing concentrations (4–28 nM) of Ku; lanes 9–15, 32P-labelled and non-radioactive 37 bp DNA with increasing concentrations (4–28 nM) of TKu. (B) Equimolar mixed concentrations of 32P-labelled 37 bp and non-radioactive 50 bp DNA (5 fmoles each) titrated with Ku and TKu. Lane 1, 32P-labelled 37 bp and non-radioactive 50 bp DNA (5 fmoles each); lanes 2–8, 32P-labelled 37 bp and non-radioactive 50 bp DNA with increasing concentrations (4–28 nM) of Ku; lanes 9–15, 32P-labelled 37 bp and non-radioactive 50 bp DNA with increasing concentrations (4–28 nM) of TKu.CC BY-NC · PubMed Central
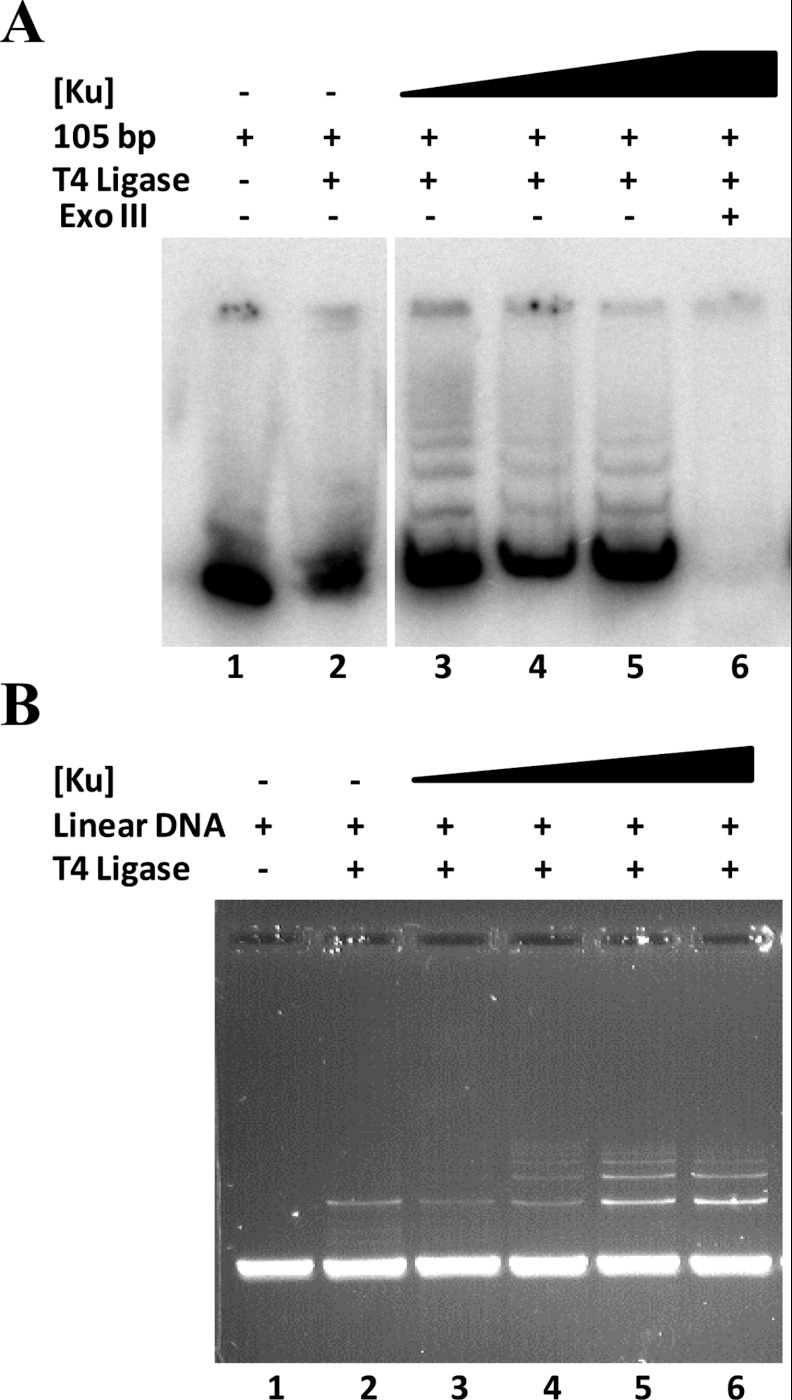
Figure 6 End-joining assay with Ku (A) Lane 1, 5 nM 105 bp DNA only; lane 2, DNA and T4 DNA ligase (40 units/μl); lanes 3–5, DNA, T4 DNA ligase with increasing concentrations (25, 200, 300, 400 nM) of Ku; lane 6, DNA, T4 DNA ligase, Ku (400 nM) and exonuclease III. The space between lanes 2 and 3 reflects that lanes were removed to create the figure. (B) Lane 1, 50 ng of linear pUC18 DNA only; lane 2, DNA and T4 DNA ligase; lanes 3–6, DNA, T4 DNA ligase with increasing concentrations (200, 400, 600, 800 nM) of Ku.
Figure 6 End-joining assay with Ku (A) Lane 1, 5 nM 105 bp DNA only; lane 2, DNA and T4 DNA ligase (40 units/μl); lanes 3–5, DNA, T4 DNA ligase with increasing concentrations (25, 200, 300, 400 nM) of Ku; lane 6, DNA, T4 DNA ligase, Ku (400 nM) and exonuclease III. The space between lanes 2 and 3 reflects that lanes were removed to create the figure. (B) Lane 1, 50 ng of linear pUC18 DNA only; lane 2, DNA and T4 DNA ligase; lanes 3–6, DNA, T4 DNA ligase with increasing concentrations (200, 400, 600, 800 nM) of Ku.CC BY-NC · PubMed Central
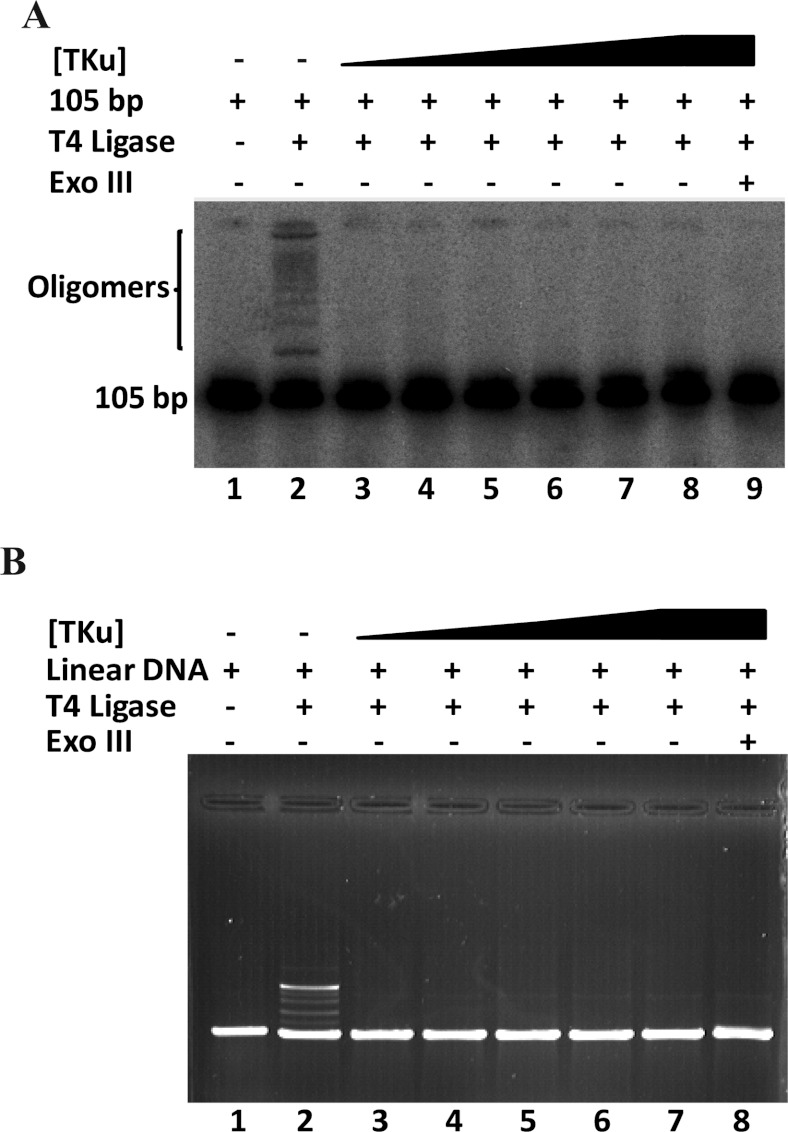
Figure 7 End-joining assay with TKu (A) Lane 1, 5 nM of 105 bp DNA; lane 2, 105 bp DNA and T4 DNA ligase (80 units/μl); lanes 3–8, 105 bp DNA, and T4 DNA ligase with increasing concentrations (200, 400, 600, 800, 1000, 1200 nM) of TKu; lane 9, 105 bp DNA, T4 DNA ligase, TKu (1200 nM) and exonuclease III. Note that a higher concentration of ligase is used compared with experiment in Figure 6 to obtain ligation products in absence of protein. (B) Lane 1, 50 ng of linear pUC18 DNA only; lane 2, DNA and T4 DNA ligase; lanes 3–7, DNA, T4 DNA ligase with increasing concentrations (100, 200, 300, 400, 600 nM) of Ku; lane 8, DNA, T4 DNA ligase, TKu (600 nM) and exonuclease III.
Figure 7 End-joining assay with TKu (A) Lane 1, 5 nM of 105 bp DNA; lane 2, 105 bp DNA and T4 DNA ligase (80 units/μl); lanes 3–8, 105 bp DNA, and T4 DNA ligase with increasing concentrations (200, 400, 600, 800, 1000, 1200 nM) of TKu; lane 9, 105 bp DNA, T4 DNA ligase, TKu (1200 nM) and exonuclease III. Note that a higher concentration of ligase is used compared with experiment in Figure 6 to obtain ligation products in absence of protein. (B) Lane 1, 50 ng of linear pUC18 DNA only; lane 2, DNA and T4 DNA ligase; lanes 3–7, DNA, T4 DNA ligase with increasing concentrations (100, 200, 300, 400, 600 nM) of Ku; lane 8, DNA, T4 DNA ligase, TKu (600 nM) and exonuclease III.CC BY-NC · PubMed Central

Verification

Claims the paper makes

The claims and statistics of this paper haven’t been checked yet.

Run the check — free, no account needed. It reads the open-access text and checks the sources it cites.

A few free checks a day · papers already verified open instantly · results are public

Claims other papers make about this one

Each is checked against this paper’s own text: does it say what the citing paper says it does?

Self-check

Percentages, sums and reported differences re-computed from the paper’s own numbers.

The self-check needs the paper’s full text.

Citations

Cites

Show all 50 references

Cited by

See all 30

Metadata

Authors
Kushwaha, A. K., & Grove, A.
Affiliations
Department of Biological Sciences, Louisiana State University, Baton Rouge, LA 70803, U.S.A.
Venue
Bioscience Reports
Published
2013-01-24
Volume
33
Issue
1
ISSN
  • 0144-8463
  • 1573-4935
Cited by
30
References
50
Language
en

About these checks

Registry, retraction, Cites and statistics results are computed, not judged, with one exception: a printed reference that no index lists is read once by a model before it counts as a citation error. Claims are extracted by a model and kept only when their quote appears verbatim in the text; each cited source is then checked, with a model’s help, for whether it says what the claim relies on. Those verdicts can be wrong — read the claim’s quote and the cited source before relying on one.

Statistics and arithmetic are recomputed, not judged.

Confidence bands are shown only for fields calibrated on our annotated test set. None is calibrated yet, so no band is shown.

What counts as a claim ›How we measure confidence ›How we check this ›

Are you an author, or do you see a problem with this page? Request a review

How to cite

Cite CoChat for the checks on this page, and the paper for its own findings.

This page
CoChat. (2026). Citation check: C-terminal low-complexity sequence repeats of Mycobacterium smegmatis Ku modulate DNA binding. https://app.cochat.ai/papers/10.1042/bsr20120105
The paper
Kushwaha, A. K., & Grove, A. (2013). C-terminal low-complexity sequence repeats of Mycobacterium smegmatis Ku modulate DNA binding. Bioscience Reports. https://doi.org/10.1042/bsr20120105

Data sources

Bibliographic data: Semantic Scholar, OpenAlex, Crossref.

Contains information from the Semantic Scholar Academic Graph Datasets, made available under the ODC Attribution License (ODC-BY 1.0).

Semantic Scholar’s data is described in: Kinney, R., et al. (2023). The Semantic Scholar Open Data Platform. arXiv:2301.10140.