Student or educator? Sign up with your school email and get 6 months of Pro free.
CoChat

The DOI matches its Crossref record; 84 of the 84 references it cites were found in a registry or an index.

Reliability of analog resistive switching memory for neuromorphic computing

Open access
Zhao, Meiran, Gao, Bin, Tang, Jianshi, Qian, He, Wu, Huaqiang · 2020 · Applied Physics Reviews

Abstract

As artificial intelligence calls for novel energy-efficient hardware, neuromorphic computing systems based on analog resistive switching memory (RSM) devices have drawn great attention recently. Different from the well-studied binary RSMs, the analog RSMs are featured by a continuous and controllable conductance-tuning ability and thus are capable of combining analog computing and data storage at the device level. Although significant research achievements on analog RSMs have been accomplished, there have been few works demonstrating large-scale neuromorphic systems. A major bottleneck lies in the reliability issues of the analog RSM, such as endurance and retention degradation and read/write noises and disturbances. Owing to the complexity of resistive switching mechanisms, studies on the origins of reliability degradation and the corresponding optimization methodology face many challenges. In this article, aiming on the high-performance neuromorphic computing applications, we provide a comprehensive review on the status of reliability studies of analog RSMs, the reliability requirements, and evaluation criteria and outlook for future reliability research directions in this field.

Overview

The claims and statistics of this paper haven’t been checked yet.

Free: it reads the open-access text and checks the first 5 claims that cite a source we can check. Create a free account to check every claim.

A few free checks a day · papers already verified open instantly · results are public

Integrity signals

Registry

Crossref · 10.1063/1.5124915

Cites

84 of 84 references verified0 citation errors · 0 not checkable

Statistics

Figures

Image 1
CC-BY · From the PDF
FIG. 1 Computing with the emerging analog-type RSM. (a) The structure and mechanism of filamentary RRAM. The rupture or connection of CFs represents the higher or lower resistance states, and multiple CFs contribute to the analog switching ability. (b) The structure and mechanism of nonfilamentary RRAM. The two insets illustrate the band diagrams of the interface in HRS (left) and LRS (right). (c) The structure and mechanism of PCM. The phase of the programmable region switches between the crystalline and amorphous states corresponding to the resistive switching between LRS and HRS, respectively.
FIG. 1 Computing with the emerging analog-type RSM. (a) The structure and mechanism of filamentary RRAM. The rupture or connection of CFs represents the higher or lower resistance states, and multiple CFs contribute to the analog switching ability. (b) The structure and mechanism of nonfilamentary RRAM. The two insets illustrate the band diagrams of the interface in HRS (left) and LRS (right). (c) The structure and mechanism of PCM. The phase of the programmable region switches between the crystalline and amorphous states corresponding to the resistive switching between LRS and HRS, respectively.CC-BY · From the PDF
FIG. 2 (a) Schematic diagram of a two-layer neural network. Each neuron computes a weighted sum of its inputs and applies a nonlinear activation function. (b) The schematic of an analog RSM crossbar array implementation of the most critical part of the perceptron, the weighted sum, where the conductance of analog RSM acts as the synaptic weight in a neuromorphic network.
FIG. 2 (a) Schematic diagram of a two-layer neural network. Each neuron computes a weighted sum of its inputs and applies a nonlinear activation function. (b) The schematic of an analog RSM crossbar array implementation of the most critical part of the perceptron, the weighted sum, where the conductance of analog RSM acts as the synaptic weight in a neuromorphic network.CC-BY · From the PDF
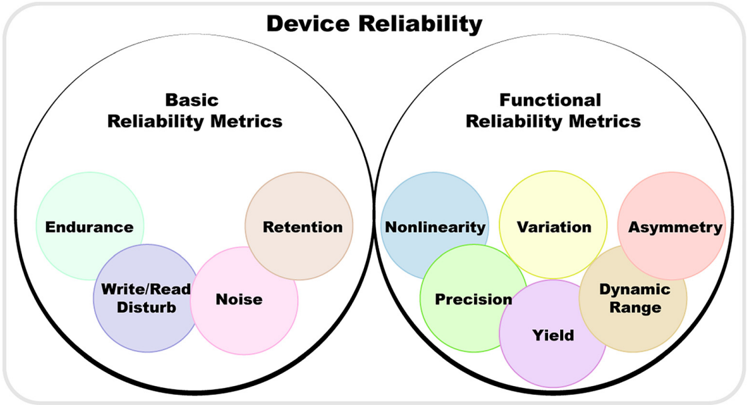
FIG. 3 Reliability metrics of the neuromorphic device. Device reliability metrics are classified into basic and functional reliability metrics, which degrade the accuracy during and after the training process.
FIG. 3 Reliability metrics of the neuromorphic device. Device reliability metrics are classified into basic and functional reliability metrics, which degrade the accuracy during and after the training process.CC-BY · From the PDF
FIG. 4 Schematic diagram of different basic reliability metrics of memory application for digital data storage and neuromorphic computing application for analog data processing and storage. (a) Window retention of digital memory and (b) conductance retention of analog data in the computing process. (c) Cycling endurance of digital memory and (d) incremental switching endurance of analog data in the computing process. (e) Write/read disturb in memory and (f) computing. (g) Noises in memory and (h) computing.
FIG. 4 Schematic diagram of different basic reliability metrics of memory application for digital data storage and neuromorphic computing application for analog data processing and storage. (a) Window retention of digital memory and (b) conductance retention of analog data in the computing process. (c) Cycling endurance of digital memory and (d) incremental switching endurance of analog data in the computing process. (e) Write/read disturb in memory and (f) computing. (g) Noises in memory and (h) computing.CC-BY · From the PDF
FIG. 5 Impact of basic reliability metrics on accuracy loss during MNIST image learning and recognition. (a) Schematic of the multilayer standard perceptron for recognizing images from the MNIST database, where the weights are implemented with the analog RSM array. (b) Impact of retention degradation on the recognition error rate. Reprinted with permission from Huang et al. , in IEEE International Electron Devices Meeting (IEDM) (2018), p. 40.4.1. Copyright 2018 IEEE. (c) On/off ratio decreased with the increasing weight update number due to endurance degradation. (d) The accuracy loss as a function of endurance cycle number. Reprinted with permission from Zhao et al. , in IEEE International Electron Devices Meeting (IEDM) (2018), p. 20.2.1. Copyright 2018 IEEE. (e) The impact of noise on accuracy loss in online and offline training. Reprinted with permission from Chen et al. , in IEEE International Electron Devices Meeting (IEDM) (2017), p. 6.1.1. Copyright 2017 IEEE.
FIG. 5 Impact of basic reliability metrics on accuracy loss during MNIST image learning and recognition. (a) Schematic of the multilayer standard perceptron for recognizing images from the MNIST database, where the weights are implemented with the analog RSM array. (b) Impact of retention degradation on the recognition error rate. Reprinted with permission from Huang et al. , in IEEE International Electron Devices Meeting (IEDM) (2018), p. 40.4.1. Copyright 2018 IEEE. (c) On/off ratio decreased with the increasing weight update number due to endurance degradation. (d) The accuracy loss as a function of endurance cycle number. Reprinted with permission from Zhao et al. , in IEEE International Electron Devices Meeting (IEDM) (2018), p. 20.2.1. Copyright 2018 IEEE. (e) The impact of noise on accuracy loss in online and offline training. Reprinted with permission from Chen et al. , in IEEE International Electron Devices Meeting (IEDM) (2017), p. 6.1.1. Copyright 2017 IEEE.CC-BY · From the PDF
FIG. 6 The characteristics and definition of the functional reliability metrics of analog RSMs and the impact of these metrics on neuromorphic computing. (a), (c), (e), (g), (i), and (k) Schematic diagram of the dynamic range, nonlinearity, asymmetry, precision, variation, and yield. (b) Simulated accuracy as a function of dynamic range. The D G reduction ratio refers to the proportion of the dynamic range reduction. The error bar represents the impact of dynamic range variation on accuracy. Reprinted with permission from Chen et al. , in IEEE International Reliability Physics Symposium (IRPS) (2018), p. 5C.4. Copyright 2018 IEEE. (d) Test accuracy as a function of different nonlinearity magnitudes of three realistic RRAM devices. Reprinted with permission from Chen et al. , in IEEE/ACM International Conference on Computer-Aided Design (ICCAD) (2015), p. 3-A.3.194. Copyright 2015 IEEE. (f) MNIST simulation accuracy as a function of switching asymmetry. Reprinted with permission from Tang et al. , in IEEE International Electron Devices Meeting (IEDM) (2018), p. 13.1.1. Copyright 2018 IEEE. (h) Simulated accuracy as a function of precision bits. Reprinted with permission from Liu et al. , in European Solid-State Device Research Conference (2017), p. A3L-F.18. Copyright 2017 IEEE. (j) Simulated accuracy loss due to pulse-to-pulse variation with several different nonlinearities during in situ training. Reprinted with permission from Chen et al. , IEEE International Electron Devices Meeting (IEDM) (2017), p. 6.1.1. Copyright 2017 IEEE. (l) Test accuracy as a function of stuck-on G rate and dead G rate after 20 epochs of training. Reprinted with permission from Romero et al. , Faraday Discuss. 213 (0), 371 (2019), Copyright 2019 RSC publishing.
FIG. 6 The characteristics and definition of the functional reliability metrics of analog RSMs and the impact of these metrics on neuromorphic computing. (a), (c), (e), (g), (i), and (k) Schematic diagram of the dynamic range, nonlinearity, asymmetry, precision, variation, and yield. (b) Simulated accuracy as a function of dynamic range. The D G reduction ratio refers to the proportion of the dynamic range reduction. The error bar represents the impact of dynamic range variation on accuracy. Reprinted with permission from Chen et al. , in IEEE International Reliability Physics Symposium (IRPS) (2018), p. 5C.4. Copyright 2018 IEEE. (d) Test accuracy as a function of different nonlinearity magnitudes of three realistic RRAM devices. Reprinted with permission from Chen et al. , in IEEE/ACM International Conference on Computer-Aided Design (ICCAD) (2015), p. 3-A.3.194. Copyright 2015 IEEE. (f) MNIST simulation accuracy as a function of switching asymmetry. Reprinted with permission from Tang et al. , in IEEE International Electron Devices Meeting (IEDM) (2018), p. 13.1.1. Copyright 2018 IEEE. (h) Simulated accuracy as a function of precision bits. Reprinted with permission from Liu et al. , in European Solid-State Device Research Conference (2017), p. A3L-F.18. Copyright 2017 IEEE. (j) Simulated accuracy loss due to pulse-to-pulse variation with several different nonlinearities during in situ training. Reprinted with permission from Chen et al. , IEEE International Electron Devices Meeting (IEDM) (2017), p. 6.1.1. Copyright 2017 IEEE. (l) Test accuracy as a function of stuck-on G rate and dead G rate after 20 epochs of training. Reprinted with permission from Romero et al. , Faraday Discuss. 213 (0), 371 (2019), Copyright 2019 RSC publishing.CC-BY · From the PDF
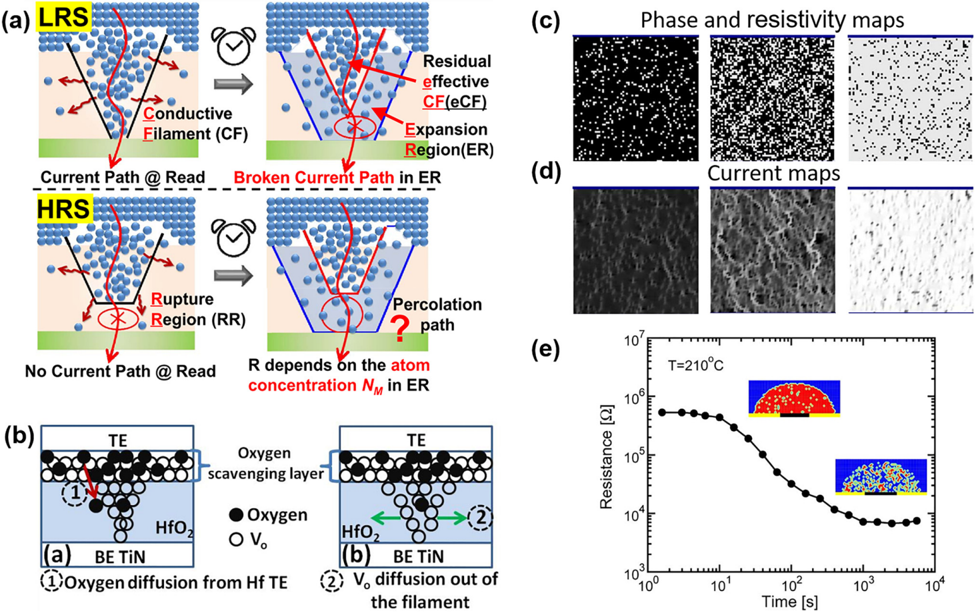
FIG. 7 Schematics of retention degradation. (a) Retention degradation process of cation-type RRAM. In LRS, the metal atoms in CF diffuse gradually toward the low atom concentration region with the increasing time, which may result in a broken current path in the expansion region. By contrast, diffusive atoms enter the rupture region (RR) corresponding to the increasing conductance (HRS). Reprinted with permission from Zhao et al. , IEEE Electron Device Lett. 40 , 647 (2019). Copyright 2019 IEEE. (b) Two possible retention degradation mechanisms in anion-type RRAM. Oxygen scavenged by the Hf cap layer diffuses back into HfO 2 and recombines with Vo in the filament; Vo diffusion out and dissolution of the filament. Reprinted with permission from Chen et al. , in IEEE International Electron Devices Meeting (IEDM) (2013), p. 10.1.1. Copyright 2013 IEEE. (c) and (d) Retention degradation process with the morphology change with the increasing time. (c) Simulation results of phase and resistive maps with different crystalline fractions. Light gray represents the crystalline elements, whereas the amorphous phase is in black. (d) Corresponding current maps with the morphology above. Lighter gray represents a higher current density. (e) Experimental results of resistance vs retention time at 210  C. The inset shows the mixed-phase structure of short (left) and long (right) baking times. Reprinted with permission from Russo et al. , IEEE Trans. Electron Devices 53 , 3032 (2006), Copyright 2006 IEEE.
FIG. 7 Schematics of retention degradation. (a) Retention degradation process of cation-type RRAM. In LRS, the metal atoms in CF diffuse gradually toward the low atom concentration region with the increasing time, which may result in a broken current path in the expansion region. By contrast, diffusive atoms enter the rupture region (RR) corresponding to the increasing conductance (HRS). Reprinted with permission from Zhao et al. , IEEE Electron Device Lett. 40 , 647 (2019). Copyright 2019 IEEE. (b) Two possible retention degradation mechanisms in anion-type RRAM. Oxygen scavenged by the Hf cap layer diffuses back into HfO 2 and recombines with Vo in the filament; Vo diffusion out and dissolution of the filament. Reprinted with permission from Chen et al. , in IEEE International Electron Devices Meeting (IEDM) (2013), p. 10.1.1. Copyright 2013 IEEE. (c) and (d) Retention degradation process with the morphology change with the increasing time. (c) Simulation results of phase and resistive maps with different crystalline fractions. Light gray represents the crystalline elements, whereas the amorphous phase is in black. (d) Corresponding current maps with the morphology above. Lighter gray represents a higher current density. (e) Experimental results of resistance vs retention time at 210  C. The inset shows the mixed-phase structure of short (left) and long (right) baking times. Reprinted with permission from Russo et al. , IEEE Trans. Electron Devices 53 , 3032 (2006), Copyright 2006 IEEE.CC-BY · From the PDF
FIG. 8 Physical mechanism of endurance degradation of RSM. (a) TEM image of Ta metal clusters formed after cycles. Reprinted with permission from Lee et al. , Nat. Mater. 10 , 625 (2011). Copyright 2011 Macmillan Publishers. (b)-(d) Schematic of the endurance failure mechanism of RRAM. Three failure types of endurance degradation are illustrated. Reprinted with permission from Chen et al. , in IEEE International Electron Devices Meeting (IEDM) (2011), p. 12.3.1. Copyright 2011 IEEE. (e) The endurance failure mechanism of PCM. Schematic of SET-stuck failure and RESET-stuck failure. Reprinted with permission from Tavana et al. , in Proceedings of the International Symposium on Memory Systems (2017), p. 385. Copyright 2017 ACM. SET-stuck failure includes two main failure modes: (f) EDX (energy-dispersive X-ray spectroscopy) images after 1000 cycles, Ge depletion. Reprinted with permission from Raoux et al. , Microelectron. Eng. 85 , 2330 (2008). Copyright 2008 Elsevier. (g) TEM image of undoped and doped GST. Reprinted with permission from Chen et al. , in IEEE International Memory Workshop (2009), p. 1. Copyright 2009 IEEE.
FIG. 8 Physical mechanism of endurance degradation of RSM. (a) TEM image of Ta metal clusters formed after cycles. Reprinted with permission from Lee et al. , Nat. Mater. 10 , 625 (2011). Copyright 2011 Macmillan Publishers. (b)-(d) Schematic of the endurance failure mechanism of RRAM. Three failure types of endurance degradation are illustrated. Reprinted with permission from Chen et al. , in IEEE International Electron Devices Meeting (IEDM) (2011), p. 12.3.1. Copyright 2011 IEEE. (e) The endurance failure mechanism of PCM. Schematic of SET-stuck failure and RESET-stuck failure. Reprinted with permission from Tavana et al. , in Proceedings of the International Symposium on Memory Systems (2017), p. 385. Copyright 2017 ACM. SET-stuck failure includes two main failure modes: (f) EDX (energy-dispersive X-ray spectroscopy) images after 1000 cycles, Ge depletion. Reprinted with permission from Raoux et al. , Microelectron. Eng. 85 , 2330 (2008). Copyright 2008 Elsevier. (g) TEM image of undoped and doped GST. Reprinted with permission from Chen et al. , in IEEE International Memory Workshop (2009), p. 1. Copyright 2009 IEEE.CC-BY · From the PDF
FIG. 9 Write disturbance of (a)-(c) RRAM and (d) and (e) PCM. (a) Schematic diagram of the RRAM crossbar array with the 1/2 voltage scheme. (b) The physical mechanism of HRS disturbance of RRAM, incorrect resistive switching from HRS to LRS. (c) LRS disturbance, incorrect resistive switching from LRS to HRS. Reprinted with permission from Li et al. , in IEEE International Reliability Physics Symposium (IRPS) (2014), p. MY.3.1. Copyright 2014 IEEE. (d) Calculated temperature maps of write disturbance within two adjacent PCM cells at 45-nm technology node. The left cell was being programed, and the right cell was disturbed by the increasing temperature, which was originally in the reset state (0). Reprinted with permission from Russo et al. , IEEE Trans. Electron Devices 55, 515 (2008). Copyright 2008 IEEE. (e) Vulnerable cells are colored in red. Reprinted with permission from Jiang et al. , in IEEE/IFIP International Conference on Dependable Systems and Networks (2014), p. 216. Copyright 2014 IEEE.
FIG. 9 Write disturbance of (a)-(c) RRAM and (d) and (e) PCM. (a) Schematic diagram of the RRAM crossbar array with the 1/2 voltage scheme. (b) The physical mechanism of HRS disturbance of RRAM, incorrect resistive switching from HRS to LRS. (c) LRS disturbance, incorrect resistive switching from LRS to HRS. Reprinted with permission from Li et al. , in IEEE International Reliability Physics Symposium (IRPS) (2014), p. MY.3.1. Copyright 2014 IEEE. (d) Calculated temperature maps of write disturbance within two adjacent PCM cells at 45-nm technology node. The left cell was being programed, and the right cell was disturbed by the increasing temperature, which was originally in the reset state (0). Reprinted with permission from Russo et al. , IEEE Trans. Electron Devices 55, 515 (2008). Copyright 2008 IEEE. (e) Vulnerable cells are colored in red. Reprinted with permission from Jiang et al. , in IEEE/IFIP International Conference on Dependable Systems and Networks (2014), p. 216. Copyright 2014 IEEE.CC-BY · From the PDF
FIG. 10 Device variation and its impact on accuracy. (a) Illustration of spatial variation and temporal variation in the weight update process. Different devices show slight nonlinear differences due to spatial variation. Temporal variation refers to the fluctuation of conductance with the incremental pulses of one device. (b) and (c) Recognition accuracy as a function of the standard deviation of device variation. The curves of different colors and shapes represent the nonlinearity baseline from (0, 0) to (6,  6) of long-term potentiation (LTP) and long-term depression (LTD). Compared to the spatial effect, the impact of the temporal effect on recognition accuracy is more critical. Reprinted with permission from Chen et al. , in IEEE/ACM International Conference on Computer-Aided Design (ICCAD) (2015), p. 3-A.3.194. Copyright 2015 IEEE.
FIG. 10 Device variation and its impact on accuracy. (a) Illustration of spatial variation and temporal variation in the weight update process. Different devices show slight nonlinear differences due to spatial variation. Temporal variation refers to the fluctuation of conductance with the incremental pulses of one device. (b) and (c) Recognition accuracy as a function of the standard deviation of device variation. The curves of different colors and shapes represent the nonlinearity baseline from (0, 0) to (6, 6) of long-term potentiation (LTP) and long-term depression (LTD). Compared to the spatial effect, the impact of the temporal effect on recognition accuracy is more critical. Reprinted with permission from Chen et al. , in IEEE/ACM International Conference on Computer-Aided Design (ICCAD) (2015), p. 3-A.3.194. Copyright 2015 IEEE.CC-BY · From the PDF

Verification

Claims the paper makes

The claims and statistics of this paper haven’t been checked yet.

Free: it reads the open-access text and checks the first 5 claims that cite a source we can check. Create a free account to check every claim.

A few free checks a day · papers already verified open instantly · results are public

Claims other papers make about this one

Each is checked against this paper’s own text: does it say what the citing paper says it does?

Self-check

Percentages, sums and reported differences re-computed from the paper’s own numbers.

The self-check needs the paper’s full text.

Citations

Cites

Show all 83 references

Cited by

See all 358

Metadata

Authors
Zhao, M., Gao, B., Tang, J., Qian, H., & Wu, H.
Affiliations
Institute of Microelectronics (CN)
Venue
Applied Physics Reviews
Published
2020-01-02
Volume
7
Issue
1
ISSN
1931-9401 (ISSN-L)
OpenAlex
W2997510972
Cited by
349
References
83
Citations by year
2026: 36 · 2025: 52 · 2024: 65 · 2023: 68 · 2022: 53 · 2021: 42 · 2020: 33
FWCI
16.84
Type
journal article
Language
en
Open access
Licence
Locations
Applied Physics Reviews (publishedVersion, cc-by)
Funders
  • National Key Research and Development Program of China (2017YFB0405604)
  • National Major Research Program (2017ZX02315001-005)
  • National Natural Science Foundation of China (61851404, 61874169, 61674089, 61674092, 61674087)
  • Beijing Municipal Science and Technology Project (Z181100003218001, Z191100007519008)
  • Beijing Innovation Center for Future Chip (ICFC)
Topics
  • Physical Sciences › Engineering › Electrical and Electronic Engineering › Advanced Memory and Neural Computing
  • Physical Sciences › Engineering › Electrical and Electronic Engineering › Ferroelectric and Negative Capacitance Devices
  • Physical Sciences › Materials Science › Materials Chemistry › Phase-change materials and chalcogenides
Keywords
neuromorphic computing, device reliability, endurance degradation, conductance tuning, analog computing, energy-efficient hardware

About these checks

Registry, retraction, Cites and statistics results are computed, not judged, with one exception: a printed reference that no index lists is read once by a model before it counts as a citation error. Claims are extracted by a model and kept only when their quote appears verbatim in the text; each cited source is then checked, with a model’s help, for whether it says what the claim relies on. Those verdicts can be wrong — read the claim’s quote and the cited source before relying on one.

Statistics and arithmetic are recomputed, not judged.

Confidence bands are shown only for fields calibrated on our annotated test set. None is calibrated yet, so no band is shown.

What counts as a claim ›How we measure confidence ›How we check this ›

Are you an author, or do you see a problem with this page? Request a review

How to cite

Cite CoChat for the checks on this page, and the paper for its own findings.

This page
CoChat. (2026). Citation check: Reliability of analog resistive switching memory for neuromorphic computing. https://app.cochat.ai/papers/10.1063/1.5124915
The paper
Zhao, M., Gao, B., Tang, J., Qian, H., & Wu, H. (2020). Reliability of analog resistive switching memory for neuromorphic computing. Applied Physics Reviews. https://doi.org/10.1063/1.5124915

Data sources

Bibliographic data: Semantic Scholar, OpenAlex, Crossref.

Contains information from the Semantic Scholar Academic Graph Datasets, made available under the ODC Attribution License (ODC-BY 1.0).

Semantic Scholar’s data is described in: Kinney, R., et al. (2023). The Semantic Scholar Open Data Platform. arXiv:2301.10140.