

The DOI matches its Crossref record; 8 of the 8 references it cites were found in a registry or an index.
Changes in temperature alter the relationship between biodiversity and ecosystem functioning
Abstract
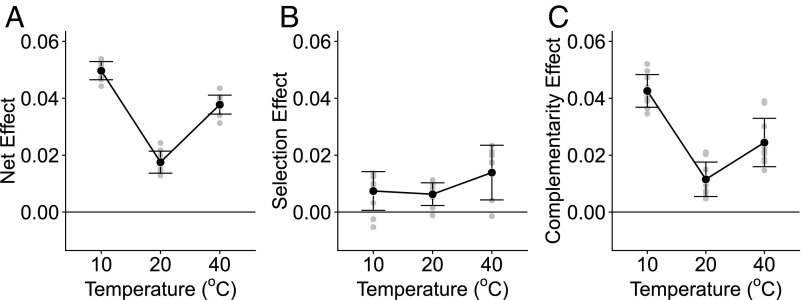
Significance: Empirical evidence for the response of ecosystem functioning to the combined effects of warming and biodiversity loss is scarce. We show that warming and biodiversity loss interact synergistically, impairing the functioning of microbial communities. We found that as temperatures departed from ambient conditions more species were required to maintain ecosystem functioning. Our results suggest interspecific complementarity increased under thermal stress and high-diversity communities that seemed functionally redundant at ambient temperature became more functionally unique as temperatures changed. Biodiversity may therefore be even more important than previously anticipated when considering the impacts of multiple facets of environmental change.
Overview
The claims and statistics of this paper haven’t been checked yet.
Run the check — free, no account needed. It reads the open-access text and checks the sources it cites.
Integrity signals
Registry
Cites
Statistics
Figures
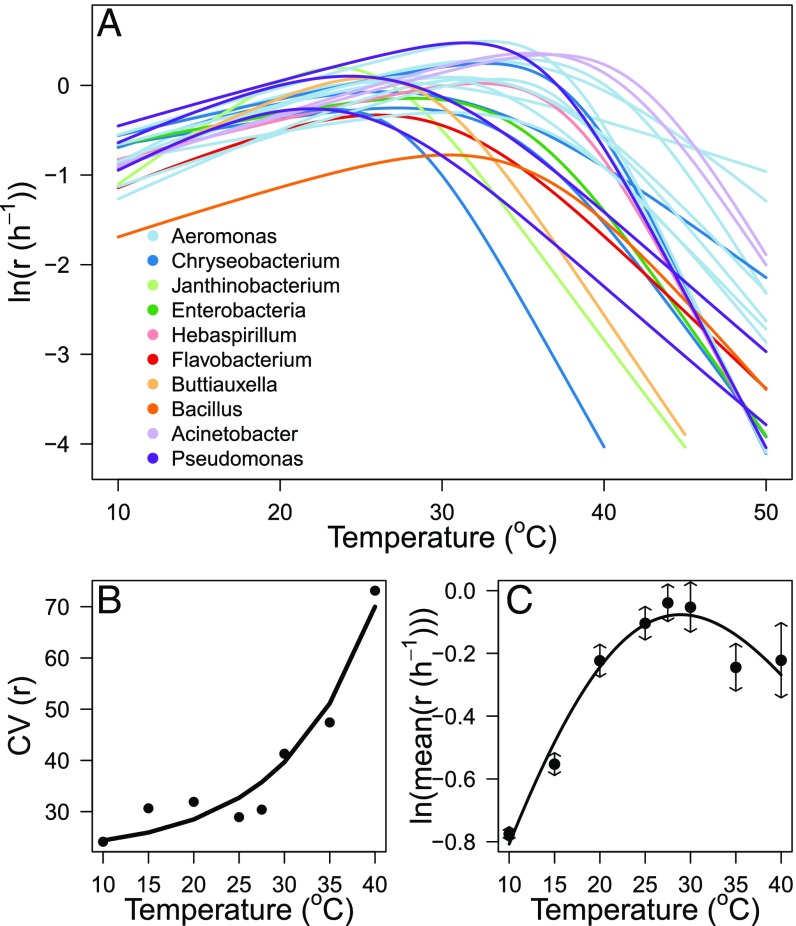
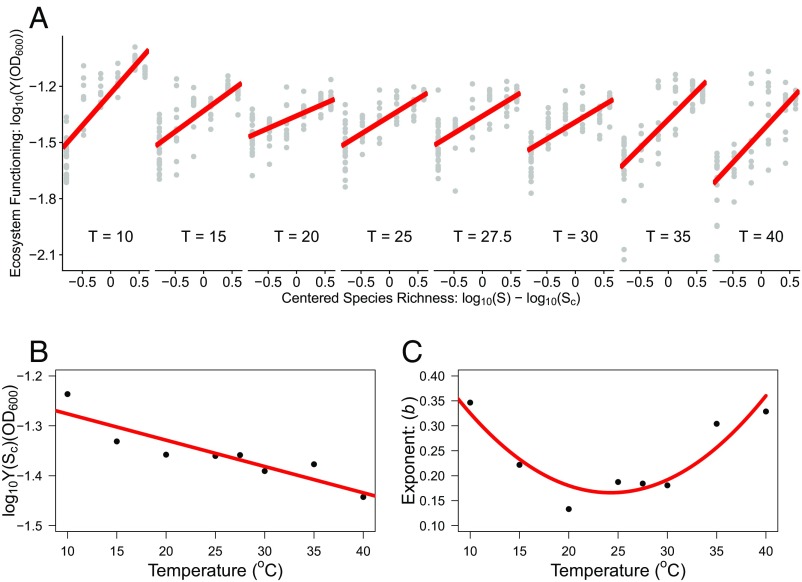
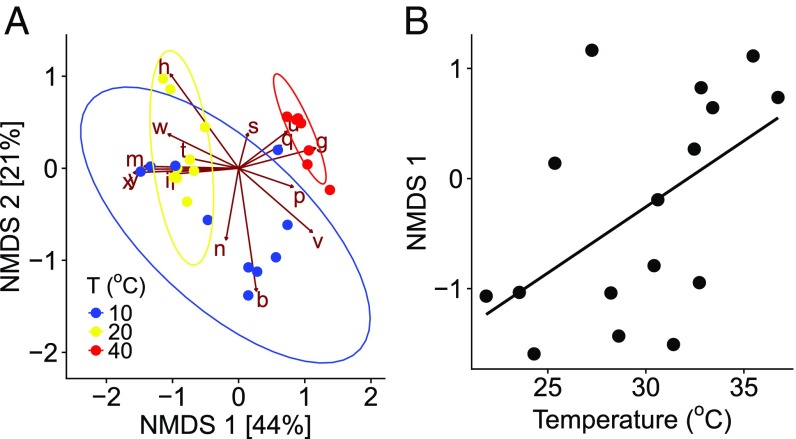
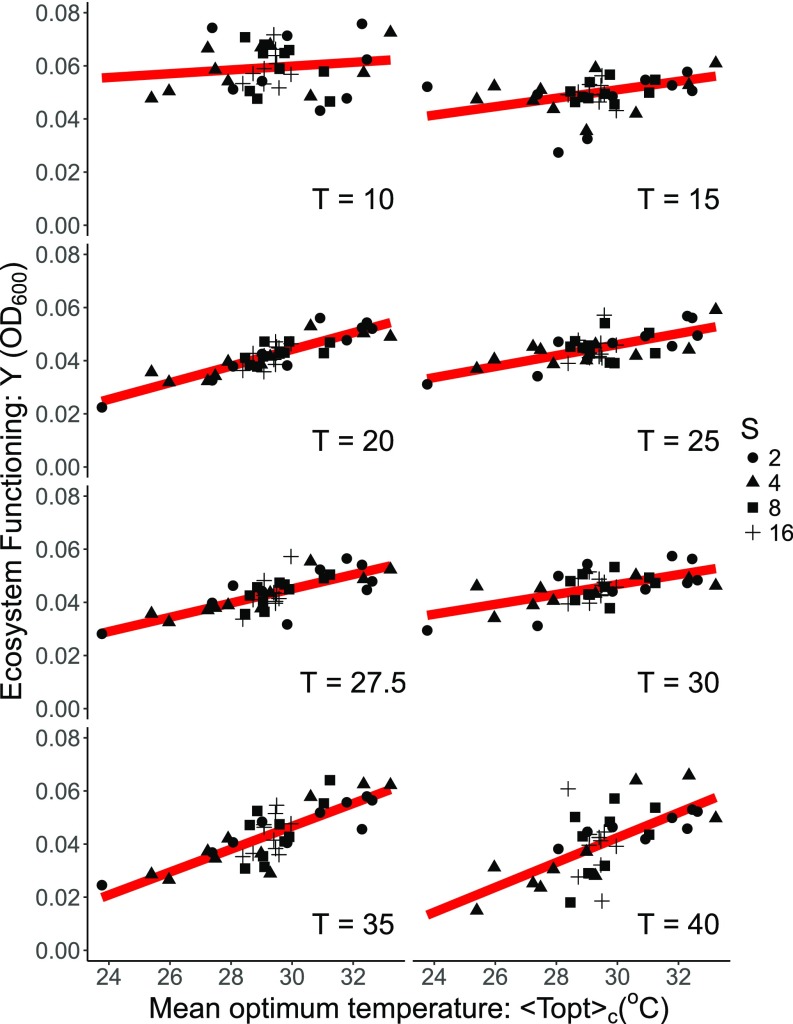
Verification
Claims the paper makes
The claims and statistics of this paper haven’t been checked yet.
Run the check — free, no account needed. It reads the open-access text and checks the sources it cites.
Claims other papers make about this one
Each is checked against this paper’s own text: does it say what the citing paper says it does?
In the citing paper
“Ecosystem structure can also be severely affected by drastic temperature variations, with an important impact on biodiversity (66, 67), as it has already been suggested for the K/Pg mass extinction (13).”
From Asteroid impact, not volcanism, caused the end-Cretaceous dinosaur extinction (2020) · cites this paper as [67]
Self-check
Percentages, sums and reported differences re-computed from the paper’s own numbers.
The self-check needs the paper’s full text.
Citations
Cites
Biodiversity loss and its impact on humanity
Cardinale, B. J., Duffy, J. E., Gonzalez, A., Hooper, D. U., Perrings, C., Venail, P., Narwani, A., Mace, G. M., Tilman, D., Wardle, D. A., et al. (2012) · Nature · doi:10.1038/nature11148 · Cited by 7,457 · cited 2×
“Overall, our results highlight the critical importance of biodiversity for maintaining the functioning of ecosystems, which face the double-edged sword of declining biodiversity through habitat loss (34), pollution, species invasions, and rapid changes in the abiotic environment brought about by climate change (1).”
BackgroundGlobal effects of land use on local terrestrial biodiversity
Newbold, T., Hudson, L. N., Hill, S. L. L., Contu, S., Lysenko, I., Senior, R. A., Börger, L., Bennett, D. J., Choimes, A., Collen, B., et al. (2015) · Nature · doi:10.1038/nature14324 · Cited by 4,352
Effects of Size and Temperature on Metabolic Rate
Gillooly, J. F., Brown, J. H., West, G. B., Savage, V. M., & Charnov, E. L. (2001) · Science · doi:10.1126/science.1061967 · Cited by 3,810
A global synthesis reveals biodiversity loss as a major driver of ecosystem change
Hooper, D. U., Adair, E. C., Cardinale, B. J., Byrnes, J. E. K., Hungate, B. A., Matulich, K. L., Gonzalez, A., Duffy, J. E., Gamfeldt, L., & O’Connor, M. I. (2012) · Nature · doi:10.1038/nature11118 · Cited by 2,406
High plant diversity is needed to maintain ecosystem services
Isbell, F., Calcagno, V., Hector, A., Connolly, J., Harpole, W. S., Reich, P. B., Scherer-Lorenzen, M., Schmid, B., Tilman, D., van Ruijven, J., et al. (2011) · Nature · doi:10.1038/nature10282 · Cited by 1,664
Cardinale, B. J., Wright, J. P., Cadotte, M. W., Carroll, I. T., Hector, A., Srivastava, D. S., Loreau, M., & Weis, J. J. (2007) · Proceedings of the National Academy of Sciences · doi:10.1073/pnas.0709069104 · Cited by 1,537
The contribution of species richness and composition to bacterial services
Bell, T., Newman, J. A., Silverman, B. W., Turner, S. L., & Lilley, A. K. (2005) · Nature · doi:10.1038/nature03891 · Cited by 950
Nutrient enrichment, biodiversity loss, and consequent declines in ecosystem productivity
Isbell, F., Reich, P. B., Tilman, D., Hobbie, S. E., Polasky, S., & Binder, S. (2013) · Proceedings of the National Academy of Sciences · doi:10.1073/pnas.1310880110 · Cited by 712
Research works printed but not linked: 32
- M Loreau, N Mouquet, A Gonzalez, Biodiversity as spatial insurance in heterogeneous landscapes. Proc Natl Acad Sci USA 100, 12765–12770 (2003). · DOI · Paper page
- A Awasthi, M Singh, SK Soni, R Singh, A Kalra, Biodiversity acts as insurance of productivity of bacterial communities under abiotic perturbations. ISME J 8, 2445–2452 (2014). · DOI
- D Tilman, J Downing, D Wedin, Does diversity beget stability-reply. Nature 371, 114 (1994). · DOI
- Y Bai, X Han, J Wu, Z Chen, L Li, Ecosystem stability and compensatory effects in the inner Mongolia grassland. Nature 431, 181–184 (2004). · DOI
- DM Perkins, , Higher biodiversity is required to sustain multiple ecosystem processes across temperature regimes. Glob Change Biol 21, 396–406 (2015). · DOI
- JM Cowles, PD Wragg, AJ Wright, JS Powers, D Tilman, Shifting grassland plant community structure drives positive interactive effects of warming and diversity on aboveground net primary productivity. Glob Change Biol 22, 741–749 (2016). · DOI · Paper page
- D Craven, , Plant diversity effects on grassland productivity are robust to both nutrient enrichment and drought. Philos Trans R Soc B Biol Sci 371, 20150277 (2016). · DOI · Paper page
- M Loreau, Biodiversity and ecosystem functioning: Recent theoretical advances. Oikos 91, 3–17 (2000). · DOI
- M Loreau, A Hector, Partitioning selection and complementarity in biodiversity experiments. Nature 413, 72–76 (2001). · DOI · Paper page
- D Tilman, , Diversity and productivity in a long-term grassland experiment. Science 294, 843–845 (2001). · DOI · Paper page
- M Angilletta, R Wilson, C Navas, R James, Tradeoffs and the evolution of thermal reaction norms. Trends Ecol Evol 18, 234–240 (2003). · DOI
- RB Huey, , Predicting organismal vulnerability to climate warming: Roles of behaviour, physiology and adaptation. Philos Trans R Soc B Biol Sci 367, 1665–1679 (2012). · DOI
- J Norberg, , Phenotypic diversity and ecosystem functioning in changing environments: A theoretical framework. Proc Natl Acad Sci USA 98, 11376–11381 (2001). · DOI
- DJ Leary, OL Petchey, Testing a biological mechanism of the insurance hypothesis in experimental aquatic communities. J Anim Ecol 78, 1143–1151 (2009). · DOI
- F Isbell, , Quantifying effects of biodiversity on ecosystem functioning across times and places. Ecol Lett 21, 763–778 (2018). · DOI
- AI Dell, S Pawar, VM Savage, Systematic variation in the temperature dependence of physiological and ecological traits. Proc Natl Acad Sci USA 108, 10591–10596 (2011). · DOI
- AI Dell, S Pawar, VM Savage, Temperature dependence of trophic interactions are driven by asymmetry of species responses and foraging strategy. J Anim Ecol 83, 70–84 (2014). · DOI
- E Bestion, B García-Carreras, CE Schaum, S Pawar, G Yvon-Durocher, Metabolic traits predict the effects of warming on phytoplankton competition. Ecol Lett 21, 655–664 (2018). · DOI
- B Steudel, , Biodiversity effects on ecosystem functioning change along environmental stress gradients. Ecol Lett 16, 1397–1405 (2012). · DOI
- C de Mazancourt, , Predicting ecosystem stability from community composition and biodiversity. Ecol Lett 16, 617–625 (2013). · DOI · Paper page
- S Wang, , An invariability-area relationship sheds new light on the spatial scaling of ecological stability. Nat Commun 8, 15211 (2017). · DOI
- JH Brown, JF Gillooly, AP Allen, VM Savage, GB West, Toward a metabolic theory of ecology. Ecology 85, 1771–1789 (2004). · DOI · Paper page
- VM Savage, JF Gillooly, JH Brown, GB West, EL Charnov, Effects of body size and temperature on population growth. Am Nat 163, 429–441 (2004). · DOI
- A Hector, , Plant diversity and productivity experiments in European grasslands. Science 286, 1123–1127 (1999). · DOI · Paper page
- B Enquist, , Scaling from traits to ecosystems: Developing a general trait driver theory via integrating trait-based and metabolic scaling theories. Adv Ecol Res 52, 249–318 (2015). · DOI
- D Lawrence, , Species interactions alter evolutionary responses to a novel environment. PLoS Biol 10, e1001330 (2012). · DOI
- D Padfield, , Metabolic compensation constrains the temperature dependence of gross primary production. Ecol Lett 20, 1250–1260 (2017). · DOI
- PD Schloss, , Introducing mothur: Open-source, platform-independent, community-supported software for describing and comparing microbial communities. Appl Environ Microbiol 75, 7537–7541 (2009). · DOI · Paper page
- I Letunic, P Bork, Interactive tree of life (itol): An online tool for phylogenetic tree display and annotation. Bioinformatics 23, 127–128 (2007). · DOI
- J Tan, Z Pu, WA Ryberg, L Jiang, Species phylogenetic relatedness, priority effects, and ecosystem functioning. Ecology 93, 1164–1172 (2012). · DOI
- R Schoofield, P Sharpe, C Magnuson, Non-linear regression of biological temperature-dependent rate models based on absolute reaction-rate theory. J Theor Biol 88, 719–731 (1981). · DOI
- D Padfield, G Yvon-Durocher, A Buckling, S Jennings, G Yvon-Durocher, Rapid evolution of metabolic traits explains thermal adaptation in phytoplankton. Ecol Lett 19, 133–142 (2016). · DOI
Cited by
Asteroid impact, not volcanism, caused the end-Cretaceous dinosaur extinction
Chiarenza, A. A., Farnsworth, A., Mannion, P. D., Lunt, D. J., Valdes, P. J., Morgan, J. V., & Allison, P. A. (2020) · Proceedings of the National Academy of Sciences · doi:10.1073/pnas.2006087117 · Cited by 228
Interactive effects of climate and land use on pollinator diversity differ among taxa and scales
Ganuza, C., Redlich, S., Uhler, J., Tobisch, C., Rojas-Botero, S., Peters, M. K., Zhang, J., Benjamin, C. S., Englmeier, J., Ewald, J., et al. (2022) · Science Advances · doi:10.1126/sciadv.abm9359 · Cited by 101
Wu, S., Du, H., & Xu, Y. (2023) · International Journal of Food Microbiology · doi:10.1016/j.ijfoodmicro.2022.109995 · Cited by 74
Evaluation of CORDEX- South Asia regional climate models for heat wave simulations over India
Singh, S., Mall, R. K., Dadich, J., Verma, S., Singh, J. V., & Gupta, A. (2021) · Atmospheric Research · doi:10.1016/j.atmosres.2020.105228 · Cited by 35
Potential feedbacks between loss of biosphere integrity and climate change
Lade, S. J., Norberg, J., Anderies, J. M., Beer, C., Cornell, S. E., Donges, J. F., Fetzer, I., Gasser, T., Richardson, K., Rockström, J., et al. (2019) · Global Sustainability · doi:10.1017/sus.2019.18 · Cited by 20
Metadata
- Authors
- García, F. C., Bestion, E., Warfield, R., & Yvon-Durocher, G.
- Affiliations
- Environment and Sustainability Institute, University of Exeter, Penryn, Cornwall TR10 9EZ, United Kingdom
- Venue
- Proceedings of the National Academy of Sciences
- Publisher
- National Academy of Sciences
- Published
- 2018-10-08
- Volume
- 115
- Issue
- 43
- Pages
- 10989-10994
- ISSN
- 0027-8424
- 1091-6490
- PMC
- PMC6205462
- Cited by
- 316
- References
- 8
- Language
- en
About these checks
Registry, retraction, Cites and statistics results are computed, not judged, with one exception: a printed reference that no index lists is read once by a model before it counts as a citation error. Claims are extracted by a model and kept only when their quote appears verbatim in the text; each cited source is then checked, with a model’s help, for whether it says what the claim relies on. Those verdicts can be wrong — read the claim’s quote and the cited source before relying on one.
Statistics and arithmetic are recomputed, not judged.
Confidence bands are shown only for fields calibrated on our annotated test set. None is calibrated yet, so no band is shown.
What counts as a claim ›How we measure confidence ›How we check this ›
Are you an author, or do you see a problem with this page? Request a review
