

The DOI matches its Crossref record; 66 of the 68 references it cites were found in a registry or an index.
Recurrence is required to capture the representational dynamics of the human visual system
Open accessAbstract
Significance: Understanding the computational principles that underlie human vision is a key challenge for neuroscience and could help improve machine vision. Feedforward neural network models process their input through a deep cascade of computations. These models can recognize objects in images and explain aspects of human rapid recognition. However, the human brain contains recurrent connections within and between stages of the cascade, which are missing from the models that dominate both engineering and neuroscience. Here, we measure and model the dynamics of human brain activity during visual perception. We compare feedforward and recurrent neural network models and find that only recurrent models can account for the dynamic transformations of representations among multiple regions of visual cortex.
Overview
The claims and statistics of this paper haven’t been checked yet.
Run the check — free, no account needed. It reads the open-access text and checks the sources it cites.
Integrity signals
Registry
Cites
Statistics
Figures
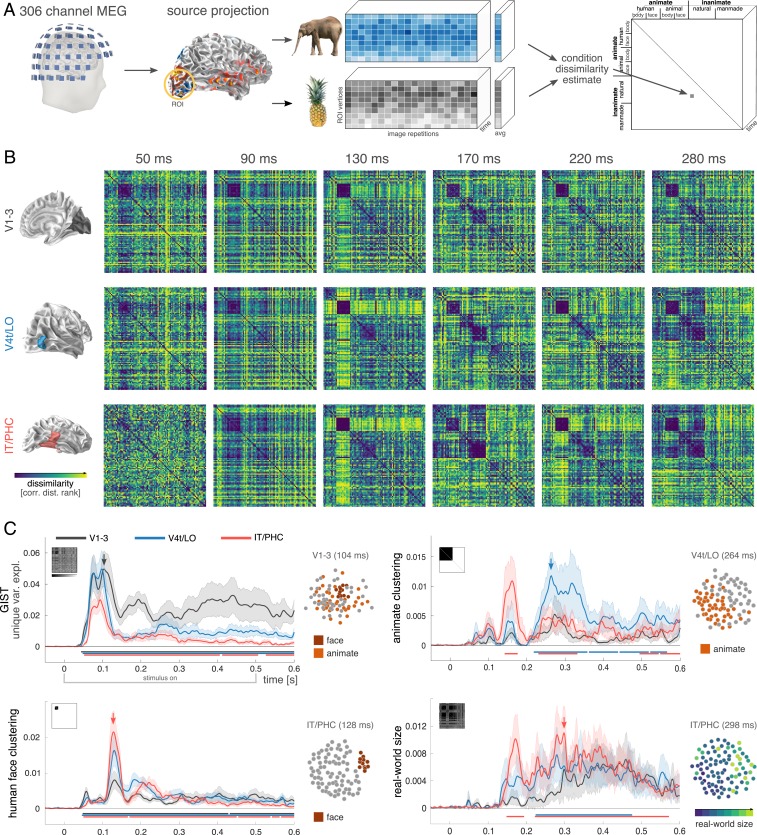
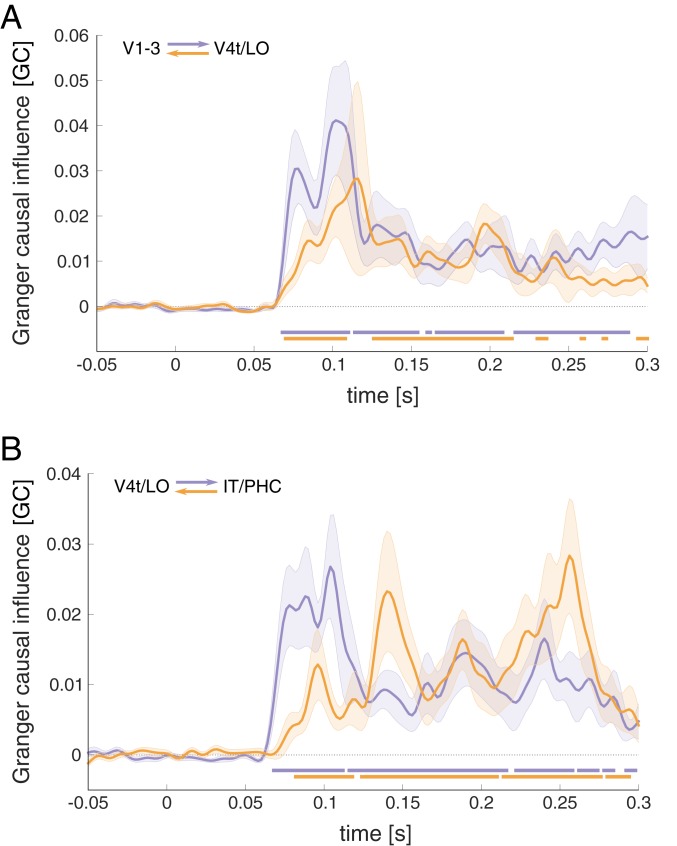
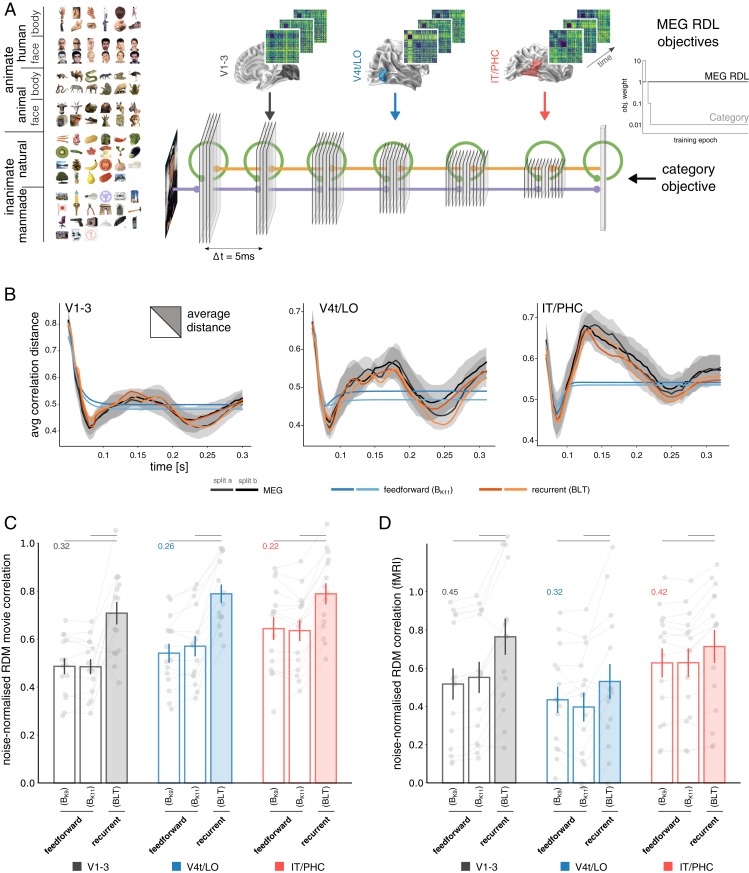
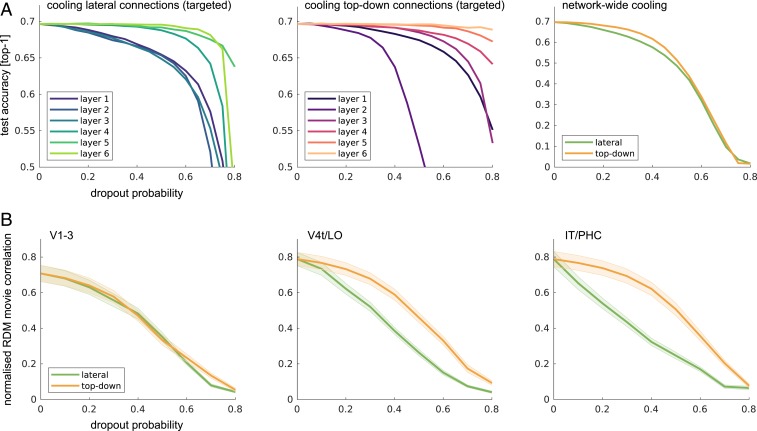
Verification
Claims the paper makes
The claims and statistics of this paper haven’t been checked yet.
Run the check — free, no account needed. It reads the open-access text and checks the sources it cites.
Claims other papers make about this one
Each is checked against this paper’s own text: does it say what the citing paper says it does?
The cited source says what the claim attributes to it.
In the citing paper
“artificial vision models such as deep convolutional neural networks (DCNNs), are already both highly successful and often claimed to be good models of human vision (Kietzmann et al. 2019, Lindsay 2021, Mehrer et al. 2021, Zhuang et al. 2021).”
From Consciousness in Artificial Intelligence: Insights from the Science of Consciousness (2023) · cites this paper as Kietzmann et al. 2019
Self-check
Percentages, sums and reported differences re-computed from the paper’s own numbers.
The self-check needs the paper’s full text.
Citations
Cites
Very Deep Convolutional Networks for Large-Scale Image Recognition
Simonyan, K., & Zisserman, A. (2014) · arXiv · doi:10.48550/arxiv.1409.1556 · Cited by 114,148
ImageNet classification with deep convolutional neural networks
Krizhevsky, A., Sutskever, I., & Hinton, G. E. (2017) · Communications of the ACM · doi:10.1145/3065386 · Cited by 112,155
TensorFlow: A system for large-scale machine learningPreprint
Abadi, M., Barham, P., Chen, J., Chen, Z., Davis, A., Dean, J., Devin, M., Ghemawat, S., Irving, G., Isard, M., et al. (2016) · arXiv (Cornell University) · doi:10.5555/3026877.3026899 · Cited by 16,548
Advances in Neural Information Processing Systems 19
(2007) · The MIT Press eBooks · doi:10.52202/085713 · Cited by 16,043
Cortical Surface-Based Analysis
Dale, A. M., Fischl, B., & Sereno, M. I. (1999) · NeuroImage · doi:10.1006/nimg.1998.0395 · Cited by 10,910
Oostenveld, R., Fries, P., Maris, E., & Schoffelen, J.-M. (2011) · Computational Intelligence and Neuroscience · doi:10.1155/2011/156869 · Cited by 10,323
Nonparametric statistical testing of EEG- and MEG-data
Maris, E., & Oostenveld, R. (2007) · Journal of Neuroscience Methods · doi:10.1016/j.jneumeth.2007.03.024 · Cited by 8,496
A multi-modal parcellation of human cerebral cortex
Glasser, M. F., Coalson, T. S., Robinson, E. C., Hacker, C. D., Harwell, J., Yacoub, E., Ugurbil, K., Andersson, J., Beckmann, C. F., Jenkinson, M., et al. (2016) · Nature · doi:10.1038/nature18933 · Cited by 5,111
MEG and EEG data analysis with MNE-Python
Gramfort, A. (2013) · Frontiers in Neuroscience · doi:10.3389/fnins.2013.00267 · Cited by 3,882
Representational similarity analysis-connecting the branches of systems neuroscience
Kriegeskorte, N. (2008) · Frontiers in Systems Neuroscience · doi:10.3389/neuro.06.004.2008 · Cited by 3,355
Self-citation
Research works printed but not linked: 2
- J. Mehrer, T. C. Kietzmann, N. Kriegeskorte, “Deep neural networks trained on ecologically relevant categories better explain human IT” in Cognitive Computational Neuroscience Meeting (Cognitive Computational Neuroscience, 2017), pp. 1–2.
- D. P. Kingma J. L. Ba Adam: A method for stochastic optimization. arXiv:1412.6980 (30 January 2017). · arXiv
Cited by
Sorted by citations
The neural architecture of language: Integrative modeling converges on predictive processing
Schrimpf, M., Blank, I. A., Tuckute, G., Kauf, C., Hosseini, E. A., Kanwisher, N., Tenenbaum, J. B., & Fedorenko, E. (2021) · Proceedings of the National Academy of Sciences · doi:10.1073/pnas.2105646118 · Cited by 517
If deep learning is the answer, what is the question?
Saxe, A., Nelli, S., & Summerfield, C. (2021) · Nature Reviews Neuroscience · doi:10.1038/s41583-020-00395-8 · Cited by 397
Artificial Neural Networks for Neuroscientists: A Primer
Yang, G. R., & Wang, X. (2020) · Neuron · doi:10.1016/j.neuron.2020.09.005 · Cited by 411
High-resolution image reconstruction with latent diffusion models from human brain activity
Takagi, Y., & Nishimoto, S. (2023) · IEEE Computer Society Conference on Computer Vision and Pattern Recognition/Proceedings - IEEE Computer Society Conference on Computer Vision and Pattern Recognition/Proceedings · doi:10.1109/cvpr52729.2023.01389 · Cited by 362
Integrative benchmarking to advance neurally mechanistic models of human intelligence
Schrimpf, M., Kubilius, J., Lee, M. J., Ratan Murty, N. A., Ajemian, R., & DiCarlo, J. J. (2020) · Neuron · doi:10.1016/j.neuron.2020.07.040 · Cited by 233
Metadata
- Authors
- Kietzmann, T. C., Spoerer, C. J., Sörensen, L. K. A., Cichy, R. M., Hauk, O., & Kriegeskorte, N.
- Affiliations
- Radboud University Nijmegen (NL)
- MRC Cognition and Brain Sciences Unit (GB)
- University of Amsterdam (NL)
- Freie Universität Berlin (DE)
- Columbia University (US)
- Corresponding author
- Kietzmann, Tim C.
- ORCID
- Venue
- Proceedings of the National Academy of Sciences
- Publisher
- National Academy of Sciences
- Published
- 2019-10-07
- Volume
- 116
- Issue
- 43
- Pages
- 21854-21863
- ISSN
- 0027-8424 (ISSN-L)
- 1091-6490
- PMC
- PMC6815174
- OpenAlex
- W2979357328
- Cited by
- 406
- References
- 68
- Citations by year
- 2026: 44 · 2025: 60 · 2024: 66 · 2023: 57 · 2022: 58 · 2021: 66 · 2020: 50 · 2019: 5
- FWCI
- 26.02
- Type
- journal article
- Language
- en
- Open access
- hybrid
- doi.org
- Licence
- Locations
- Proceedings of the National Academy of Sciences (publishedVersion, cc-by-nc-nd)
- Europe PMC (PubMed Central) (publishedVersion, cc-by-nc-nd)
- PubMed Central (publishedVersion, cc-by-nc-nd)
- PubMed (publishedVersion)
- arXiv (Cornell University) (submittedVersion)
- Refubium (Universitätsbibliothek der Freien Universität Berlin) (submittedVersion, cc-by-nc-nd)
- UvA-DARE (University of Amsterdam) (submittedVersion, cc-by-nc-nd)
- Radboud Repository (Radboud University) (submittedVersion)
- Apollo (University of Cambridge) (submittedVersion, cc-by-nc-nd)
- Radboud Repository (Radboud University) (submittedVersion, other-oa)
- Data Archiving and Networked Services (DANS) (submittedVersion, other-oa)
- arXiv (Cornell University)
- Universitätsbibliothek der FU Berlin Hochschulschriftenstelle u. Dokumentenserver
- Apollo
- Funders
- European Commission (604102, 261352)
- Deutsche Forschungsgemeinschaft
- Medical Research Council (MC-A060- 5PR20)
- Topics
- Life Sciences › Neuroscience › Cognitive Neuroscience › Visual perception and processing mechanisms
- Life Sciences › Neuroscience › Cognitive Neuroscience › Face Recognition and Perception
- Physical Sciences › Computer Science › Computer Vision and Pattern Recognition › Visual Attention and Saliency Detection
- Keywords
- recurrent neural networks, ventral stream, representational dynamics, object recognition, Granger causality, bidirectional information flow, top-down connections
- MeSH terms
- Deep Learning, Adult, Female, Humans, Models, Neurological, Nerve Net, Visual Pathways, Visual Perception, Magnetoencephalography, Feedback, Sensory
About these checks
Registry, retraction, Cites and statistics results are computed, not judged, with one exception: a printed reference that no index lists is read once by a model before it counts as a citation error. Claims are extracted by a model and kept only when their quote appears verbatim in the text; each cited source is then checked, with a model’s help, for whether it says what the claim relies on. Those verdicts can be wrong — read the claim’s quote and the cited source before relying on one.
Statistics and arithmetic are recomputed, not judged.
Confidence bands are shown only for fields calibrated on our annotated test set. None is calibrated yet, so no band is shown.
What counts as a claim ›How we measure confidence ›How we check this ›
Are you an author, or do you see a problem with this page? Request a review
