

The DOI matches its Crossref record; 37 of the 37 references it cites were found in a registry or an index.
Regulation of adipose tissue inflammation by interleukin 6
Open accessAbstract
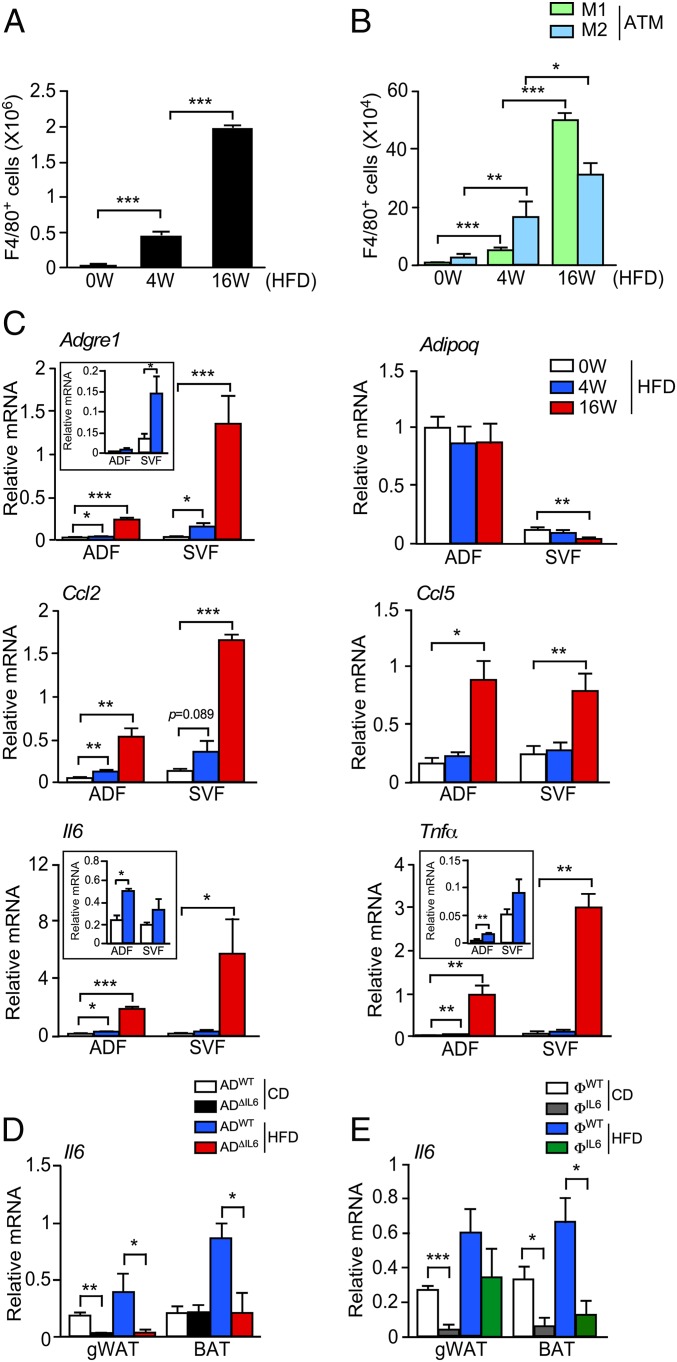
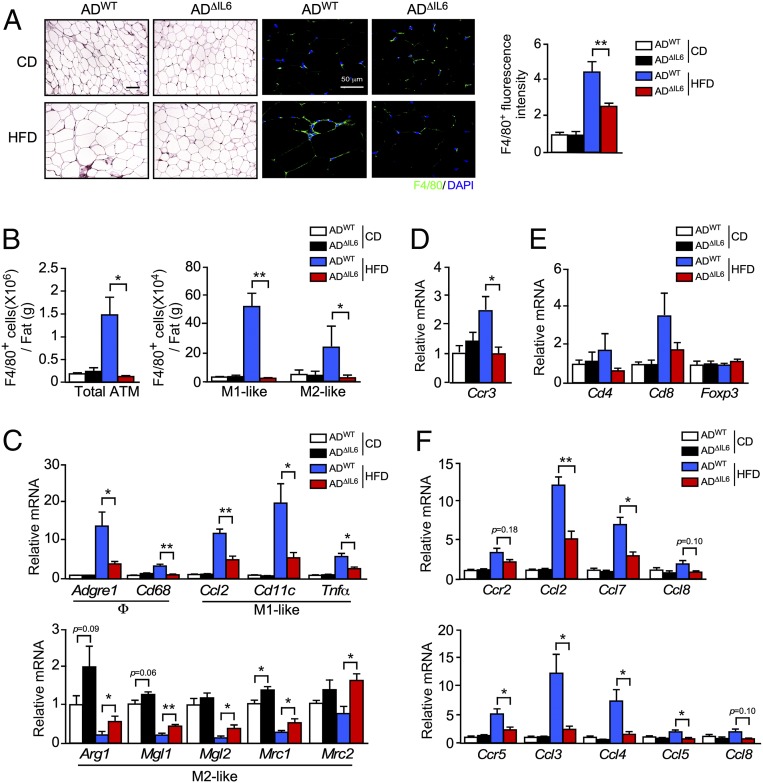
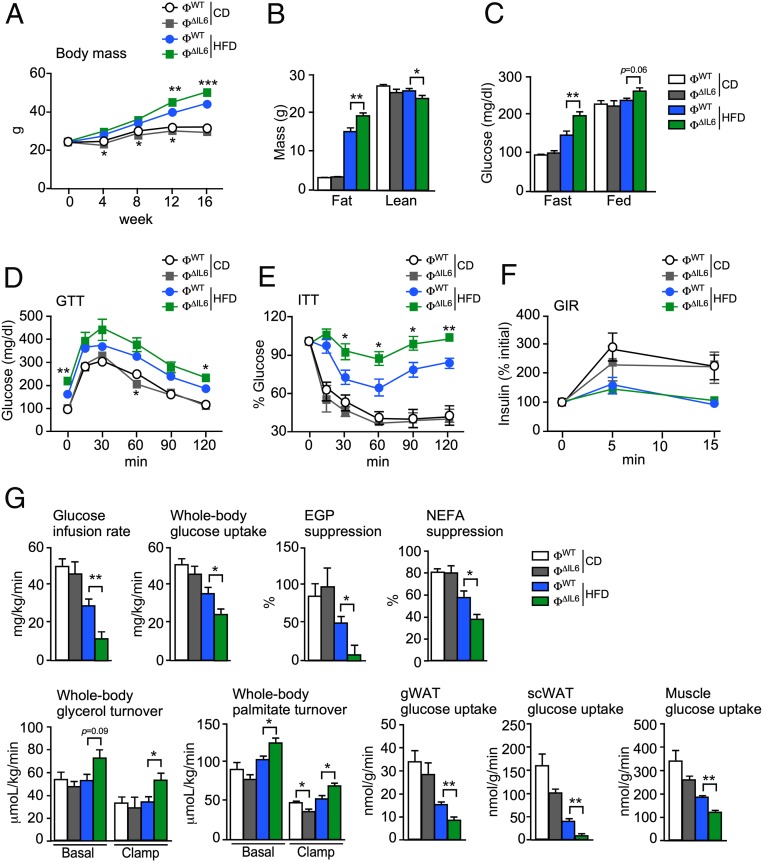
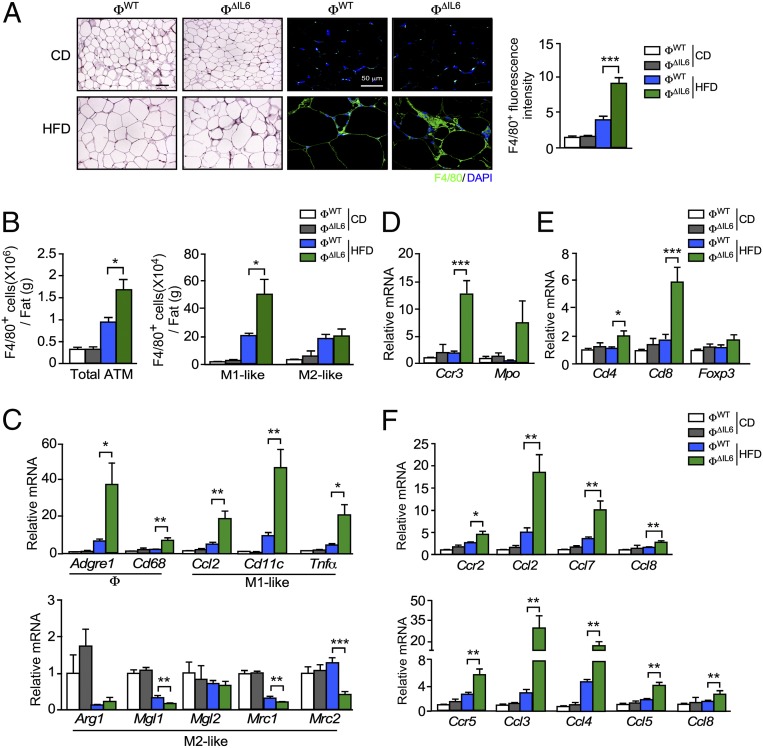
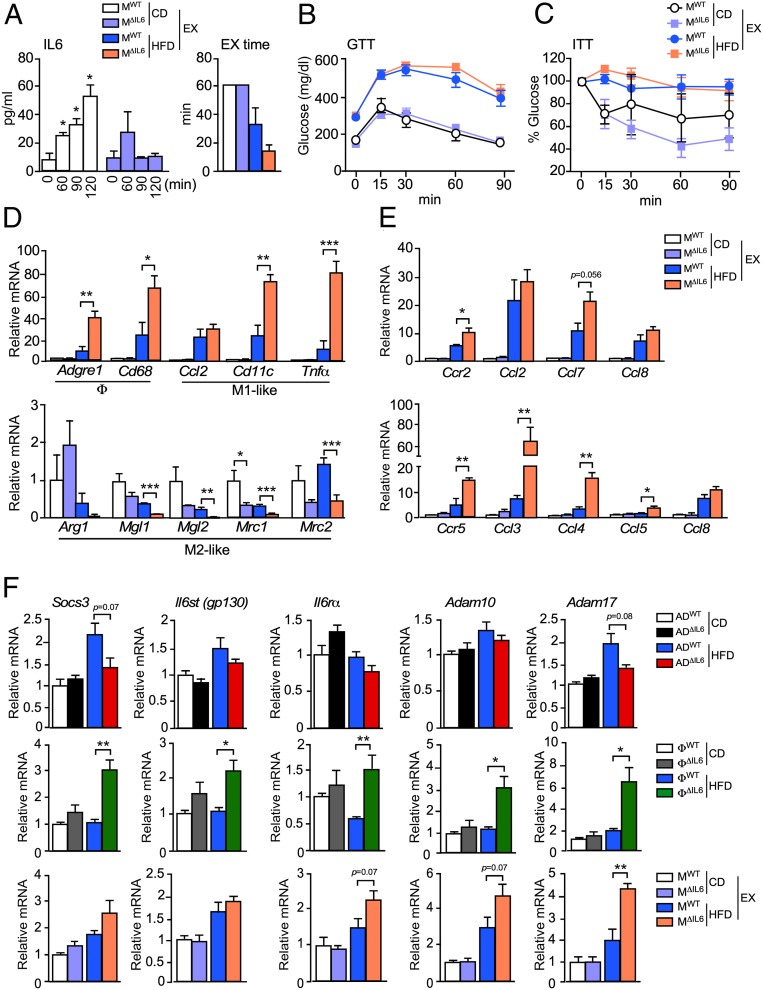
Significance Chronic low-grade inflammation is a key driver of metabolic syndrome. This inflammatory response is mediated by immune-cell infiltration and the expression of inflammatory cytokines. IL6 is implicated in this response, but the physiological role of IL6 signaling is unclear. Here, we demonstrate that the source of IL6 influences the nature of the inflammatory response. We report that IL6 secreted by myeloid cells inhibits adipose tissue macrophage (ATM) accumulation by a canonical signaling mechanism, but IL6 secreted by adipocytes or muscle promotes ATM accumulation by a noncanonical mechanism. These observations provide physiological insight into the complexity of IL6-mediated regulation of inflammation.
Overview
The claims and statistics of this paper haven’t been checked yet.
Run the check — free, no account needed. It reads the open-access text and checks the sources it cites.
Integrity signals
Registry
Cites
Statistics
Figures
Verification
Claims the paper makes
The claims and statistics of this paper haven’t been checked yet.
Run the check — free, no account needed. It reads the open-access text and checks the sources it cites.
Claims other papers make about this one
Each is checked against this paper’s own text: does it say what the citing paper says it does?
The check wasn’t confident either way, so it gives no verdict — never disputed.
In the citing paper
“Additionally, fibroblast growth factor 21 (FGF21) is also upregulated by physical activity and may act downstream of these signals to further enhance the thermogenic program [53].”
From Exercise-Induced Muscle–Fat Crosstalk: Molecular Mediators and Their Pharmacological Modulation for the Maintenance of Metabolic Flexibility in Aging (2025) · cites this paper as [53]
Experimental — accuracy not yet measuredIn the citing paper
“The finding of opposite actions of IL-6, depending of the cell source, appeared to be due to a switch of IL6 signaling from a canonical mode (myeloid cells) to a noncanonical trans-signaling mode (adipocytes and muscle) which involved increased expression of the ADAM10/17 metalloprotease that enhances trans-signaling via the soluble IL6 receptor α (215).”
From Muscle–Organ Crosstalk: The Emerging Roles of Myokines (2020) · cites this paper as [215]
In the citing paper
“Using a mouse model with conditional expression of the Il6 gene, it was found that IL6 derived from adipocytes increased, while IL6 derived from myeloid cells and muscle suppressed, macrophage infiltration of adipose tissue.”
From Muscle–Organ Crosstalk: The Emerging Roles of Myokines (2020) · cites this paper as [215]
In the citing paper
“A recent murine study suggested that IL-6 may induce either pro- or anti-inflammatory actions depending on cell source (215).”
From Muscle–Organ Crosstalk: The Emerging Roles of Myokines (2020) · cites this paper as [215]
Self-check
Percentages, sums and reported differences re-computed from the paper’s own numbers.
The self-check needs the paper’s full text.
Citations
Cites
The pro- and anti-inflammatory properties of the cytokine interleukin-6
Scheller, J., Chalaris, A., Schmidt-Arras, D., & Rose-John, S. (2011) · Biochimica et Biophysica Acta (BBA) - Molecular Cell Research · doi:10.1016/j.bbamcr.2011.01.034 · Cited by 3,212
Conditional gene targeting in macrophages and granulocytes using LysMcre mice
Clausen, B. E., Burkhardt, C., Reith, W., Renkawitz, R., & Förster, I. (1999) · Transgenic Research · doi:10.1023/a:1008942828960 · Cited by 2,098
Subcutaneous Adipose Tissue Releases Interleukin-6, But Not Tumor Necrosis Factor-α,in Vivo1
Mohamed‐Ali, V., Goodrick, S., Rawesh, A., Katz, D. R., Miles, J. M., Yudkin, J. S., Klein, S., & Coppack, S. W. (1997) · The Journal of Clinical Endocrinology & Metabolism · doi:10.1210/jcem.82.12.4450 · Cited by 2,032
Ellingsgaard, H., Hauselmann, I., Schuler, B., Habib, A. M., Baggio, L. L., Meier, D. T., Eppler, E., Bouzakri, K., Wueest, S., Muller, Y. D., et al. (2011) · Nature Medicine · doi:10.1038/nm.2513 · Cited by 922
Carey, A. L., Steinberg, G. R., Macaulay, S. L., Thomas, W. G., Holmes, A. G., Ramm, G., Prelovsek, O., Hohnen-Behrens, C., Watt, M. J., James, D. E., et al. (2006) · Diabetes · doi:10.2337/db05-1404 · Cited by 898
IL-6 pathway in the liver: From physiopathology to therapy
Schmidt-Arras, D., & Rose-John, S. (2016) · Journal of Hepatology · doi:10.1016/j.jhep.2016.02.004 · Cited by 881 · cited 1×
“The physiology of IL6 signaling is complex because the effects of IL6 on metabolism requires signal integration between cell types (4) that involve proinflammatory, anti-inflammatory, and noninflammatory mechanisms (5).”
BackgroundInterleukin-6 in acute exercise and training: what is the biological relevance?
Fischer, C. P. (2026) · PubMed · doi:10.22029/eir.2006.1620 · Cited by 817
Interleukin-6 stimulates lipolysis and fat oxidation in humans
van Hall, G., Steensberg, A., Sacchetti, M., Fischer, C., Keller, C., Schjerling, P., Hiscock, N., Møller, K., Saltin, B., Febbraio, M. A., et al. (2003) · The Journal of Clinical Endocrinology & Metabolism · doi:10.1210/jc.2002-021687 · Cited by 767
Mauer, J., Chaurasia, B., Goldau, J., Vogt, M. C., Ruud, J., Nguyen, K. D., Theurich, S., Hausen, A. C., Schmitz, J., Brönneke, H. S., et al. (2014) · Nature Immunology · doi:10.1038/ni.2865 · Cited by 727
Perry, R. J., Camporez, J.-P. G., Kursawe, R., Titchenell, P. M., Zhang, D., Perry, C. J., Jurczak, M. J., Abudukadier, A., Han, M. S., Zhang, X.-M., et al. (2015) · Cell · doi:10.1016/j.cell.2015.01.012 · Cited by 719
Cited by
Sorted by citations
Items 201–300 of 341
Bernardoni, F., Tam, F. I., Poitz, D. M., Hellerhoff, I., Arold, D., Geisler, D., Lemme, F., Keeler, J. L., Weidner, K., Pariante, C. M., et al. (2024) · Neuropsychopharmacology · doi:10.1038/s41386-024-01836-z · Cited by 7
Skeletal Muscle as Endocrine Organ
Ma, M., Zhang, Z., Hai, B., & Zhang, Y. (2025) · Advances in experimental medicine and biology · doi:10.1007/978-3-031-88361-3_22 · Cited by 9
Williams, C. Y., Wylie, A. C., Ghobrial, V., Coe, C. L., & Short, S. J. (2023) · Frontiers in Endocrinology · doi:10.3389/fendo.2023.1100724 · Cited by 6
Li, M.-K., Chang, X., & Ma, L. (2023) · Adipocyte · doi:10.1080/21623945.2023.2264442 · Cited by 6
Anti-Inflammatory and Anti-Adipocyte Dysfunction Effects of Ficus lindsayana Latex and Root Extracts
Karinchai, J., Buacheen, P., Rodthayoy, D., Yodweerapong, T., Imsumran, A., Wongnoppavich, A., Chantarasuwan, B., Suttisansanee, U., Temviriyanukul, P., & Pitchakarn, P. (2024) · Pharmaceuticals · doi:10.3390/ph17030287 · Cited by 8
Manitta, E., Marques, I. F., Bredgaard, S. S., Kelstrup, L., Houshmand‐Oeregaard, A. S., Clausen, T. D., Grunnet, L. G., Mathiesen, E. R., Dalgaard, L. T., Barrès, R., et al. (2022) · Biomedicines · doi:10.3390/biomedicines10061244 · Cited by 6
Types of cell culture inserts affect cell crosstalk between co-cultured macrophages and adipocytes
Xiao, L., Mochizuki, M., Wang, D., Shimamura, N., Sunada, K., & Nakahara, T. (2023) · Biochemical and Biophysical Research Communications · doi:10.1016/j.bbrc.2023.03.068 · Cited by 6
Fibrocytes enhance mammary gland fibrosis in obesity
Kuziel, G. M., Moore, B. N., Haugstad, G. P., & Arendt, L. M. (2023) · The FASEB Journal · doi:10.1096/fj.202300399rr · Cited by 6
Alterations in the mammary gland and tumor microenvironment of formerly obese mice
Kuziel, G. M., Moore, B. N., Haugstad, G. P., Xiong, Y., Williams, A. E., & Arendt, L. M. (2023) · BMC Cancer · doi:10.1186/s12885-023-11688-3 · Cited by 6
Role of CD4+ T-cells in the pathology of non-alcoholic fatty liver disease and related diseases
Seike, T., Mizukoshi, E., & Kaneko, S. (2021) · Hepatoma Research · doi:10.20517/2394-5079.2021.46 · Cited by 6
Role of myeloid cell leptin signaling in the regulation of glucose metabolism
Pereira, S., Cline, D. L., Chan, M. Y. T., Chai, K., Yoon, J. S., O’Dwyer, S. M., Ellis, C. E., Glavas, M. M., Webber, T. D., Baker, R. K., et al. (2021) · Scientific Reports · doi:10.1038/s41598-021-97549-0 · Cited by 6
Food Consumption and Metabolic Risks in Young University Students
González-Torres, S., González‐Silva, N., Pérez-Reyes, Á., Esparza, L. M. A., Sánchez‐Enríquez, S., Vargas-Becerra, P. N., Villagrán, Z., & García-García, M. R. (2021) · International Journal of Environmental Research and Public Health · doi:10.3390/ijerph19010449 · Cited by 9
The medicinal effects of two Australian native plants
Negahban, M. (2020) · Queensland University of Technology · doi:10.5204/thesis.eprints.206455 · Cited by 6
Adipose Tissue Plasticity in Aging
Wang, G., Song, A., Bae, M., & Wang, Q. A. (2022) · Comprehensive physiology · doi:10.1002/cphy.c220005 · Cited by 9
Matter of Fat: Cancer‐Associated Adipocytes as Mediators of Tumor Progression and Immune Evasion
Sureka, N., Chohan, S., Zaheer, S., Aden, D., Ahuja, S., Agravat, A. H., Goel, S., Hassan, M. J., Chawgthu, L., Nobin, H., et al. (2025) · Cell Biology International · doi:10.1002/cbin.70085 · Cited by 5
Potrykus, M., Stanisławowski, M., Czaja-Stolc, S., Potrykus, A., Stankiewicz, M., Owczarzak, A., Guzek, M., Szymański, M., Łoniewski, I., Adrych, K., et al. (2025) · Nutrition Journal · doi:10.1186/s12937-025-01217-2 · Cited by 5
Physical activity and exercise in liver cancer
Chen, H., Zhou, H., Wu, B., Lu, H., Zhang, J., Zhang, Y., Gu, Y., Guangwen, Z., Xiang, J., & Yang, J. (2024) · Liver Research · doi:10.1016/j.livres.2024.03.001 · Cited by 5
Safabakhsh, D., Jazaeri, M., Abdolsamadi, H., Abassi, E., & Farhadian, M. (2022) · Romanian Journal of Internal Medicine · doi:10.2478/rjim-2022-0013 · Cited by 6
Wu, X., Li, B., Lu, H., Ling, X., Hu, Z., Luo, Y., Qin, D., Yang, F., Tang, Y., Xie, T., et al. (2023) · Journal of Functional Foods · doi:10.1016/j.jff.2023.105853 · Cited by 5
Avihai, B., McDonnell, E. P., Lee, E., Greenberg, P. J., Cook, B., Altomare, N., Ko, T. M., Chaia, A. I., Parikh, P. D., & Blaser, M. J. (2023) · Pathogens · doi:10.3390/pathogens12111315 · Cited by 5
Laviano, H. D., Gómez, G., Núñez, Y., García-Casco, J. M., Benítez, R., Heras-Molina, A., Gómez, F., Sánchez‐Esquiliche, F., Martínez-Fernández, B., Gonzalez‐Bulnes, A., et al. (2024) · PLoS ONE · doi:10.1371/journal.pone.0310399 · Cited by 5
Breuer, S., Kasper, P., Vohlen, C., Janoschek, R., Hoffmann, T., Appel, S., Müller-Limberger, E., Mesaros, A., Rose‐John, S., Garbers, C., et al. (2021) · Nutrients · doi:10.3390/nu13113735 · Cited by 5
Hampton, K., Polski-Delve, A. N., Hellmich, C., & Rushworth, S. A. (2025) · Stem Cells · doi:10.1093/stmcls/sxaf053 · Cited by 4
Poursharifi, P., Attané, C., Chénier, I., Schmitt, C., Lussier, R., Al‐Mass, A., Leung, Y. H., Oppong, A. K., Dumais, É., Flamand, N., et al. (2025) · Molecular Metabolism · doi:10.1016/j.molmet.2025.102241 · Cited by 4
Exercise-induced myokines in metabolic regulation: mechanisms, mimetics, and translational potential
Aslam, M. A., Lee, J., Bowen, T. S., & Huh, J. Y. (2026) · Archives of Pharmacal Research · doi:10.1007/s12272-026-01624-x · Cited by 7
Saucedo, R., Peña-Cano, M. I., Díaz-Velázquez, M. F., Ferreira‐Hermosillo, A., Solis‐Paredes, J. M., Camacho‐Arroyo, I., & Valencia‐Ortega, J. (2023) · Journal of Clinical Medicine · doi:10.3390/jcm12216766 · Cited by 6
Kurnianingsih, N., Artamevia, D., Winarta, A., Wulandari, A., Siregar, S., Hasanah, D., Widodo, E., & Ratmawati, R. (2023) · Journal of Tropical Life Science · doi:10.11594/jtls.13.02.18 · Cited by 4
Woodward, B. D., Hillyer, L. M., & Monk, J. M. (2023) · Nutrients · doi:10.3390/nu15234922 · Cited by 4
Tanaka‐Yachi, R., Otsu, R., Takahashi-Muto, C., & Kiyose, C. (2022) · Journal of Oleo Science · doi:10.5650/jos.ess22184 · Cited by 5
Adipokines and the cardiorespiratory system in young patients with type 1 diabetes mellitus
Венгржиновская, О. И., Bondarenko, I. Z., Shatskaya, O. A., Nikankina, L. V., Kalashnikov, V. Y., Shestakova, M. V., & Mokrysheva, N. (2022) · Terapevticheskii arkhiv · doi:10.26442/00403660.2022.10.201889 · Cited by 4
Muscle-to-organ cross-talk mediated by interleukin 6 during exercise: a review
Rad, R. S., & Panahzadeh, F. (2023) · Sport Sciences for Health · doi:10.1007/s11332-023-01102-7 · Cited by 5
Considerations for exerkine research focusing on the response to exercise training
Darragh, I. A. J., & Egan, B. (2023) · Journal of sport and health science/Journal of Sport and Health Science · doi:10.1016/j.jshs.2023.11.002 · Cited by 4
Rashad, D. E. M., Ibrahim, S., El‐Sokary, M. M. M., Mahmoud, K. G. M., El‐Roos, M. E. A. A., Sosa, G. A., & Kandiel, M. (2023) · Biology of Reproduction · doi:10.1093/biolre/ioad177 · Cited by 4
Liu, J., Zaidi, A. H., & Pike, C. J. (2024) · bioRxiv (Cold Spring Harbor Laboratory) · doi:10.1101/2024.02.13.580189 · Cited by 4
da Costa, J. L. F., Furino, V. D. O., de Castro, C. A., Alves, J., & Duarte, A. C. G. D. O. (2022) · Frontiers in Physiology · doi:10.3389/fphys.2022.836484 · Cited by 2
Schmidt, N. P., Ferri, M. H., Molz, P., Fraga, B. S., Silveira, P. D., dos Santos, D. R., Montanez, J., Breyer, G. M., da Motta, A. D. S., Porawski, M., et al. (2025) · Molecular and Cellular Biochemistry · doi:10.1007/s11010-025-05344-6 · Cited by 3
A Contemporary Perspective on Long-Term Complications of Bariatric Surgery
Skossyrskiy, V. S., Stepochkin, D., Zaharova, E., Mamedov, R., Muraviev, S. Y., Александровна, П. Р., German, E., Nikolaev, A. V., Berikkhanov, Z. G. M., Markov, I., et al. (2025) · Obesity Surgery · doi:10.1007/s11695-025-08398-z · Cited by 3
Meta-inflammation in Hidradenitis suppurativa: from pathogenic evidence to therapeutic approaches
Moltrasio, C., Khan, A., Ahmad, N., Malik, M. A., Tricarico, P. M., Crovella, S., Agouni, A., & Marzano, A. V. (2026) · Frontiers in Immunology · doi:10.3389/fimmu.2026.1827227 · Cited by 3
Bitsi, S. (2020) · Cytokine · doi:10.1016/j.cyto.2020.155154 · Cited by 3
Biernacka, K. M., Giri, D., Hawton, K., Segers, F. H. I. D., Perks, C. M., & Hamilton-Shield, J. P. (2023) · Frontiers in Pediatrics · doi:10.3389/fped.2023.1128216 · Cited by 3
Morphofunctional Alteration of Mesenteric Lymph Nodes in the Inflammation of the Abdominal Cavity
Абдрешов, С. Н., Демченко, Г. А., Yeshmukhanbet, A. N., Yessenova, M. A., Mankibaeva, S. A., Atanbaeva, G. K., & Kulbayeva, M. (2024) · Biology · doi:10.3390/biology13030166 · Cited by 3
Evaluation of the vitamin D response index in a Saudi cohort
AlGhamdi, S. A., Dastidar, R. G., Rybiński, M., Alsufiani, H. M., Khoja, S., Enaibsi, N. N., Saif, S. F., & Carlberg, C. (2024) · Saudi Pharmaceutical Journal · doi:10.1016/j.jsps.2024.102137 · Cited by 3
A Preliminary Study on Factors That Drive Patient Variability in Human Subcutaneous Adipose Tissues
DeBari, M. K., Johnston, E. K., Scott, J. V., Ilzuka, E., Sun, W., Webster‐Wood, V. A., & Abbott, R. D. (2024) · Cells · doi:10.3390/cells13151240 · Cited by 6
Абатуров, А. Е., & Нікуліна, А. О. (2021) · Zaporozhye Medical Journal · doi:10.14739/2310-1210.2021.5.227291 · Cited by 3
Martin-Hadmaș, R. M., Martin, Ș. A., Romonți, A., & Mărginean, C. O. (2021) · Children · doi:10.3390/children8060455 · Cited by 3
A health risk model for rural households based on the distribution of multi pollutants
Rathnamala, G. V., Shivashankara, G. P., Ashwini, R. M., Rashmi, H. R., & Bhowmik, B. (2023) · Water Science & Technology · doi:10.2166/wst.2023.084 · Cited by 3
Influence of Adipose Tissue on Ocular Inflammation
Barthelemy, N., Goldhardt, R., Cabrera, K., & Galor, A. (2025) · Cornea · doi:10.1097/ico.0000000000003848 · Cited by 2
Quarta, S., Calabriso, N., Carluccio, M. A., Rizzo, M. L., Wabitsch, M., Verri, T., Maffia, M., Damiano, F., Siculella, L., Santarpino, G., et al. (2025) · Food Science & Nutrition · doi:10.1002/fsn3.70962 · Cited by 2
Meng, X., Li, C., Gao, A., Wang, H., Lan, W., & Sun, L. (2024) · Journal of Chromatography B · doi:10.1016/j.jchromb.2024.124197 · Cited by 2
Deng, Q., Wong, H. M., Huang, F. P., & Peng, S. (2025) · Journal of Dentistry · doi:10.1016/j.jdent.2025.105979 · Cited by 2
Fu, J., van Unen, N., Sarlea, A., Nguyen, N., Jaeger, M., Botey-Bataller, J., Koeken, V. A. C. M., de Bree, L. C. J., Mourits, V. P., Moorlag, S. J. C. F. M., et al. (2025) · Molecular Systems Biology · doi:10.1038/s44320-025-00146-w · Cited by 3
Mikhailov, A. A., Khalimov, Y. S., Gaiduk, S. V., Rubtsov, Y. E., & Kireeva, E. B. (2022) · Bulletin of the Russian Military Medical Academy · doi:10.17816/brmma103946 · Cited by 2
Mysterious Akkermansia muciniphila. What do we know about it? A review
Zakharova, I. N., Berezhnaya, I. V., Dubovets, N. F., Владимировна, С. Е., Dubovets, E. A., & Dubovets, A. A. (2023) · Pediatrics Consilium Medicum · doi:10.26442/26586630.2023.1.202190 · Cited by 2
Wang, J., Azzam, M. M., Xiong, T., Wang, Y., Ye, J., Fan, Q., Xu, D., Ding, F., Cheng, Z., Al-Abdullatif, A. A., et al. (2024) · The Journal of Applied Poultry Research · doi:10.1016/j.japr.2024.100491 · Cited by 2
Authors’ Reply to: Tocilizumab, Adipokines and Severe Complications of COVID-19
Liu, B., & Qi, Z. (2020) · Clinical Drug Investigation · doi:10.1007/s40261-020-00948-w · Cited by 2
Chronic GLP1 therapy reduces postprandial IL6 in obese humans with prediabetes
Hamidi, V., Wang, H., Pham, V., Andre, K. B. S., Taegtmeyer, H., & Gutierrez, A. (2024) · Cardiovascular Endocrinology & Metabolism · doi:10.1097/xce.0000000000000298 · Cited by 1
Łukaszuk, B., Supruniuk, E., Chabowski, A., & Mikłosz, A. (2024) · Cells · doi:10.3390/cells13191603 · Cited by 1
Doğan, A., Şenkal, S., & Okumuş, E. B. (2025) · Biochimie · doi:10.1016/j.biochi.2025.06.016 · Cited by 1
Howe, S. L., Holdom, C. J., McCombe, P., Henderson, R. D., Steyn, F. J., & Ngo, S. T. (2026) · Amyotrophic Lateral Sclerosis and Frontotemporal Degeneration · doi:10.1080/21678421.2026.2627902 · Cited by 1
Sarcopenic obesity and metabolic disorders in ageing
Kurmaev, D. P., Bulgakova, S. V., Treneva, E. V., Косарева, О. В., Sharonova, L. A., Dolgikh, Y. A., & Merzlova, P. Y. (2025) · Экспериментальная и клиническая гастроэнтерология · doi:10.31146/1682-8658-ecg-235-3-134-147 · Cited by 2
Comorbidity-Driven Inflammation in HFpEF: Immune Profiling and Therapeutic Targets
Cami, E., Verghote, E., Pecetto, E., González, A., Bråkenhielm, E., Jones, E. A. V., & van Empel, V. P. M. (2026) · Current Heart Failure Reports · doi:10.1007/s11897-026-00745-0 · Cited by 2
Burns, J. L., Van, K., Alzubi, A., Cho, C. E., & Monk, J. M. (2026) · Nutrients · doi:10.3390/nu18060942 · Cited by 1
Yan, H., Wang, Y., He, X., Li, Y., Yang, L., Yang, J., Meng, X., Peng, C., Zhang, X., Yakupu, A., et al. (2026) · Frontiers in Immunology · doi:10.3389/fimmu.2026.1793958 · Cited by 1
Gavini, C. K., Raux, L., Labouèbe, G., Gornick, E. S., Hugh, S. M., Elshareif, N., Calcutt, N. A., di Summa, P. G., Gorostidi, F., Vonaesch, P., et al. (2026) · Brain Behavior and Immunity · doi:10.1016/j.bbi.2026.106795 · Cited by 1
Skibniewska, J., Desai, S., Casell-Kelley, L., Maung, J. N., Sastry, A., McMillin, J., Day, H., Singer, K., & Varghese, M. (2026) · Frontiers in Endocrinology · doi:10.3389/fendo.2026.1814026 · Cited by 1
Bahman, F., Al-Roub, A., Akther, N., Madhoun, A. A., Al-Mulla, F., & Ahmad, R. (2026) · Frontiers in Immunology · doi:10.3389/fimmu.2026.1840850 · Cited by 1
Yuan, X., Lu, H., Hu, Y., Yang, Z., Jin, X., & Qi, Z. (2023) · Journal of Craniofacial Surgery · doi:10.1097/scs.0000000000009500 · Cited by 1
Ren, J., Wang, X., Nakao, T., Libby, P., & Shi, G. (2023) · Cardiology Discovery · doi:10.1097/cd9.0000000000000096 · Cited by 1
Gurumayum, S., Basumatary, D., Sarma, P., Saikia, K., Swargiary, D., Akhtar, S. A., Saikia, A., & Borah, J. C. (2024) · Food Bioscience · doi:10.1016/j.fbio.2024.105292 · Cited by 1
Vogado, C. D. O., Ferreira, M. A., Nakano, E. Y., Azevedo, S., Magalhães, K. G., Arruda, S. F., & Botelho, P. B. (2024) · British Journal Of Nutrition · doi:10.1017/s0007114524002356 · Cited by 1
The Immun System Response İn Covıd-19 Infectıon İn Polycystıc Ovary Syndrome
Arusoğlu, G., & Bozay, K. (2021) · International Journal Of Medical Science And Clinical Invention · doi:10.18535/ijmsci/v8i05.05 · Cited by 2
MOLECULAR MECHANISMS OF OBESITY: A REVIEW OF THE MOST RELEVANT GENE MARKERS
Karabanov, S. Y. (2023) · Genes and Cells · doi:10.23868/gc375313
Papageorgiou, L., Papakonstantinou, E., Diakou, I., Pierouli, K., Dragoumani, K., Bacopoulou, F., Chrousos, G. P., Eliopoulos, E., & Vlachakis, D. (2023) · Advances in experimental medicine and biology · doi:10.1007/978-3-031-31978-5_6 · Cited by 1
DeBari, M. K., Johnston, E. K., Scott, J. V., Ilzuka, E., Sun, W., Webster‐Wood, V. A., & Abbott, R. D. (2023) · bioRxiv (Cold Spring Harbor Laboratory) · doi:10.1101/2023.05.31.543052 · Cited by 1
Majeed, Y., Halabi, N. M., Engelke, R., Sarwath, H., Al-Noubi, M. N., Choi, S., Al-Malki, A., Agha, M. V., Vakayil, M., Chouchane, L., et al. (2025) · eLife · doi:10.7554/elife.109214 · Cited by 1
Majeed, Y., Halabi, N. M., Engelke, R., Sarwath, H., Al-Noubi, M. N., Choi, S., Al-Malki, A., Agha, M. V., Vakayil, M., Chouchane, L., et al. (2025) · eLife · doi:10.7554/elife.109214.1 · Cited by 1
Ravindran, S. (2020) · Proceedings of the National Academy of Sciences · doi:10.1073/pnas.1922912117
Molecular analysis of human adipocytes during glucose restriction and (re)feeding
Qi, Q. (2020) · Research Publications (Maastricht University) · doi:10.26481/dis.20200827qq
Allen, S. (2020) · Journal of Aging Science · doi:10.35248/2329-8847.20.s3.003
From brain to muscle and back : novel approaches to harness the benefits of exercise
Kelahmetoglu, Y. (2020) · Figshare
Fève, B., Vatier, C., Antuna-Puente, B. P., Felahi, S., & Bastard, J. (2021) · Elsevier eBooks · doi:10.1016/b978-2-294-76753-1.00034-5
Abellán, R. M. (2008) · Revista iberoamericana de psicomotricidad y técnicas corporales
Endocrine Role of Adipose Tissue in Obesity and Related Disorders
Kumar, S. S., Mishra, A. K., & Ghosh, A. R. (2021) · Advances in biochemistry in health and disease · doi:10.1007/978-3-030-84763-0_2
Şentürk, M. (2022) · Biochemistry · doi:10.5772/intechopen.100950 · Cited by 1
Treatment Regimes in Diabetes and Their Impact on Biomarkers
Magalhães, J. P., Hetherington‐Rauth, M., & Sardinha, L. B. (2022) · Biomarkers in disease · doi:10.1007/978-3-030-81303-1_3-1
Popescu, D. M., Gheorghe, D. N., Nicolae, F. M., Dragomir, L. P., Pitru, A. R., Șoancă, A., Florescu, C., Toma, V., Foia, L. G., Roman, A. L., et al. (2022) · Biochemistry · doi:10.5772/intechopen.107318
Abbas, A. J., & Kata, F. S. (2022) · International Journal of Health Sciences · doi:10.53730/ijhs.v6ns9.12542
Treatment Regimes in Diabetes and Their Impact on Biomarkers
Magalhães, J. P., Hetherington‐Rauth, M., & Sardinha, L. B. (2022) · Biomarkers in disease · doi:10.1007/978-3-031-08014-2_3
Keshvari, S., Masson, J. J. R., Ferrari-Cestari, M., Bodea, L., Nooru‐Mohamed, F., Tse, B. W.-C., Sokolowski, K. A., Batoon, L., Patkar, O. L., Sullivan, M. A., et al. (2023) · bioRxiv (Cold Spring Harbor Laboratory) · doi:10.1101/2023.05.17.538022
Comorbid Obesity and Its Impact on Diabetes and COVID-19
Fang, J., Vo, J. L. N., & Reid, T. J. (2023) · Contemporary Endocrinology · doi:10.1007/978-3-031-28536-3_7
Strain and Depot-specific Differences in Adipose Tissues of Obese BFMI Mice
Doğan, A., Sen, I., Severcan, M., Brockmann, G. A., & Severcan, F. (2023) · In Vivo · doi:10.21873/invivo.13253
Ismael, L. Q., Keong, Y. Y., Bahari, H., Lan, C. A., & Khoo, B. Y. (2024) · Molecular Biology Reports · doi:10.1007/s11033-023-09080-2
Oliveira, B., Sidónio, B., Correia, A., Pinto, A., Azevedo, M. M., Sampaio, P., Ferreira, P. G., Vilanova, M., & Teixeira, L. (2024) · Scientific Reports · doi:10.1038/s41598-024-58885-z
COVID-19 severity and nonalcoholic fatty liver disease
Vrsaljko, N., Gjurašin, B., & Papić, N. (2024) · Elsevier eBooks · doi:10.1016/b978-0-443-18703-2.00001-3
Ganai, W., Farooq, S. H., Nabi, M., Tantry, B. A., Bandy, A., Khursheed, S. O., Dar, N., Rasool, S. U. A., Alotaibi, B. S., & Shah, N. N. (2024) · World Academy of Sciences Journal · doi:10.3892/wasj.2024.261
Metabolic syndrome in clinical psychiatric practice
Петрова, Н. Н. (2024) · S S Korsakov Journal of Neurology and Psychiatry · doi:10.17116/jnevro202412408113
Metadata
- Authors
- Han, M. S., White, A., Perry, R. J., Camporez, J.-P., Hidalgo, J., Shulman, G. I., & Davis, R. J.
- Affiliations
- University of Massachusetts Chan Medical School (US)
- Yale University (US)
- Department of Internal Medicine, Yale School of Medicine, New Haven, CT 06520;
- Universitat Autònoma de Barcelona (ES)
- Corresponding author
- Davis, Roger J.
- Venue
- Proceedings of the National Academy of Sciences
- Publisher
- National Academy of Sciences
- Published
- 2020-01-24
- Volume
- 117
- Issue
- 6
- Pages
- 2751-2760
- ISSN
- 0027-8424 (ISSN-L)
- 1091-6490
- PMC
- PMC7022151
- OpenAlex
- W3002801990
- Cited by
- 344
- References
- 37
- Citations by year
- 2026: 37 · 2025: 40 · 2024: 53 · 2023: 59 · 2022: 64 · 2021: 57 · 2020: 31
- FWCI
- 37.78
- Type
- journal article
- Language
- en
- Open access
- hybrid
- doi.org
- Licence
- Locations
- Proceedings of the National Academy of Sciences (publishedVersion, cc-by-nc-nd)
- PubMed Central (publishedVersion, cc-by-nc-nd)
- PubMed (publishedVersion)
- eScholarship@UMassChan (submittedVersion, cc-by-nc-nd)
- Dipòsit Digital de Documents de la UAB (Universitat Autònoma de Barcelona) (submittedVersion, cc-by-nc-nd)
- Funders
- American Heart Association (19CDA34660270)
- Ministerio de Economía y Competitividad (SAF2014-56546-R, RTI2018-101105-B-I00)
- HHS | NIH | National Institute of Diabetes and Digestive and Kidney Diseases (R01 DK107220, R01 DK112698, R01 DK121545, R01 DK116774, R01 DK114793, P30 DK045735)
- Topics
- Health Sciences › Medicine › Endocrinology, Diabetes and Metabolism › Adipokines, Inflammation, and Metabolic Diseases
- Health Sciences › Medicine › Physiology (medical) › Adipose Tissue and Metabolism
- Life Sciences › Immunology and Microbiology › Immunology › Cytokine Signaling Pathways and Interactions
- Keywords
- interleukin-6, adipose tissue inflammation, low-grade inflammation, metabolic syndrome, adipose tissue macrophages, myeloid cells, adipocytes, skeletal muscle, macrophage accumulation, immune cell infiltration
- MeSH terms
- ADAM10 Protein, ADAM17 Protein, Adipose Tissue, Animals, Female, Humans, Macrophages, Male, Mice, Inbred C57BL, Obesity, Species Specificity, Interleukin-6, Adipocytes, Myeloid Cells, Muscle Cells, Mice
About these checks
Registry, retraction, Cites and statistics results are computed, not judged, with one exception: a printed reference that no index lists is read once by a model before it counts as a citation error. Claims are extracted by a model and kept only when their quote appears verbatim in the text; each cited source is then checked, with a model’s help, for whether it says what the claim relies on. Those verdicts can be wrong — read the claim’s quote and the cited source before relying on one.
Statistics and arithmetic are recomputed, not judged.
Confidence bands are shown only for fields calibrated on our annotated test set. None is calibrated yet, so no band is shown.
What counts as a claim ›How we measure confidence ›How we check this ›
Are you an author, or do you see a problem with this page? Request a review
