

The DOI matches its Crossref record; 37 of the 38 references it cites were found in a registry or an index.
Human influence has intensified extreme precipitation in North America
Open accessAbstract
Significance: Extreme precipitation is relevant to many interests, and observations show an increasing trend that is expected to continue under future projections. Although previous work has identified an anthropogenic influence on extreme precipitation at hemispheric scales, this study finds robust results for a continental scale. We establish that anthropogenic climate change has contributed to the intensification of continental and regional extreme precipitation. Furthermore, we also show that the anthropogenic influence on North American regional precipitation will lead to more frequent and intense precipitation extremes in the future.
Overview
The claims and statistics of this paper haven’t been checked yet.
Run the check — free, no account needed. It reads the open-access text and checks the sources it cites.
Integrity signals
Registry
Cites
Statistics
Figures
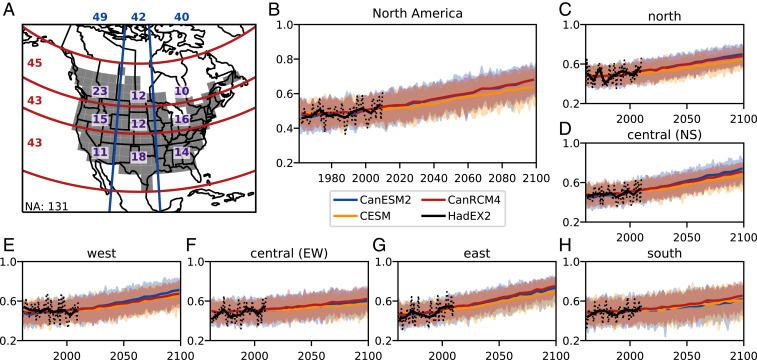
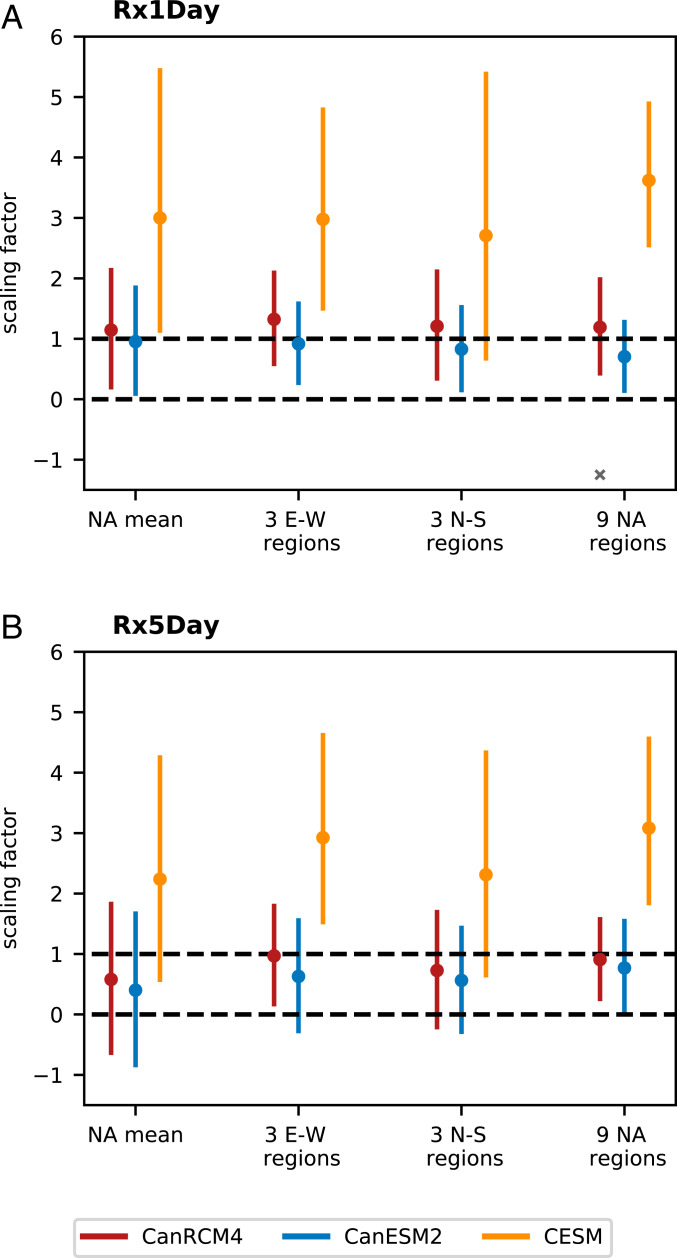
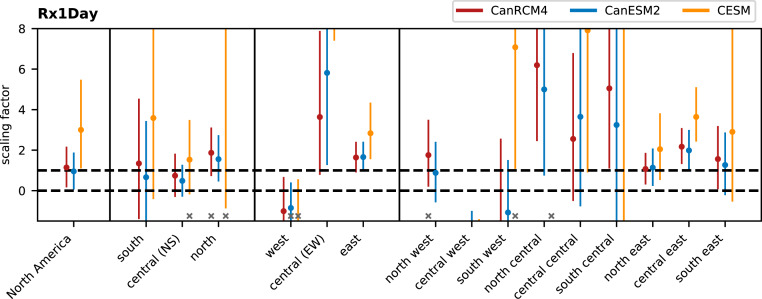
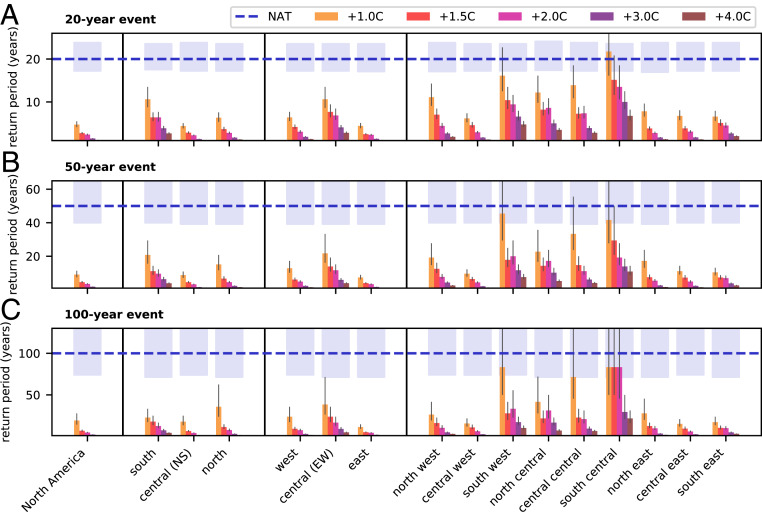
Verification
Claims the paper makes
The claims and statistics of this paper haven’t been checked yet.
Run the check — free, no account needed. It reads the open-access text and checks the sources it cites.
Claims other papers make about this one
Each is checked against this paper’s own text: does it say what the citing paper says it does?
The source backs part of the claim, not all of it — or backs it for a different population, condition or comparison.
In the citing paper
“Storms will increase in severity and frequency as a result of climate change [42–44].”
From Climate Change, Migration, and Civil Strife. (2020) · cites this paper as [42]
Experimental — accuracy not yet measured
Self-check
Percentages, sums and reported differences re-computed from the paper’s own numbers.
The self-check needs the paper’s full text.
Citations
Cites
Kay, J. E., Deser, C., Phillips, A. S., Mai, A., Hannay, C., Strand, G., Arblaster, J. M., Bates, S. C., Gokhan Danabasoglu, C., Edwards, J., et al. (2014) · Bulletin of the American Meteorological Society · doi:10.1175/bams-d-13-00255.1 · Cited by 2,496
Human contribution to more-intense precipitation extremes
Min, S., Zhang, X., Zwiers, F. W., & Hegerl, G. C. (2011) · Nature · doi:10.1038/nature09763 · Cited by 2,094
Self-citationAddressing climate information needs at the regional level: the CORDEX framework
Giorgi, F., Jones, C., & Asrar, G. (2009) · Cited by 1,755
Anthropogenic contribution to global occurrence of heavy-precipitation and high-temperature extremes
Fischer, E. M., & Knutti, R. (2015) · Nature Climate Change · doi:10.1038/nclimate2617 · Cited by 1,427
Donat, M. G., Alexander, L. V., Yang, H., Durre, I., Vose, R. S., Dunn, R., Willett, K. M., Aguilar, E., Brunet, M., Caesar, J., et al. (2013) · Journal of Geophysical Research Atmospheres · doi:10.1002/jgrd.50150 · Cited by 1,374
Self-citationClimate Science Special Report: Fourth National Climate Assessment, Volume I
USGCRP (2017) · doi:10.7930/j0j964j6 · Cited by 1,273
Detection of human influence on twentieth-century precipitation trends
Zhang, X., Zwiers, F. W., Hegerl, G. C., Lambert, F. H., Gillett, N. P., Solomon, S., Stott, P. A., & Nozawa, T. (2007) · Nature · doi:10.1038/nature06025 · Cited by 1,029
Self-citationArora, V. K., Scinocca, J., Boer, G. J., Christian, J. R., Denman, K. L., Flato, G. M., Kharin, V., Lee, W. G., & Merryfield, W. J. (2011) · Geophysical Research Letters · doi:10.1029/2010gl046270 · Cited by 889
The Max Planck Institute Grand Ensemble: Enabling the Exploration of Climate System Variability
Maher, N., Milinski, S., Suarez‐Gutierrez, L., Botzet, M., Dobrynin, M., Kornblueh, L., Kröger, J., Takano, Y., Ghosh, R., Hedemann, C. J., et al. (2019) · Journal of Advances in Modeling Earth Systems · doi:10.1029/2019ms001639 · Cited by 538
Causes of twentieth-century temperature change near the Earth's surface
Tett, S. F. B., Stott, P. A., Allen, M. R., Ingram, W., & Mitchell, J. F. B. (1999) · Nature · doi:10.1038/21164 · Cited by 504
Anthropogenic influences on major tropical cyclone events
Patricola-DiRosario, C. M., & Wehner, M. F. (2018) · Nature · doi:10.1038/s41586-018-0673-2 · Cited by 480
Volcanic contribution to decadal changes in tropospheric temperature
Santer, B. D., Bonfils, C., Painter, J. F., Zelinka, M. D., Mears, C. A., Solomon, S., Schmidt, G. A., Fyfe, J. C., Cole, J. N. S., Nazarenko, L., et al. (2014) · Nature Geoscience · doi:10.1038/ngeo2098 · Cited by 460
Attributing intensification of precipitation extremes to human influence
Zhang, X., Wan, H., Zwiers, F. W., Hegerl, G. C., & Min, S. (2013) · Geophysical Research Letters · doi:10.1002/grl.51010 · Cited by 355
Self-citationAttribution of Extreme Events in Arctic Sea Ice Extent
Kirchmeier‐Young, M. C., Zwiers, F. W., & Gillett, N. P. (2016) · Journal of Climate · doi:10.1175/jcli-d-16-0412.1 · Cited by 286
Self-citationIdentifying external influences on global precipitation
Marvel, K., & Bonfils, C. (2013) · Proceedings of the National Academy of Sciences · doi:10.1073/pnas.1314382110 · Cited by 273
Sheffield, J., Barrett, A. P., Colle, B. A., Fernando, N., Fu, R., Geil, K. L., Hu, Q., Kinter, J. L., Kumar, S., Langenbrunner, B., et al. (2013) · Journal of Climate · doi:10.1175/jcli-d-12-00592.1 · Cited by 271
Attribution of Extreme Weather Events in the Context of Climate Change
Stott, P. A., Christidis, N., Otto, F. E. L., Sun, Y., Vanderlinden, J., van Oldenborgh, G. J., Vautard, R., von STORCH, H., Walton, P., Yiou, P., et al. (2016) · HAL · doi:10.17226/21852 · Cited by 266
Coordinated Global and Regional Climate Modeling*
Scinocca, J., Kharin, V. V., Jiao, Y., Qian, M., Lazare, M., Solheim, L., Flato, G. M., Biner, S., Desgagné, M., & Dugas, B. (2015) · Journal of Climate · doi:10.1175/jcli-d-15-0161.1 · Cited by 231
Ribes, A., Planton, S., & Terray, L. (2013) · Climate Dynamics · doi:10.1007/s00382-013-1735-7 · Cited by 229
Precipitation change in the United States
Easterling, D. R., Arnold, J. R., Knutson, T. R., Kunkel, K. E., LeGrande, A. N., Leung, L.-Y. R., Vose, R. S., Waliser, D. E., & Wehner, M. F. (2017) · Lincoln (University of Nebraska) · Cited by 215
van der Wiel, K., Kapnick, S., van Oldenborgh, G. J., Whan, K., Philip, S. Y., Vecchi, G. A., Singh, R. K., Arrighi, J., & Cullen, H. M. (2017) · Hydrology and earth system sciences · doi:10.5194/hess-21-897-2017 · Cited by 202
Massey, N., Jones, R., Otto, F. E. L., Aina, T., Wilson, S., Murphy, J. M., Hassell, D., Yamazaki, Y. H., & Allen, M. R. (2014) · Quarterly Journal of the Royal Meteorological Society · doi:10.1002/qj.2455 · Cited by 197
Detection and attribution of human influence on regional precipitation
Sarojini, B. B., Stott, P. A., & Black, E. C. L. (2016) · Nature Climate Change · doi:10.1038/nclimate2976 · Cited by 144
Martel, J., Mailhot, A., Brissette, F. P., & Caya, D. (2018) · Journal of Climate · doi:10.1175/jcli-d-17-0282.1 · Cited by 108
The importance of ENSO phase during volcanic eruptions for detection and attribution
Lehner, F., Schurer, A., Hegerl, G. C., Deser, C., & Frölicher, T. L. (2016) · Geophysical Research Letters · doi:10.1002/2016gl067935 · Cited by 106
Causes of Robust Seasonal Land Precipitation Changes*
Polson, D., Hegerl, G. C., Zhang, X., & Osborn, T. J. (2013) · Journal of Climate · doi:10.1175/jcli-d-12-00474.1 · Cited by 81
Self-citationHow Much Information Is Required to Well Constrain Local Estimates of Future Precipitation Extremes?
Li, C., Zwiers, F. W., Zhang, X., & Li, G. (2018) · Earth s Future · doi:10.1029/2018ef001001 · Cited by 80
Self-citationAttributing northern high-latitude precipitation change over the period 1966–2005 to human influence
Wan, H., Zhang, X., Zwiers, F. W., & Min, S. (2014) · Climate Dynamics · doi:10.1007/s00382-014-2423-y · Cited by 69
Self-citationInvestigation of the 2013 Alberta flood from weather and climate perspectives
Teufel, B., Diro, G. T., Whan, K., Milrad, S. M., Jeong, D. I., Ganji, A., Huziy, O., Winger, K., Gyakum, J. R., de Elía, R., et al. (2016) · Climate Dynamics · doi:10.1007/s00382-016-3239-8 · Cited by 63
The Heavy Precipitation Event of December 2015 in Chennai, India
van Oldenborgh, G. J., Otto, F. E. L., Haustein, K., & AchutaRao, K. M. (2016) · Bulletin of the American Meteorological Society · doi:10.1175/bams-d-16-0129.1 · Cited by 60
Quantifying stochastic uncertainty in detection time of human-caused climate signals
Santer, B. D., Fyfe, J. C., Solomon, S., Painter, J. F., Bonfils, C., Pallotta, G., & Zelinka, M. D. (2019) · Proceedings of the National Academy of Sciences · doi:10.1073/pnas.1904586116 · Cited by 54
Confidence intervals in optimal fingerprinting
DelSole, T., Trenary, L., Yan, X., & Tippett, M. K. (2018) · Climate Dynamics · doi:10.1007/s00382-018-4356-3 · Cited by 50
Importance of Framing for Extreme Event Attribution: The Role of Spatial and Temporal Scales
Kirchmeier‐Young, M. C., Wan, H., Zhang, X., & Seneviratne, S. I. (2019) · Earth s Future · doi:10.1029/2019ef001253 · Cited by 46
Self-citationExtreme precipitation in the Netherlands: An event attribution case study
Eden, J., Kew, S., Bellprat, O., Lenderink, G., Manola, I., Omrani, H., & van Oldenborgh, G. J. (2018) · Weather and Climate Extremes · doi:10.1016/j.wace.2018.07.003 · Cited by 45
THE HEAVY PRECIPITATION EVENT OF MAY-JUNE 2013 IN THE UPPER DANUBE AND ELBE BASINS
Schaller, N., Otto, F., van Oldenborgh, G. J., Massey, N., Sparrow, S., & Allen (2014) · Bulletin of the American Meteorological Society · Cited by 34
Attribution of Extreme Rainfall Events in the South of France Using EURO‐CORDEX Simulations
Luu, L. N., Vautard, R., Yiou, P., van Oldenborgh, G. J., & Lenderink, G. (2018) · Geophysical Research Letters · doi:10.1029/2018gl077807 · Cited by 29
Limited evidence of anthropogenic influence on the 2011-12 Extreme Rainfall over Southeast Australia
King, A. D., Lewis, S. C., Perkins-Kirkpatrick, S. E., Alexander, L. V., Donat, M. G., Karoly, D. J., & Black, M. (2013) · ANU Open Research (Australian National University) · Cited by 18
Research works printed but not linked: 2
- U. Lall , “Water” in Impacts, Risks, and Adaptation in the United States: Fourth National ClimateAssessment,D. R. Reidmiller , Eds. (US Global Change Research Program, Washington, DC, 2018), vol. II, pp. 145–173.
- M. R. Allen , “Framing and Context” in Global Warming of 1.5 °C. An IPCC Special Report on the Impacts of Global Warming of 1.5 °C above Pre-industrial Levels and Related Global Greenhouse Gas Emission Pathways, in the Context of Strengthening the Global Response to the Threat of Climate Change, V. Masson-Delmotte , Eds. (Intergovernmental Panel on Climate Change, 2018), in press.
Cited by
Sorted by citations
A Global, Continental, and Regional Analysis of Changes in Extreme Precipitation
Sun, Q., Zhang, X., Zwiers, F. W., Westra, S., & Alexander, L. V. (2020) · Journal of Climate · doi:10.1175/jcli-d-19-0892.1 · Cited by 430
Self-citationSlater, L. J., Anderson, B. J., Buechel, M., Dadson, S., Han, S., Harrigan, S., Kelder, T., Kowal, K., Lees, T., Matthews, T. K. R., et al. (2021) · Hydrology and earth system sciences · doi:10.5194/hess-25-3897-2021 · Cited by 408
Global concurrent climate extremes exacerbated by anthropogenic climate change
Zhou, S., Yu, B., & Zhang, Y. (2023) · Science Advances · doi:10.1126/sciadv.abo1638 · Cited by 333
Martel, J., Brissette, F. P., Lucas‐Picher, P., Troin, M., & Arsenault, R. (2021) · Journal of Hydrologic Engineering · doi:10.1061/(asce)he.1943-5584.0002122 · Cited by 273
Hydroclimate volatility on a warming Earth
Swain, D. L., Prein, A. F., Abatzoglou, J. T., Albano, C. M., Brunner, M. I., Diffenbaugh, N. S., Singh, D., Skinner, C. B., & Touma, D. (2025) · Nature Reviews Earth & Environment · doi:10.1038/s43017-024-00624-z · Cited by 289
Metadata
- Authors
- Kirchmeier-Young, M. C., & Zhang, X.
- Affiliations
- Climate Research Division, Environment and Climate Change Canada, Toronto, ONT M3H 5T4, Canada
- Environment and Climate Change Canada (CA)
- Venue
- Proceedings of the National Academy of Sciences
- Publisher
- National Academy of Sciences
- Published
- 2020-06
- Volume
- 117
- Issue
- 24
- Pages
- 13308-13313
- ISSN
- 0027-8424 (ISSN-L)
- 1091-6490
- PMC
- PMC7306817
- OpenAlex
- W3032529621
- Cited by
- 288
- References
- 38
- Citations by year
- 2026: 26 · 2025: 47 · 2024: 52 · 2023: 60 · 2022: 47 · 2021: 48 · 2020: 8
- FWCI
- 15.17
- Type
- journal article
- Language
- en
- Open access
- hybrid
- doi.org
- Licence
- Locations
- Proceedings of the National Academy of Sciences (publishedVersion, cc-by-nc-nd)
- PubMed Central (publishedVersion, cc-by-nc-nd)
- PubMed (publishedVersion)
- Topics
- Physical Sciences › Environmental Science › Global and Planetary Change › Climate variability and models
- Physical Sciences › Earth and Planetary Sciences › Atmospheric Science › Meteorological Phenomena and Simulations
- Physical Sciences › Environmental Science › Global and Planetary Change › Climate Change and Environmental Impact
- Keywords
- heavy rainfall, anthropogenic climate change attribution, North America, annual maximum precipitation, climate change detection, regional climate model, Earth system models, external forcing
About these checks
Registry, retraction, Cites and statistics results are computed, not judged, with one exception: a printed reference that no index lists is read once by a model before it counts as a citation error. Claims are extracted by a model and kept only when their quote appears verbatim in the text; each cited source is then checked, with a model’s help, for whether it says what the claim relies on. Those verdicts can be wrong — read the claim’s quote and the cited source before relying on one.
Statistics and arithmetic are recomputed, not judged.
Confidence bands are shown only for fields calibrated on our annotated test set. None is calibrated yet, so no band is shown.
What counts as a claim ›How we measure confidence ›How we check this ›
Are you an author, or do you see a problem with this page? Request a review
