

The DOI matches its Crossref record; 4 of the 4 references it cites were found in a registry or an index.
Advanced age increases frequencies of de novo mitochondrial mutations in macaque oocytes and somatic tissues
Abstract
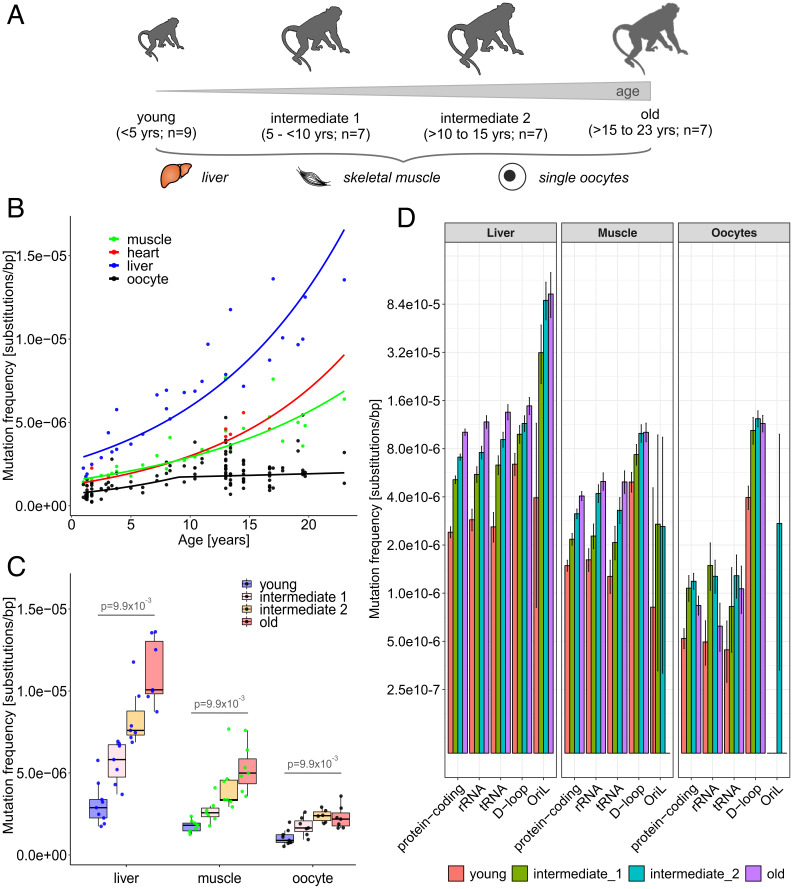
Significance: Multiple human genetic diseases are caused by mutations in the maternally transmitted DNA of mitochondria, the powerhouses of the cell. It is important to study how these mutations arise and accumulate with age, especially because humans in many societies now choose to have children at an older age. However, this is difficult to accomplish in humans, particularly for female germline cells, oocytes. To overcome this limitation, we studied mitochondrial mutation origins and accumulation with age in a primate model species, rhesus macaque. We found that new mutations accumulate the fastest in metabolically active liver and the slowest in oocytes. Thus, primate oocytes might have developed a mechanism to protect their mitochondrial DNA from excessive mutations, allowing reproduction later in life.
Overview
The claims and statistics of this paper haven’t been checked yet.
Run the check — free, no account needed. It reads the open-access text and checks the sources it cites.
Integrity signals
Registry
Cites
Statistics
Figures
Verification
Claims the paper makes
The claims and statistics of this paper haven’t been checked yet.
Run the check — free, no account needed. It reads the open-access text and checks the sources it cites.
Claims other papers make about this one
Each is checked against this paper’s own text: does it say what the citing paper says it does?
The source backs part of the claim, not all of it — or backs it for a different population, condition or comparison.
In the citing paper
“The accelerated expansion of mitochondrial mutations with age has also been observed in both primate oocytes and somatic tissues 20 , as well as in lymphoblasts from patients with neurodegenerative diseases 21 .”
From Hallmarks of aging: An expanding universe (2023) · cites this paper as [20]
Experimental — accuracy not yet measured
Self-check
Percentages, sums and reported differences re-computed from the paper’s own numbers.
The self-check needs the paper’s full text.
Citations
Cites
Mitochondrial proteins: from biogenesis to functional networks
Pfanner, N., Warscheid, B., & Wiedemann, N. (2019) · Nature Reviews Molecular Cell Biology · doi:10.1038/s41580-018-0092-0 · Cited by 1,028
Kennedy, S. R., Salk, J. J., Schmitt, M. W., & Loeb, L. A. (2013) · PLoS Genetics · doi:10.1371/journal.pgen.1003794 · Cited by 363
Random genetic drift determines the level of mutant mtDNA in human primary oocytes
Brown, D. T., Samuels, D. C., Michael, E. M., Turnbull, D. M., & Chinnery, P. F. (2001) · The American Journal of Human Genetics · doi:10.1086/318190 · Cited by 196
Stem cells versus plasticity in liver and pancreas regeneration
Kopp, J. L., Grompe, M., & Sander, M. (2016) · Nature Cell Biology · doi:10.1038/ncb3309 · Cited by 176
Research works printed but not linked: 56
- 10.1146/annurev.genom.6.080604.162249 · DOI
- 10.1016/S0070-2153(06)77004-1 · DOI
- 10.1073/pnas.1409328111 · DOI
- 10.1126/science.aau6520 · DOI
- 10.1038/ng.3469 · DOI
- 10.1101/gr.255174.119 · DOI
- 10.1073/pnas.1906331116 · DOI
- 10.1016/j.ajhg.2011.03.010 · DOI
- M. Ancora , Complete sequence of human mitochondrial DNA obtained by combining multiple displacement amplification and next-generation sequencing on a single oocyte. Mitochondrial DNA A. DNA Mapp. Seq. Anal. 28, 180–181 (2017).
- 10.1093/humrep/dex268 · DOI
- 10.1371/journal.pbio.3000745 · DOI
- 10.1146/annurev-genom-091416-035426 · DOI
- 10.1016/S0891-5849(98)00323-2 · DOI
- 10.1126/science.1102541 · DOI
- 10.1002/ajp.1350090203 · DOI
- E. P. Walker, R. M. Nowak, J. L. Paradiso, Walker’s Mammals of the World (John Hopkins University Press, 1983).
- 10.1073/pnas.1208715109 · DOI · Paper page
- 10.1186/s12859-020-3419-8 · DOI
- 10.1073/pnas.1419651112 · DOI
- 10.1371/journal.pgen.1003990 · DOI
- 10.1371/journal.pgen.1000209 · DOI
- 10.1098/rstb.2019.0175 · DOI
- 10.1098/rsbl.2009.0104 · DOI
- 10.1016/B978-0-12-381365-7.00008-X · DOI
- 10.1093/biolre/ioaa194 · DOI
- 10.1093/humupd/dmw028 · DOI
- 10.1101/gr.204255.116 · DOI
- 10.1038/s41467-019-12023-w · DOI
- 10.1073/pnas.1600374113 · DOI
- 10.1038/s41536-018-0044-5 · DOI
- 10.1016/S0021-9258(18)62305-1 · DOI · Paper page
- 10.1111/j.1474-9726.2008.00426.x · DOI
- 10.1016/j.cell.2015.05.026 · DOI
- 10.1016/j.cell.2005.04.028 · DOI
- 10.1016/j.mrfmmm.2005.12.012 · DOI · Paper page
- 10.1093/nar/gky456 · DOI
- 10.1073/pnas.95.7.3578 · DOI
- 10.1042/EBC20170100 · DOI
- 10.1016/S0092-8674(00)80688-1 · DOI
- 10.1371/journal.pbio.3000263 · DOI
- 10.3390/cells10092484 · DOI
- 10.3389/fgene.2017.00166 · DOI · Paper page
- 10.1038/srep23421 · DOI
- 10.1016/j.bbrc.2019.04.100 · DOI
- 10.1093/nar/gkz762 · DOI
- 10.1073/pnas.1009687108 · DOI
- 10.1038/ng.2702 · DOI
- 10.1016/j.molcel.2009.12.021 · DOI
- 10.1016/S0021-9258(19)69373-7 · DOI
- 10.1073/pnas.0805399105 · DOI
- 10.1038/embor.2012.161 · DOI
- 10.1093/nar/gkaa1269 · DOI · Paper page
- 10.1371/journal.pgen.1003929 · DOI
- 10.1038/s42255-021-00378-8 · DOI
- 10.1534/genetics.118.300711 · DOI
- B. Arbeithuber Raw sequencing reads. Sequence Read Archive. https://www.ncbi.nlm.nih.gov/sra/?term=PRJNA777828. Deposited 8 October 2021.
Cited by
Sorted by citations
Hallmarks of aging: An expanding universe
López-Otín, C., Blasco, M. A., Partridge, L., Serrano, M., & Kroemer, G. (2023) · Cell · doi:10.1016/j.cell.2022.11.001 · Cited by 6,549
Metadata
- Authors
- Arbeithuber, B., Cremona, M. A., Hester, J., Barrett, A., Higgins, B., Anthony, K., Chiaromonte, F., Diaz, F. J., & Makova, K. D.
- Affiliations
- Department of Biology, The Pennsylvania State University, University Park, PA 16802
- Department of Operations and Decision Systems, Université Laval, Québec, QC G1V0A6, Canada
- Department of Animal Science, The Pennsylvania State University, University Park, PA 16802
- Center for Medical Genomics, The Pennsylvania State University, University Park, PA 16802
- Venue
- Proceedings of the National Academy of Sciences
- Publisher
- National Academy of Sciences
- Published
- 2022-04-08
- Volume
- 119
- Issue
- 15
- ISSN
- 0027-8424
- 1091-6490
- PMC
- PMC9169796
- Cited by
- 40
- References
- 4
- Language
- en
- Funders
- HHS | National Institutes of Health (R01GM116044)
About these checks
Registry, retraction, Cites and statistics results are computed, not judged, with one exception: a printed reference that no index lists is read once by a model before it counts as a citation error. Claims are extracted by a model and kept only when their quote appears verbatim in the text; each cited source is then checked, with a model’s help, for whether it says what the claim relies on. Those verdicts can be wrong — read the claim’s quote and the cited source before relying on one.
Statistics and arithmetic are recomputed, not judged.
Confidence bands are shown only for fields calibrated on our annotated test set. None is calibrated yet, so no band is shown.
What counts as a claim ›How we measure confidence ›How we check this ›
Are you an author, or do you see a problem with this page? Request a review
