

The DOI matches its Crossref record; 34 of the 34 references it cites were found in a registry or an index.
A hypothalamic pathway for Augmentor α -controlled body weight regulation
Abstract
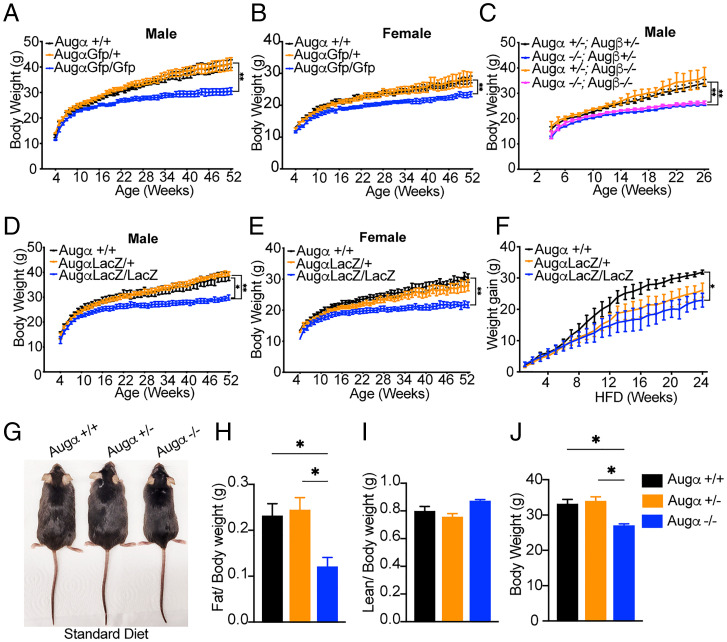
Augmentor α and β (Augα and Augβ) are newly discovered ligands of the receptor tyrosine kinases Alk and Ltk. Augα functions as a dimeric ligand that binds with high affinity and specificity to Alk and Ltk. However, a monomeric Augα fragment and monomeric Augβ also bind to Alk and potently stimulate cellular responses. While previous studies demonstrated that oncogenic Alk mutants function as important drivers of a variety of human cancers, the physiological roles of Augα and Augβ are poorly understood. Here, we investigate the physiological roles of Augα and Augβ by exploring mice deficient in each or both Aug ligands. Analysis of mutant mice showed that both Augα single knockout and double knockout of Augα and Augβ exhibit a similar thinness phenotype and resistance to diet-induced obesity. In the Augα-knockout mice, the leanness phenotype is coupled to increased physical activity. By contrast, Augβ-knockout mice showed similar weight curves as the littermate controls. Experiments are presented demonstrating that Augα is robustly expressed and metabolically regulated in agouti-related peptide (AgRP) neurons, cells that control whole-body energy homeostasis in part via their projections to the paraventricular nucleus (PVN). Moreover, both Alk and melanocortin receptor-4 are expressed in discrete neuronal populations in the PVN and are regulated by projections containing Augα and AgRP, respectively, demonstrating that two distinct mechanisms that regulate pigmentation operate in the hypothalamus to control body weight. These experiments show that Alk-driven cancers were co-opted from a neuronal pathway in control of body weight, offering therapeutic opportunities for metabolic diseases and cancer.
Overview
The claims and statistics of this paper haven’t been checked yet.
Run the check — free, no account needed. It reads the open-access text and checks the sources it cites.
Integrity signals
Registry
Cites
Statistics
Figures



Verification
Claims the paper makes
The claims and statistics of this paper haven’t been checked yet.
Run the check — free, no account needed. It reads the open-access text and checks the sources it cites.
Claims other papers make about this one
Each is checked against this paper’s own text: does it say what the citing paper says it does?
The source backs part of the claim, not all of it — or backs it for a different population, condition or comparison.
In the citing paper
“and in humans, a loss-of-function mutation of ALK is associated with leanness 135,136 .”
From Hallmarks of aging: An expanding universe (2023) · cites this paper as [136]
Experimental — accuracy not yet measured
Self-check
Percentages, sums and reported differences re-computed from the paper’s own numbers.
The self-check needs the paper’s full text.
Citations
Cites
Integrated analysis of multimodal single-cell data
Hao, Y., Hao, S., Andersen-Nissen, E., Mauck, W. M., Zheng, S., Butler, A., Lee, M. J., Wilk, A. J., Darby, C., Zagar, M., et al. (2020) · doi:10.1101/2020.10.12.335331 · Cited by 15,508
Cell Signaling by Receptor Tyrosine Kinases
Lemmon, M. A., & Schlessinger, J. (2010) · Cell · doi:10.1016/j.cell.2010.06.011 · Cited by 7,929
Self-citationGenome-wide atlas of gene expression in the adult mouse brain
Lein, E. S., Hawrylycz, M. J., Ao, N., Ayres, M., Bensinger, A., Bernard, A., Boe, A. F., Boguski, M. S., Brockway, K. S., Byrnes, E. J., et al. (2007) · Nature · doi:10.1038/nature05453 · Cited by 5,572
UpSetR: an R package for the visualization of intersecting sets and their properties
Conway, J. R., Lex, A., & Gehlenborg, N. (2017) · Bioinformatics · doi:10.1093/bioinformatics/btx364 · Cited by 3,586
Central nervous system control of food intake and body weight
Morton, G. J., Cummings, D. E., Baskin, D. G., Barsh, G. S., & Schwartz, M. W. (2006) · Nature · doi:10.1038/nature05026 · Cited by 2,503
Fusion of a Kinase Gene, ALK , to a Nucleolar Protein Gene, NPM , in Non-Hodgkin's Lymphoma
Morris, S. W., Kirstein, M. N., Valentine, M. B., Dittmer, K. G., Shapiro, D. N., Saltman, D. L., & Look, A. T. (1994) · Science · doi:10.1126/science.8122112 · Cited by 2,409
NPY/AgRP Neurons Are Essential for Feeding in Adult Mice but Can Be Ablated in Neonates
Luquet, S., Perez, F. A., Hnasko, T. S., & Palmiter, R. D. (2005) · Science · doi:10.1126/science.1115524 · Cited by 1,125
A molecular census of arcuate hypothalamus and median eminence cell types
Campbell, J. N., Macosko, E. Z., Fenselau, H., Pers, T. H., Lyubetskaya, A., Tenen, D., Goldman, M., Verstegen, A. M. J., Resch, J. M., McCarroll, S. A., et al. (2017) · Nature Neuroscience · doi:10.1038/nn.4495 · Cited by 817
Agouti-related peptide–expressing neurons are mandatory for feeding
Gropp, E., Shanabrough, M., Borok, E., Xu, A. W., Janoschek, R., Buch, T., Plum, L., Balthasar, N., Hampel, B., Waisman, A., et al. (2005) · Nature Neuroscience · doi:10.1038/nn1548 · Cited by 798
Self-citationMechanistic insight into ALK receptor tyrosine kinase in human cancer biology
Hallberg, B., & Palmer, R. H. (2013) · Nature Reviews Cancer · doi:10.1038/nrc3580 · Cited by 645
Research works printed but not linked: 1
- 10.1016/j.cell.2021.04.048 · doi:10.1016/j.cell.2021.04.048 · Paper page
Cited by
Hallmarks of aging: An expanding universe
López-Otín, C., Blasco, M. A., Partridge, L., Serrano, M., & Kroemer, G. (2023) · Cell · doi:10.1016/j.cell.2022.11.001 · Cited by 6,549
Sukumar, S. K., Antonydhason, V., Molander, L., Sandakly, J., Umapathy, G., Mendoza-Garcia, P., Masudi, T., Schlossser, A., Nässel, D. R., Wegener, C., et al. (2023) · doi:10.7554/elife.88985.1 · Cited by 1
Metadata
- Authors
- Ahmed, M., Kaur, N., Cheng, Q., Shanabrough, M., Tretiakov, E. O., Harkany, T., Horvath, T. L., & Schlessinger, J.
- Affiliations
- Department of Pharmacology, Yale School of Medicine, New Haven, CT 06520
- Department of Neuroscience, Yale School of Medicine, New Haven, CT 06520
- Department of Comparative Medicine, Yale School of Medicine, New Haven, CT 06520
- Department of Molecular Neurosciences, Medical University of Vienna, 1010 Vienna, Austria
- Venue
- Proceedings of the National Academy of Sciences
- Publisher
- National Academy of Sciences
- Published
- 2022-04-11
- Volume
- 119
- Issue
- 16
- ISSN
- 0027-8424
- 1091-6490
- PMC
- PMC9169862
- Cited by
- 25
- References
- 34
- Language
- en
- Update notices
- correction (2022-07-05)
- Funders
- HHS | National Institutes of Health (AG052005, AG067329, DK126447)
About these checks
Registry, retraction, Cites and statistics results are computed, not judged, with one exception: a printed reference that no index lists is read once by a model before it counts as a citation error. Claims are extracted by a model and kept only when their quote appears verbatim in the text; each cited source is then checked, with a model’s help, for whether it says what the claim relies on. Those verdicts can be wrong — read the claim’s quote and the cited source before relying on one.
Statistics and arithmetic are recomputed, not judged.
Confidence bands are shown only for fields calibrated on our annotated test set. None is calibrated yet, so no band is shown.
What counts as a claim ›How we measure confidence ›How we check this ›
Are you an author, or do you see a problem with this page? Request a review
How to cite
Cite CoChat for the checks on this page, and the paper for its own findings.
- This page
- CoChat. (2026). Citation check: A hypothalamic pathway for Augmentor α -controlled body weight regulation. https://app.cochat.ai/papers/10.1073/pnas.2200476119
- The paper
- Ahmed, M., Kaur, N., Cheng, Q., Shanabrough, M., Tretiakov, E. O., Harkany, T., Horvath, T. L., & Schlessinger, J. (2022). A hypothalamic pathway for Augmentor α -controlled body weight regulation. Proceedings of the National Academy of Sciences. https://doi.org/10.1073/pnas.2200476119
Data sources
Bibliographic data: Semantic Scholar, OpenAlex, Crossref.
Contains information from the Semantic Scholar Academic Graph Datasets, made available under the ODC Attribution License (ODC-BY 1.0).
Semantic Scholar’s data is described in: Kinney, R., et al. (2023). The Semantic Scholar Open Data Platform. arXiv:2301.10140.
