

The DOI matches its Crossref record; 6 of the 6 references it cites were found in a registry or an index.
Curvature-mediated rapid extravasation and penetration of nanoparticles against interstitial fluid pressure for improved drug delivery
Abstract
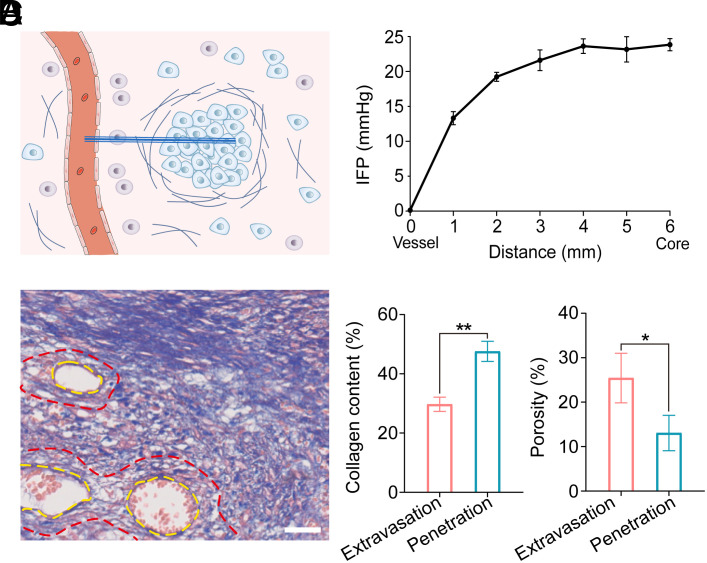
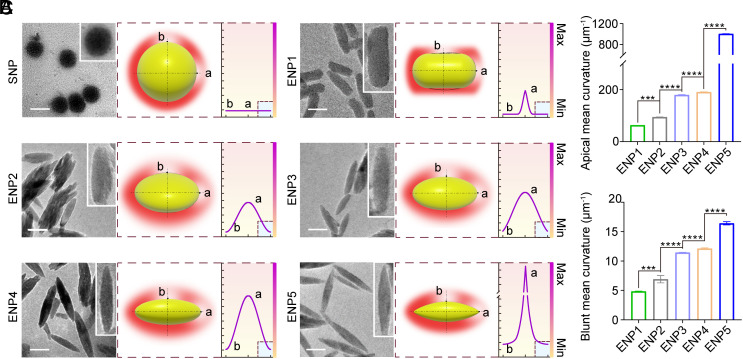
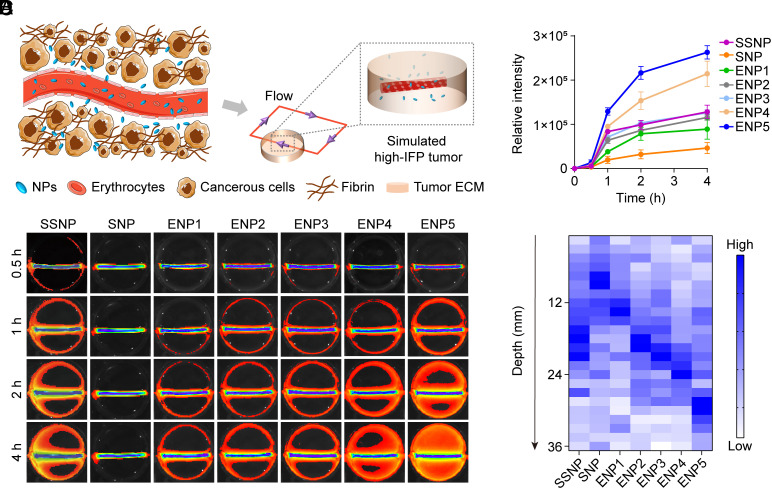
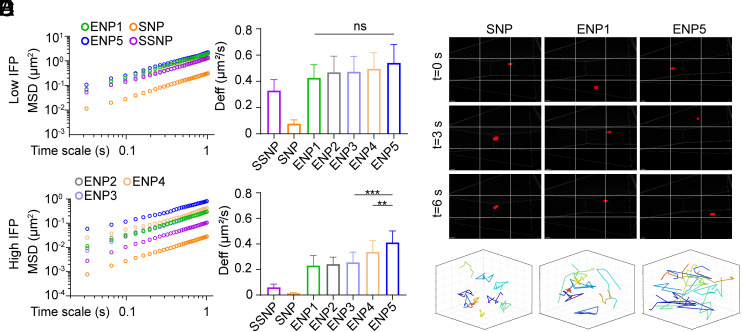
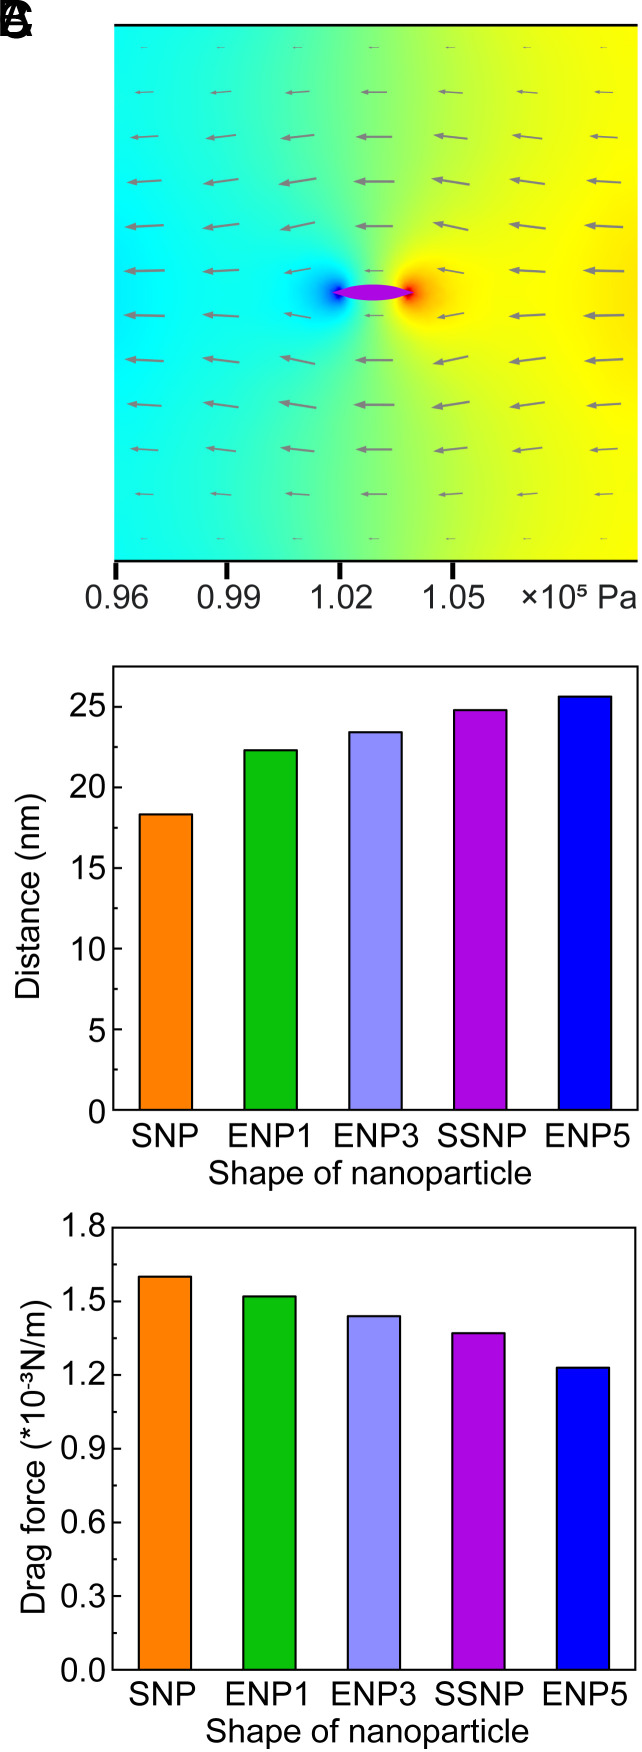
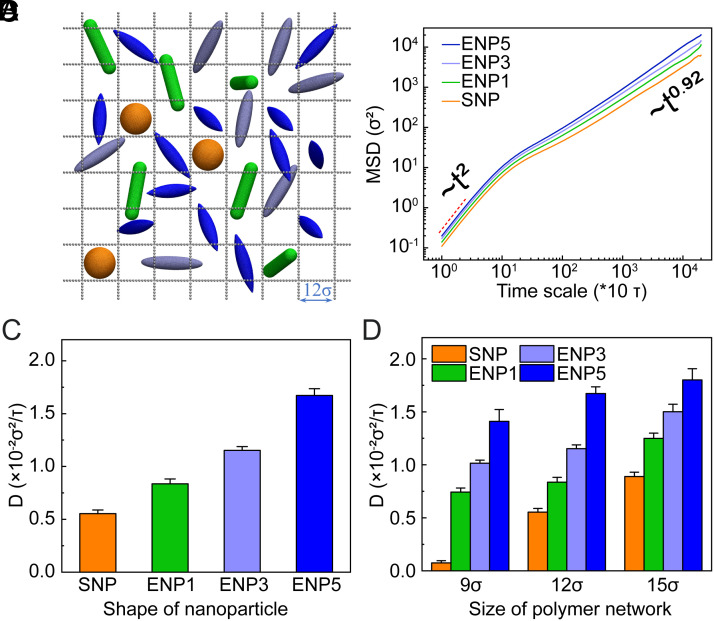
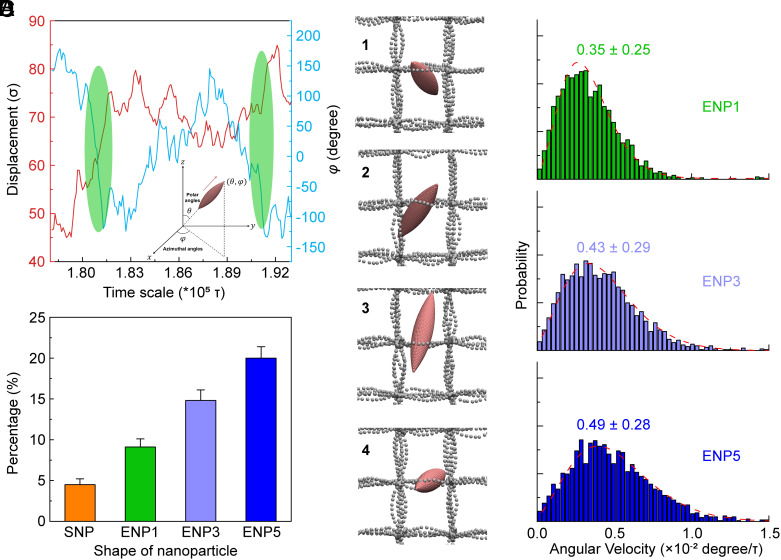
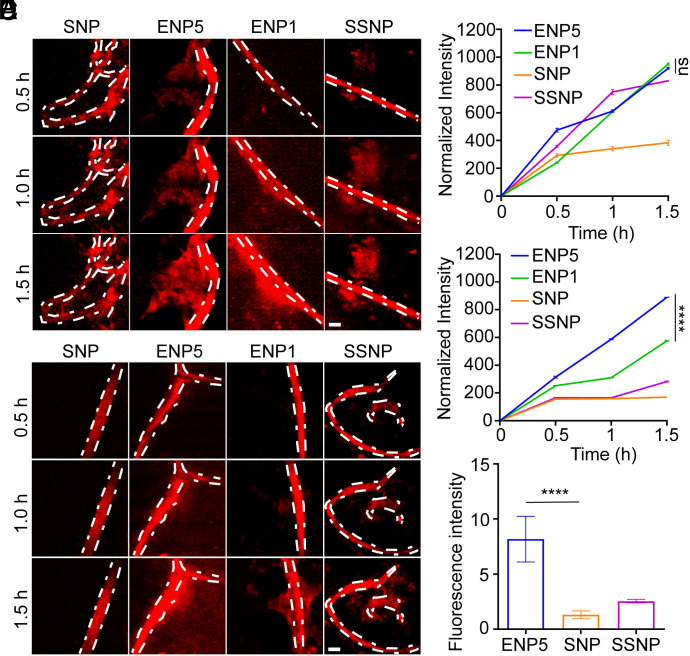
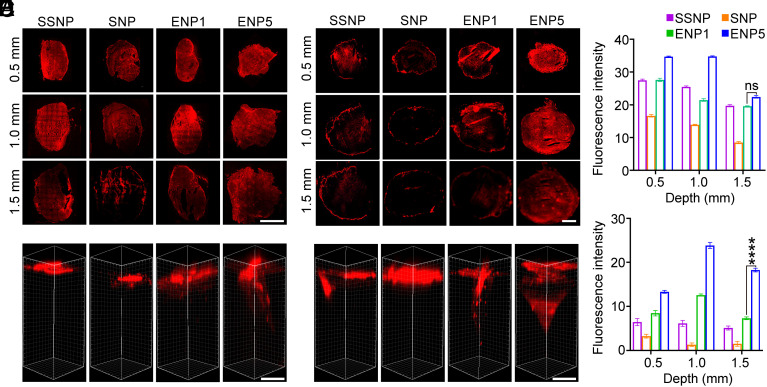
Elevated interstitial fluid pressure (IFP) within pathological tissues (e.g., tumors, obstructed kidneys, and cirrhotic livers) creates a significant hindrance to the transport of nanomedicine, ultimately impairing the therapeutic efficiency. Among these tissues, solid tumors present the most challenging scenario. While several strategies through reducing tumor IFP have been devised to enhance nanoparticle delivery, few approaches focus on modulating the intrinsic properties of nanoparticles to effectively counteract IFP during extravasation and penetration, which are precisely the stages obstructed by elevated IFP. Herein, we propose an innovative solution by engineering nanoparticles with a fusiform shape of high curvature, enabling efficient surmounting of IFP barriers during extravasation and penetration within tumor tissues. Through experimental and theoretical analyses, we demonstrate that the elongated nanoparticles with the highest mean curvature outperform spherical and rod-shaped counterparts against elevated IFP, leading to superior intratumoral accumulation and antitumor efficacy. Super-resolution microscopy and molecular dynamics simulations uncover the underlying mechanisms in which the high curvature contributes to diminished drag force in surmounting high-pressure differentials during extravasation. Simultaneously, the facilitated rotational movement augments the hopping frequency during penetration. This study effectively addresses the limitations posed by high-pressure impediments, uncovers the mutual interactions between the physical properties of NPs and their environment, and presents a promising avenue for advancing cancer treatment through nanomedicine.
Overview
The claims and statistics of this paper haven’t been checked yet.
Run the check — free, no account needed. It reads the open-access text and checks the sources it cites.
Integrity signals
Registry
Cites
Statistics
Figures
Verification
Claims the paper makes
The claims and statistics of this paper haven’t been checked yet.
Run the check — free, no account needed. It reads the open-access text and checks the sources it cites.
Claims other papers make about this one
Each is checked against this paper’s own text: does it say what the citing paper says it does?
The source backs part of the claim, not all of it — or backs it for a different population, condition or comparison.
In the citing paper
“ENP5 fusiform CaP | High-curvature geometry (apical mean curvature 1,004.8 µm⁻1) to reduce viscous drag | Huh-7 hepatocellular carcinoma | Pressure-limited extravasation and matrix tortuosity | Matrix transport assay; penetration enhancement factor increased by 12.2 times | — | [51]”
From Overcoming tumor microenvironment barriers: transformable and bioinspired nanomedicine strategies for deep tumor penetration (2026) · cites this paper as [51]
Experimental — accuracy not yet measuredIn the citing paper
“Geometry engineering via high-curvature fusiform CaP (ENP5) lowers hydrodynamic drag, enabling long-range matrix traversal (over ~ 1.5 mm across the perivascular matrix in Huh-7 xenografts) enabling long-range matrix traversal and potent antitumor activity”
From Overcoming tumor microenvironment barriers: transformable and bioinspired nanomedicine strategies for deep tumor penetration (2026) · cites this paper as [51]
Self-check
Percentages, sums and reported differences re-computed from the paper’s own numbers.
The self-check needs the paper’s full text.
Citations
Cites
Cellular and molecular mechanisms of fibrosis
Wynn, T. (2008) · The Journal of Pathology · doi:10.1002/path.2277 · Cited by 4,495
The extracellular matrix: A dynamic niche in cancer progression
Lu, P., Weaver, V. M., & Werb, Z. (2012) · Journal of Cell Biology · doi:10.1083/jcb.201102147 · Cited by 3,024
High Interstitial Fluid Pressure - an Obstacle in Cancer Therapy
Heldin, C.-H., Rubin, K., Pietras, K., & Östman, A. (2004) · Nature reviews. Cancer · doi:10.1038/nrc1456 · Cited by 2,222
Liver fibrosis – from bench to bedside
Friedman, S. L. (2003) · Journal of Hepatology · doi:10.1016/s0168-8278(02)00429-4 · Cited by 1,780
Analysis of Fusobacterium persistence and antibiotic response in colorectal cancer
Bullman, S., Pedamallu, C. S., Sicinska, E., Clancy, T. E., Zhang, X., Cai, D., Neuberg, D., Huang, K., Guevara, F., Nelson, T., et al. (2017) · Science · doi:10.1126/science.aal5240 · Cited by 1,574
Self-citationKharaishvili, G., Simkova, D., Bouchalova, K., Gachechiladze, M., Narsia, N., & Bouchal, J. (2014) · Cancer Cell International · doi:10.1186/1475-2867-14-41 · Cited by 197
Research works printed but not linked: 42
- 10.1152/advan.00084.2006 · DOI
- 10.1016/j.jinf.2016.04.009 · DOI
- 10.3390/biology12070942 · DOI
- 10.1016/j.addr.2023.115051 · DOI
- 10.1016/j.jconrel.2022.12.051 · DOI
- 10.1021/acsnano.1c03048 · DOI
- Y. Chen , Therapeutic remodeling of the tumor microenvironment enhances nanoparticle delivery. Adv. Sci. (Weinh.) 6, 1802070 (2019).
- 10.1016/j.tranon.2019.05.012 · DOI
- M. Milosevic , Interstitial fluid pressure predicts survival in patients with cervix cancer independent of clinical prognostic factors and tumor oxygen measurements. Cancer Res. 61, 6400–6405 (2001).
- 10.1016/j.bbcan.2022.188792 · DOI
- 10.1016/j.biomaterials.2020.119902 · DOI
- 10.1016/j.apsb.2022.08.013 · DOI
- 10.1038/s41563-020-0669-9 · DOI
- 10.1038/natrevmats.2016.14 · DOI · Paper page
- 10.1016/j.addr.2022.114614 · DOI
- C. Brekken, M. H. Hjelstuen, Ø. S. Bruland, C. de Lange Davies, Hyaluronidase-induced periodic modulation of the interstitial fluid pressure increases selective antibody uptake in human osteosarcoma xenografts. Anticancer Res. 20, 3513–3519 (2000).
- 10.1016/S0304-3835(98)00202-X · DOI
- 10.1016/j.jconrel.2020.02.024 · DOI
- Z. Jiang , Nanomedicine potentiates mild photothermal therapy for tumor ablation. Asian J. Pharmaceut. Sci. 16, 738–761 (2021).
- 10.1021/acsnano.5b02028 · DOI
- 10.18632/oncotarget.5092 · DOI
- 10.1038/s42003-020-0917-1 · DOI
- 10.1053/j.gastro.2017.01.024 · DOI
- 10.1126/science.abc1464 · DOI
- 10.1016/j.biopha.2017.02.102 · DOI
- 10.1016/j.cell.2022.02.019 · DOI
- 10.1115/1.4034991 · DOI
- 10.1016/j.apsb.2021.03.033 · DOI
- 10.3390/ma14051291 · DOI
- 10.1007/s40089-014-0126-3 · DOI
- 10.1016/j.physleta.2014.04.060 · DOI
- 10.1021/acs.nanolett.6b03515 · DOI
- 10.1126/sciadv.aay9937 · DOI
- 10.1073/pnas.1818924116 · DOI
- 10.1016/j.cclet.2022.107828 · DOI
- 10.1073/pnas.2209260120 · DOI
- 10.1038/s41467-018-05061-3 · DOI
- 10.1126/sciadv.aba2458 · DOI
- 10.1016/j.jtbi.2012.11.031 · DOI
- 10.1016/j.cclet.2020.11.006 · DOI
- 10.1016/j.cclet.2020.02.036 · DOI
- 10.1038/s41565-020-0759-5 · DOI
Cited by
Sorted by citations
Sheng, J., Yuan, W., Zhang, M., Chen, Z., Qi, Y., Zhao, Y., & Zhang, S. (2026) · Journal of Nanobiotechnology · doi:10.1186/s12951-026-04028-7 · Cited by 35
Metadata
- Authors
- Jiang, X., Xu, S., Miao, Y., Huang, K., Wang, B., Ding, B., Zhang, Z., Zhao, Z., Zhang, X., Shi, X., Yu, M., Tian, F., & Gan, Y.
- Venue
- Proceedings of the National Academy of Sciences
- Publisher
- National Academy of Sciences
- Published
- 2024-05-20
- Volume
- 121
- Issue
- 22
- ISSN
- 0027-8424
- 1091-6490
- PMC
- PMC11145294
- Cited by
- 57
- References
- 6
- Language
- en
- Funders
- MOST | NSFC | National Science Fund for Distinguished Young Scholars (82025032)
- MOST | National Natural Science Foundation of China (82073773, 12272101)
- MOST | National Key Research and Development Program of China (2022YFA1203200)
- "Open Competition to Select the Best Candidates" Key Technology Program for Nucleic Acid Drugs of NCTIB (NCTIB2022HS01006)
- Key Research Program of Chinese Academy of Sciences (ZDBS-ZRKJZ-TLC005)
- Young Elite Scientists Sponsorship Program by CAST (2022QNRC001)
About these checks
Registry, retraction, Cites and statistics results are computed, not judged, with one exception: a printed reference that no index lists is read once by a model before it counts as a citation error. Claims are extracted by a model and kept only when their quote appears verbatim in the text; each cited source is then checked, with a model’s help, for whether it says what the claim relies on. Those verdicts can be wrong — read the claim’s quote and the cited source before relying on one.
Statistics and arithmetic are recomputed, not judged.
Confidence bands are shown only for fields calibrated on our annotated test set. None is calibrated yet, so no band is shown.
What counts as a claim ›How we measure confidence ›How we check this ›
Are you an author, or do you see a problem with this page? Request a review
