

The DOI matches its Crossref record; 1 of the 1 references it cites were found in a registry or an index.
Quantitative Dissection of the Binding Contributions of Ligand Lysines of the Receptor-associated Protein (RAP) to the Low Density Lipoprotein Receptor-related Protein (LRP1)
Overview
The claims and statistics of this paper haven’t been checked yet.
Run the check — free, no account needed. It reads the open-access text and checks the sources it cites.
Integrity signals
Registry
Cites
Statistics
Figures
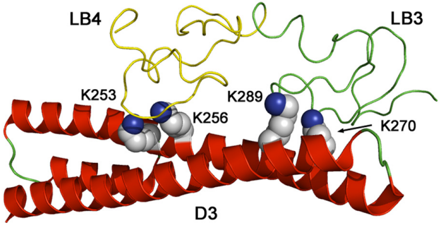
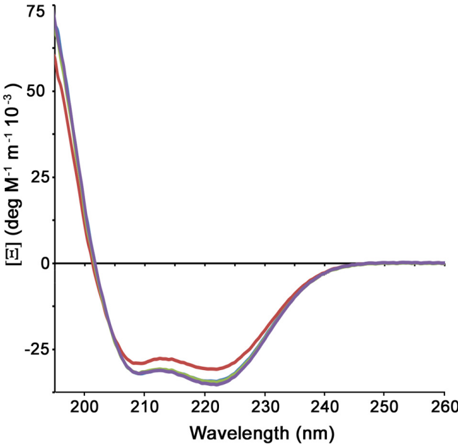
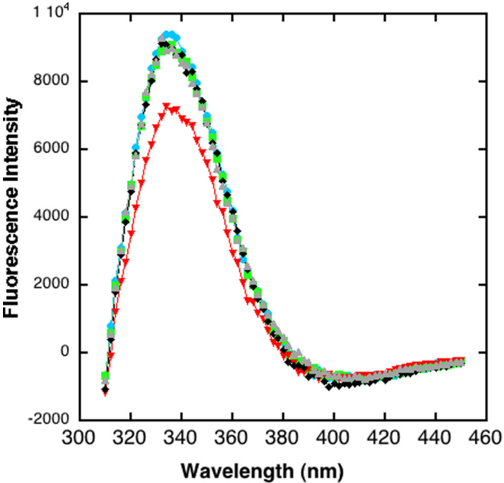
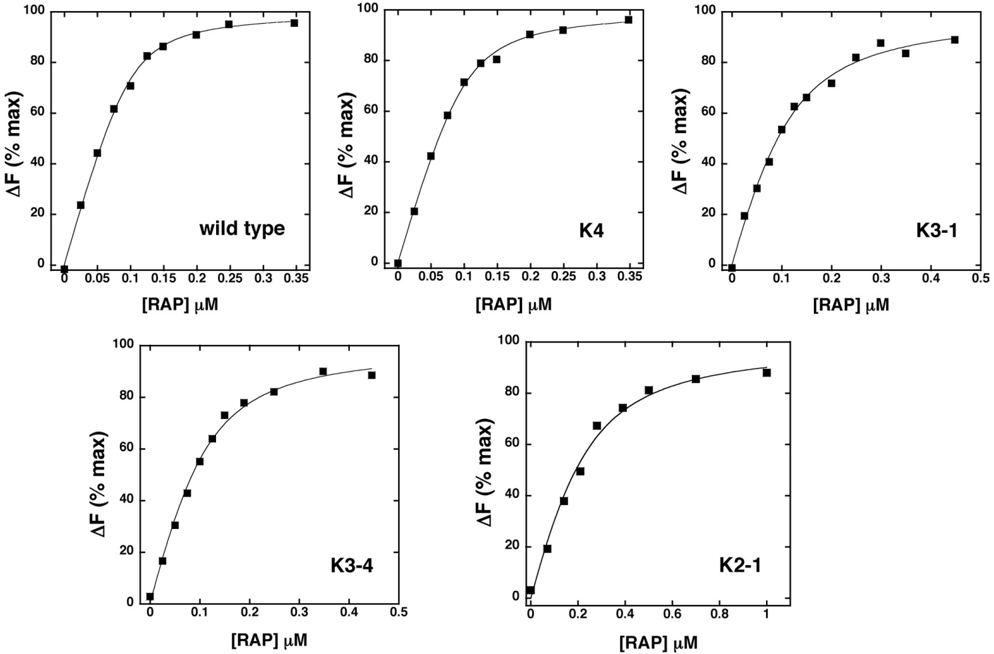

Verification
Claims the paper makes
The claims and statistics of this paper haven’t been checked yet.
Run the check — free, no account needed. It reads the open-access text and checks the sources it cites.
Claims other papers make about this one
Each is checked against this paper’s own text: does it say what the citing paper says it does?
The cited source says what the claim attributes to it.
In the citing paper
“Point mutations of key residues in RAP needed for its interaction with LRP110 (K256A, K270A – “mtRAP”) were sufficient to reduce this competitive effect (Extended Data Fig. 2a,b).”
From LRP1 is a master regulator of tau uptake and spread (2020) · cites this paper as [10]
Self-check
Percentages, sums and reported differences re-computed from the paper’s own numbers.
The self-check needs the paper’s full text.
Citations
Cites
Three-Dimensional Structure of the LDL Receptor-Binding Domain of Human Apolipoprotein E
Wilson, C., Wardell, M. R., Weisgraber, K. H., Mahley, R. W., & Agard, D. A. (1991) · Science · doi:10.1126/science.2063194 · Cited by 678
Research works printed but not linked: 25
- Herz, 2001, LRP. A multifunctional scavenger and signaling receptor, J. Clin. Invest, 108, 779, 10.1172/JCI200113992 · DOI · Paper page
- Nielsen, 1996, Identification of residues in α-macroglobulins important for binding to the α2-macroglobulin receptor/Low density lipoprotein receptor-related protein, J. Biol. Chem, 271, 12909, 10.1074/jbc.271.22.12909 · DOI
- Migliorini, 2003, Allosteric modulation of ligand binding to low density lipoprotein receptor-related protein by the receptor-associated protein requires critical lysine residues within its carboxyl-terminal domain, J. Biol. Chem, 278, 17986, 10.1074/jbc.M212592200 · DOI
- Arandjelovic, 2005, Mutation of lysine 1370 in full-length human α2-macroglobulin blocks binding to the low density lipoprotein receptor-related protein-1, Arch. Biochem. Biophys, 438, 29, 10.1016/j.abb.2005.03.019 · DOI
- Sarafanov, 2006, Identification of coagulation factor VIII A2 domain residues forming the binding epitope for low-density lipoprotein receptor-related protein, Biochemistry, 45, 1829, 10.1021/bi0520380 · DOI
- Jensen, 2006, Binding site structure of one LRP-RAP complex. Implications for a common ligand-receptor binding motif, J. Mol. Biol, 362, 700, 10.1016/j.jmb.2006.07.013 · DOI
- Dolmer, 2006, Three complement-like repeats compose the complete α2-macroglobulin binding site in the second ligand binding cluster of the low density lipoprotein receptor-related protein, J. Biol. Chem, 281, 34189, 10.1074/jbc.M604389200 · DOI
- Yasui, 2010, Structural basis for specific recognition of reelin by its receptors, Structure, 18, 320, 10.1016/j.str.2010.01.010 · DOI
- van den Biggelaar, 2011, A single lysine of the two-lysine recognition motif of the D3 domain of receptor-associated protein is sufficient to mediate endocytosis by low-density lipoprotein receptor-related protein, Int. J. Biochem. Cell Biol, 43, 431, 10.1016/j.biocel.2010.11.017 · DOI
- Guttman, 2010, Structure of the minimal interface between ApoE and LRP, J. Mol. Biol, 398, 306, 10.1016/j.jmb.2010.03.022 · DOI
- Gettins, 2012, A proximal pair of positive charges provides the dominant ligand-binding contribution to complement-like domains from the LRP (low-density lipoprotein receptor-related protein), Biochem. J, 443, 65, 10.1042/BJ20111867 · DOI
- Horn, 1998, Plasminogen activator inhibitor 1 contains a cryptic high affinity receptor binding site that is exposed upon complex formation with tissue-type plasminogen activator, Thromb. Haemost, 80, 822, 10.1055/s-0037-1615365 · DOI
- Fisher, 2006, Structure of an LDLR-RAP complex reveals a general mode for ligand recognition by lipoprotein receptors, Mol. Cell, 22, 277, 10.1016/j.molcel.2006.02.021 · DOI · Paper page
- Estrada, 2008, Unfolding of the RAP-D3 helical bundle facilitates dissociation of RAP-receptor complexes, Biochemistry, 47, 1532, 10.1021/bi702076y · DOI
- Beglova, 2001, Backbone dynamics of a module pair from the ligand-binding domain of the LDL receptor, Biochemistry, 40, 2808, 10.1021/bi0027276 · DOI
- Jensen, 2009, Receptor-associated protein (RAP) has two high-affinity binding sites for the low-density lipoprotein receptor-related protein (LRP). Consequences for the chaperone functions of RAP, Biochem. J, 421, 273, 10.1042/BJ20090175 · DOI · Paper page
- Lee, 2006, RAP uses a histidine switch to regulate its interaction with LRP in the ER and Golgi, Mol. Cell, 22, 423, 10.1016/j.molcel.2006.04.011 · DOI
- Andersen, 2001, Analysis of a two-domain binding site for the urokinase-type plasminogen activator-plasminogen activator inhibitor-1 complex in low-density-lipoprotein-receptor-related protein, Biochem. J, 357, 289, 10.1042/bj3570289 · DOI
- Jensen, 2009, Specificity of binding of the low density lipoprotein receptor-related protein to different conformational states of the clade E serpins plasminogen activator inhibitor-1 and proteinase nexin-1, J. Biol. Chem, 284, 17989, 10.1074/jbc.M109.009530 · DOI
- Lazic, 2006, Dissection of RAP-LRP interactions. Binding of RAP and RAP fragments to complement-like repeats 7 and 8 from ligand binding cluster II of LRP, Arch. Biochem. Biophys, 450, 167, 10.1016/j.abb.2006.04.007 · DOI
- Guttman, 2011, The structure, dynamics, and binding of the LA45 module pair of the low-density lipoprotein receptor suggest an important role for LA4 in ligand release, Biochemistry, 50, 11001, 10.1021/bi2014486 · DOI
- Fass, 1997, Molecular basis of familial hypercholesterolaemia from structure of LDL receptor module, Nature, 388, 691, 10.1038/41798 · DOI
- Huang, 1999, NMR solution structure of complement-like repeat CR8 from the low density lipoprotein receptor-related protein, J. Biol. Chem, 274, 14130, 10.1074/jbc.274.20.14130 · DOI
- Dolmer, 2000, NMR solution structure of complement-like repeat CR3 from the low density lipoprotein receptor-related protein. Evidence for specific binding to the receptor binding domain of human α2-macroglobulin, J. Biol. Chem, 275, 3264, 10.1074/jbc.275.5.3264 · DOI
- Simonovic, 2001, Calcium coordination and pH dependence of the calcium affinity of ligand-binding repeat CR7 from the LRP. Comparison with related domains from the LRP and the LDL receptor, Biochemistry, 40, 15127, 10.1021/bi015688m · DOI
Cited by
Sorted by citations
LRP1 is a master regulator of tau uptake and spread
Rauch, J. N., Luna, G., Guzman, E., Audouard, M., Challis, C., Sibih, Y. E., Leshuk, C., Hernandez, I., Wegmann, S., Hyman, B. T., et al. (2020) · Nature · doi:10.1038/s41586-020-2156-5 · Cited by 541
Cooper, J. M., Lathuiliere, A., Migliorini, M., Arai, A. L., Wani, M. M., Dujardin, S., Muratoglu, S. C., Hyman, B. T., & Strickland, D. K. (2021) · Journal of Biological Chemistry · doi:10.1016/j.jbc.2021.100715 · Cited by 122
Metadata
- Authors
- Dolmer, K., Campos, A., & Gettins, P. G. W.
- Venue
- Journal of Biological Chemistry
- Publisher
- Elsevier BV
- Published
- 2013-08
- Volume
- 288
- Issue
- 33
- Pages
- 24081-24090
- ISSN
- 0021-9258
- Cited by
- 26
- References
- 1
- Language
- en
About these checks
Registry, retraction, Cites and statistics results are computed, not judged, with one exception: a printed reference that no index lists is read once by a model before it counts as a citation error. Claims are extracted by a model and kept only when their quote appears verbatim in the text; each cited source is then checked, with a model’s help, for whether it says what the claim relies on. Those verdicts can be wrong — read the claim’s quote and the cited source before relying on one.
Statistics and arithmetic are recomputed, not judged.
Confidence bands are shown only for fields calibrated on our annotated test set. None is calibrated yet, so no band is shown.
What counts as a claim ›How we measure confidence ›How we check this ›
Are you an author, or do you see a problem with this page? Request a review
