Cited by 156

The DOI matches its Crossref record; 3 of the 3 references it cites were found in a registry or an index.

Kruppel-like Transcription Factor 6 Regulates Inflammatory Macrophage Polarization

Date, Dipali, Das, Riku, Narla, Goutham, Simon, Daniel I., Jain, Mukesh K., Mahabeleshwar, Ganapati H.·2014·Journal of Biological Chemistry

Overview

The claims and statistics of this paper haven’t been checked yet.

Run the check — free, no account needed. It reads the open-access text and checks the sources it cites.

A few free checks a day · papers already verified open instantly · results are public

Integrity signals

Registry

Crossref · 10.1074/jbc.m113.526749

Cites

3 of 3 references verified0 citation errors · 0 not checkable

Statistics

Figures

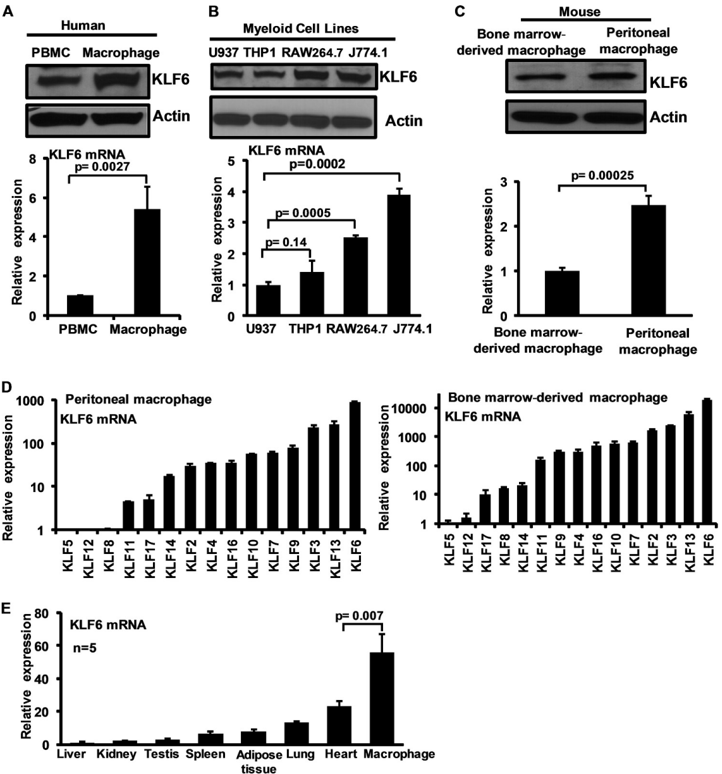
FIGURE 1 KLF6 expression in human and mouse macrophages. A, human peripheral blood mononuclear cells ( PBMC ) and primary macrophages were analyzedforKLF6protein( upperpanel ) and mRNA( lowerpanel ) expression by WesternblotanalysisandquantitativePCRanalysis,respectively. B, human(U937 and THP-1) and mouse (RAW264.7 and J774.1) myeloid cell lines examined for KLF6 protein expression by Western blot ( upper panel ) and mRNA ( lower panel ) expression by quantitative PCR analysis. C, mousethioglycollate-induced peritoneal macrophages and bone marrow-derived macrophages were analyzed for KLF6 protein ( upper panel ) and mRNA ( lower panel ) expression by Western blot and quantitative PCR analysis respectively. D, mouse thioglycollate-induced peritoneal macrophages and bone marrow-derived macrophages were analyzed for relative expression of macrophage Klfs by quantitative PCR analysis. Klf6 expressions in these cells were assigned a value of 1, and relative fold increases are indicated. E, Klf6 expression analyzed in mouse liver, kidney, testis, spleen, adipose tissue, lung, heart and bone marrow-derived macrophages was analyzed for relative expression of Klf6 by quantitative PCR analysis. Klf6 levels in liver assigned a value of 1 and relative fold increases are indicated. Actin and 36B4 were used as housekeeping gene for Western blot and quantitative PCR analysis, respectively. Each experiment was performed a minimum of three times. Data represent mean ± S.D., and p values less than 0.05 between indicated groups are considered significant.
FIGURE 1 KLF6 expression in human and mouse macrophages. A, human peripheral blood mononuclear cells ( PBMC ) and primary macrophages were analyzedforKLF6protein( upperpanel ) and mRNA( lowerpanel ) expression by WesternblotanalysisandquantitativePCRanalysis,respectively. B, human(U937 and THP-1) and mouse (RAW264.7 and J774.1) myeloid cell lines examined for KLF6 protein expression by Western blot ( upper panel ) and mRNA ( lower panel ) expression by quantitative PCR analysis. C, mousethioglycollate-induced peritoneal macrophages and bone marrow-derived macrophages were analyzed for KLF6 protein ( upper panel ) and mRNA ( lower panel ) expression by Western blot and quantitative PCR analysis respectively. D, mouse thioglycollate-induced peritoneal macrophages and bone marrow-derived macrophages were analyzed for relative expression of macrophage Klfs by quantitative PCR analysis. Klf6 expressions in these cells were assigned a value of 1, and relative fold increases are indicated. E, Klf6 expression analyzed in mouse liver, kidney, testis, spleen, adipose tissue, lung, heart and bone marrow-derived macrophages was analyzed for relative expression of Klf6 by quantitative PCR analysis. Klf6 levels in liver assigned a value of 1 and relative fold increases are indicated. Actin and 36B4 were used as housekeeping gene for Western blot and quantitative PCR analysis, respectively. Each experiment was performed a minimum of three times. Data represent mean ± S.D., and p values less than 0.05 between indicated groups are considered significant.CC-BY · From the PDF
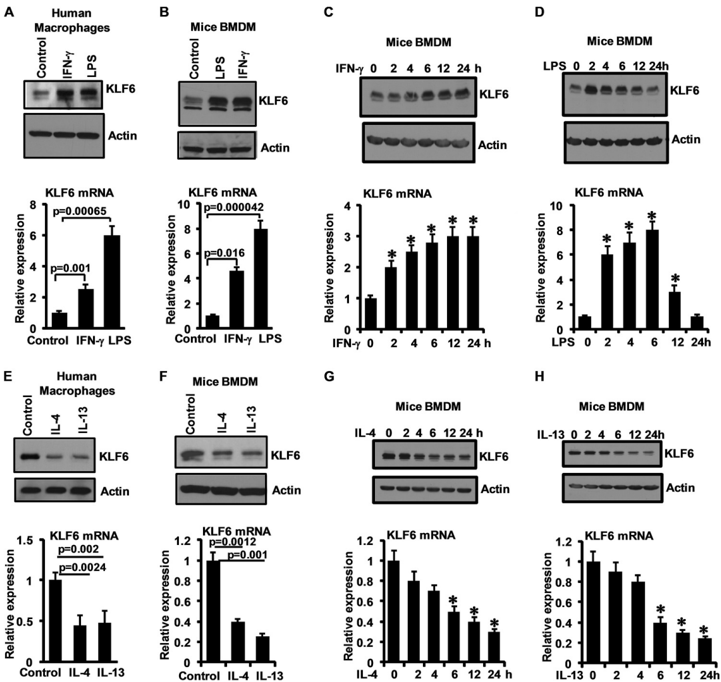
FIGURE 2 Pro-inflammatory stimuli induce and anti-inflammatory stimuli suppress KLF6 expression in human and mouse macrophages. A and B, humanprimary macrophages ( A ) and mouse bone marrow-derived macrophages ( B ) were induced with 10 ng/ml IFN𝛄 and 100 ng/ml LPS separately for 6 h. ThesecellswereanalyzedforKLF6protein( upperpanels ) and mRNA( lowerpanels ) expression by Western blot and quantitative PCR analysis, respectively. C and D, mouse bone marrow-derived macrophages were induced with 10 ng/ml IFN𝛄 ( C ) and 100 ng/ml LPS ( D ) separately for 0-24 h. These cells were examined for KLF6 protein ( upperpanels ) and mRNA( lowerpanels ) expression kinetics by Western blot and quantitative PCR analysis, respectively. E and F, humanprimary macrophages ( E ) and mouse bone marrow-derived macrophages ( F ) were induced with 10 ng/ml IL-4 and 10 ng/ml IL-13 separately for 18 h. These cells were analyzed for KLF6 protein expression ( upper panels ) by Western blot and mRNA ( lower panels ) expression by quantitative PCR analysis. G and H, mouse bone marrow-derived macrophages were induced with 10 ng/ml IL-4 ( G ) and 10 ng/ml IL-13 ( H ) separately for 0-24 h. These cells were examined for KLF6 protein ( upper panels ) and mRNA ( lower panels ) expression kinetics by Western blot and quantitative PCR analysis, respectively. Actin and 36B4 were used as housekeeping genes for Western blot and quantitative PCR analysis, respectively. Each experiment was performed for a minimum of three times. Data represent mean ± S.D., and p values less than 0.05 between indicated groups are considered significant.
FIGURE 2 Pro-inflammatory stimuli induce and anti-inflammatory stimuli suppress KLF6 expression in human and mouse macrophages. A and B, humanprimary macrophages ( A ) and mouse bone marrow-derived macrophages ( B ) were induced with 10 ng/ml IFN𝛄 and 100 ng/ml LPS separately for 6 h. ThesecellswereanalyzedforKLF6protein( upperpanels ) and mRNA( lowerpanels ) expression by Western blot and quantitative PCR analysis, respectively. C and D, mouse bone marrow-derived macrophages were induced with 10 ng/ml IFN𝛄 ( C ) and 100 ng/ml LPS ( D ) separately for 0-24 h. These cells were examined for KLF6 protein ( upperpanels ) and mRNA( lowerpanels ) expression kinetics by Western blot and quantitative PCR analysis, respectively. E and F, humanprimary macrophages ( E ) and mouse bone marrow-derived macrophages ( F ) were induced with 10 ng/ml IL-4 and 10 ng/ml IL-13 separately for 18 h. These cells were analyzed for KLF6 protein expression ( upper panels ) by Western blot and mRNA ( lower panels ) expression by quantitative PCR analysis. G and H, mouse bone marrow-derived macrophages were induced with 10 ng/ml IL-4 ( G ) and 10 ng/ml IL-13 ( H ) separately for 0-24 h. These cells were examined for KLF6 protein ( upper panels ) and mRNA ( lower panels ) expression kinetics by Western blot and quantitative PCR analysis, respectively. Actin and 36B4 were used as housekeeping genes for Western blot and quantitative PCR analysis, respectively. Each experiment was performed for a minimum of three times. Data represent mean ± S.D., and p values less than 0.05 between indicated groups are considered significant.CC-BY · From the PDF
Image 3
CC-BY · From the PDF
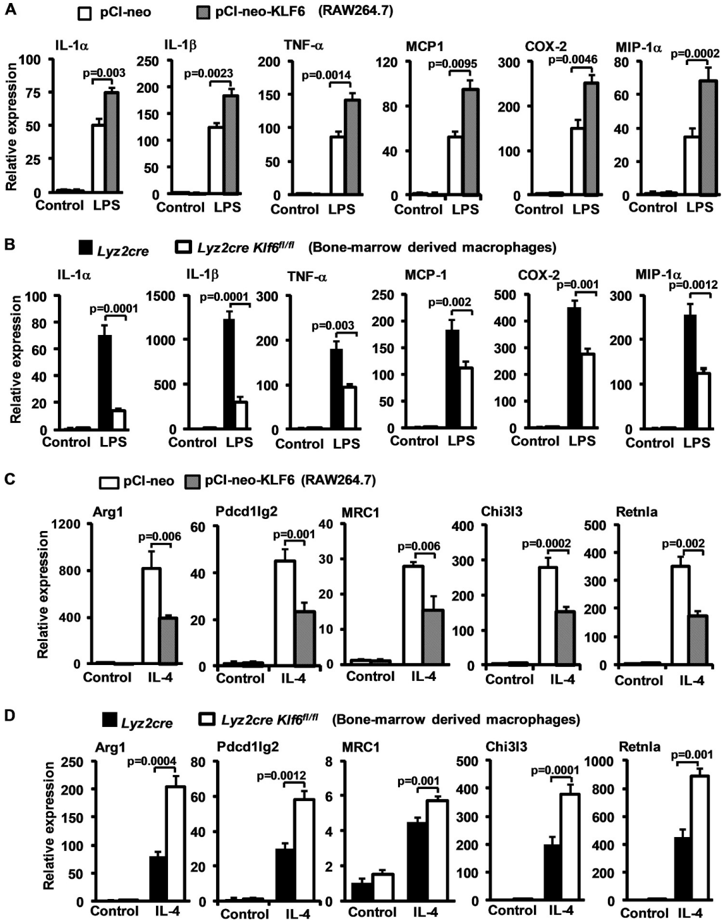
FIGURE4 KLF6regulatesinduciblepro-andanti-inflammatorygeneexpressioninmacrophages. A, RAW264.7cellsweretransfectedwitheither pCI-neo or pCI-neoKlf6 using Lipofectamine H23006 transfection reagent. These cells were stimulated with 100 ng/ml LPS for 6 h. Total RNA from these experiments were analyzed for IL-1 𝛂 , IL-1 𝛃 , TNF𝛂 , MCP-1, COX-2, and MIP-1 𝛂 , by quantitative PCR analysis. B, Lyz2cre and Lyz2cre : Klf6 fl/fl mouse bone marrow-derived macrophages were stimulated with 100 ng/ml LPS for 6 h. Total mRNA from these experiments was analyzed for IL-1 𝛂 , IL-1 𝛃 , TNF𝛂 , MCP-1, COX-2, and MIP-1 𝛂 expression by quantitative PCR analysis. C, RAW264.7 cells were transiently transfected with either pCI-neo or pCI-neoKlf6 using Lipofectamine H23006 transfection reagent. These cells were exposed to 10 ng/ml IL-4 for 18 h. Total RNA from these experiments was analyzed for Arg1, Pdcd1lg2, Mrc1, Chi3l3, and Retnla expression by quantitative PCR analysis. D, Lyz2cre and Lyz2cre : Klf6 fl/fl mouse bone marrow-derived macrophages were induced with 10 ng/ml IL-4 for 18 h. Total mRNA from these experiments was analyzed for Arg1, Pdcd1lg2, Mrc1, Chi3l3, and Retnla expression by quantitative PCR analysis. 36B4 was used as housekeeping gene for all the experiments. Each experiment was performed a minimum of three times. Data represent mean ± S.D., and a p value of less than 0.05 between indicated groups is considered significant.
FIGURE4 KLF6regulatesinduciblepro-andanti-inflammatorygeneexpressioninmacrophages. A, RAW264.7cellsweretransfectedwitheither pCI-neo or pCI-neoKlf6 using Lipofectamine H23006 transfection reagent. These cells were stimulated with 100 ng/ml LPS for 6 h. Total RNA from these experiments were analyzed for IL-1 𝛂 , IL-1 𝛃 , TNF𝛂 , MCP-1, COX-2, and MIP-1 𝛂 , by quantitative PCR analysis. B, Lyz2cre and Lyz2cre : Klf6 fl/fl mouse bone marrow-derived macrophages were stimulated with 100 ng/ml LPS for 6 h. Total mRNA from these experiments was analyzed for IL-1 𝛂 , IL-1 𝛃 , TNF𝛂 , MCP-1, COX-2, and MIP-1 𝛂 expression by quantitative PCR analysis. C, RAW264.7 cells were transiently transfected with either pCI-neo or pCI-neoKlf6 using Lipofectamine H23006 transfection reagent. These cells were exposed to 10 ng/ml IL-4 for 18 h. Total RNA from these experiments was analyzed for Arg1, Pdcd1lg2, Mrc1, Chi3l3, and Retnla expression by quantitative PCR analysis. D, Lyz2cre and Lyz2cre : Klf6 fl/fl mouse bone marrow-derived macrophages were induced with 10 ng/ml IL-4 for 18 h. Total mRNA from these experiments was analyzed for Arg1, Pdcd1lg2, Mrc1, Chi3l3, and Retnla expression by quantitative PCR analysis. 36B4 was used as housekeeping gene for all the experiments. Each experiment was performed a minimum of three times. Data represent mean ± S.D., and a p value of less than 0.05 between indicated groups is considered significant.CC-BY · From the PDF
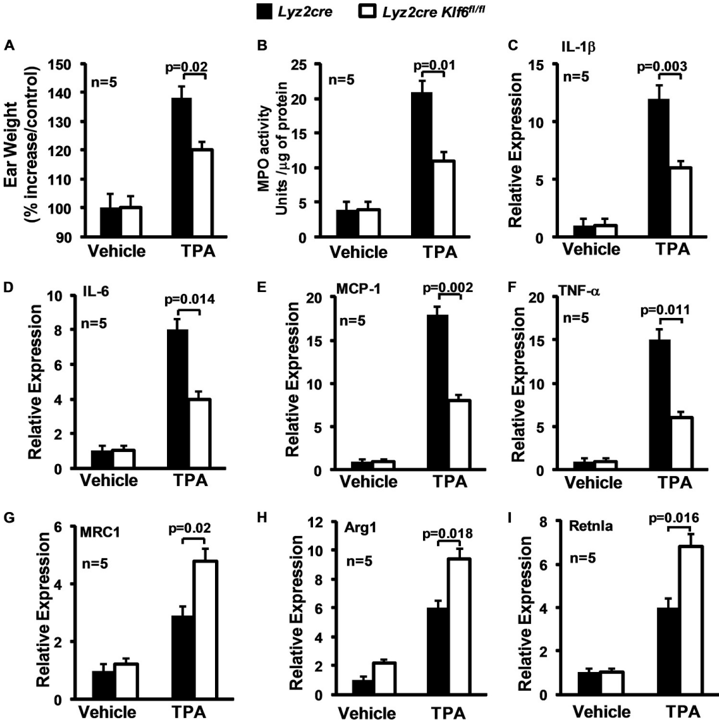
FIGURE 5 Myeloid Klf6 deficiency reduce cutaneous inflammation in vivo . A, Lyz2cre and Lyz2cre : Klf6 fl/fl mice were subjected to TPA-induced cutaneous inflammation model. Ear weight from control and experimental groups was documented utilizing an analytical balance. The percentage increase in ear weight compared with the control is indicated. B, total protein extracts of ear tissue from vehicle and TPA-treated groups from Lyz2cre and Lyz2cre : Klf6 fl/fl mice were subjected to myeloperoxidase activity assay. The data are indicated as MPO activity units/micrograms of total protein. C-I, total RNA from Lyz2cre and Lyz2cre : Klf6 fl/fl mouseeartissueexposedtoTPAorvehiclecontrolwasanalyzedforIL-1 𝛃 , IL-6, MCP-1, TNF𝛂 , MRC1, Arg1, and Retnla expression by quantitative PCRanalysis. 36B4 wasusedasthehousekeeping gene. The combined data from three experiments are shown. Data represent mean ± S.D., and a p value less than 0.05 between the indicated groups is considered significant.
FIGURE 5 Myeloid Klf6 deficiency reduce cutaneous inflammation in vivo . A, Lyz2cre and Lyz2cre : Klf6 fl/fl mice were subjected to TPA-induced cutaneous inflammation model. Ear weight from control and experimental groups was documented utilizing an analytical balance. The percentage increase in ear weight compared with the control is indicated. B, total protein extracts of ear tissue from vehicle and TPA-treated groups from Lyz2cre and Lyz2cre : Klf6 fl/fl mice were subjected to myeloperoxidase activity assay. The data are indicated as MPO activity units/micrograms of total protein. C-I, total RNA from Lyz2cre and Lyz2cre : Klf6 fl/fl mouseeartissueexposedtoTPAorvehiclecontrolwasanalyzedforIL-1 𝛃 , IL-6, MCP-1, TNF𝛂 , MRC1, Arg1, and Retnla expression by quantitative PCRanalysis. 36B4 wasusedasthehousekeeping gene. The combined data from three experiments are shown. Data represent mean ± S.D., and a p value less than 0.05 between the indicated groups is considered significant.CC-BY · From the PDF
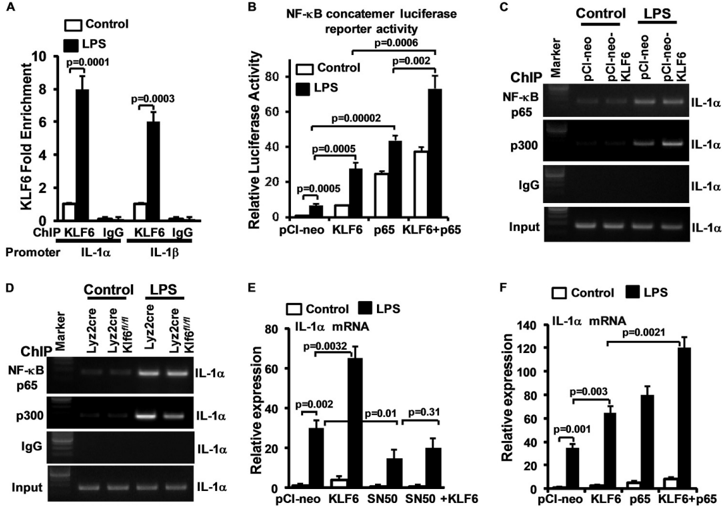
FIGURE 6 KLF6regulates macrophage polarization by modulating functions of NF𝛋 B. A, wild-type BMDMs were stimulated with 10 ng/ml LPS, and KLF6 ChIP analysis was performed on IL-1 𝛂 ( -976 to -980) and IL-1 𝛃 ( -601 to -605) promoters. Fold changes in KLF6 enrichment over control are indicated. ChIP analysis performed using IgG was used as negative control. B, RAW264.7 cells were co-transfected with NF𝛋 B concatemer luciferase reporter plasmid in the presenceofKLF6orNF𝛋 B-p65plasmid.ThesecellswerestimulatedwithLPS,andinductioninluciferasewasdocumentedandisindicatedasrelativeluciferase activity over the control group. C and D, RAW264.7 cells overexpressed with Klf6 and Lyz2cre , Lyz2cre : Klf6 fl/fl mouse BMDMs were induced with 10 ng/ml LPS. ChIP analysis was performed on IL-1 𝛂 promoter ( -1787 to -1796) utilizing anti-p65 and anti-p300 antibody. ChIP analysis performed using IgG was used as negative control. E, RAW264.7 cells were co-transfected with Klf6 or NF𝛋 B-p65 plasmid. These cells were stimulated with LPS, and total RNA from these cells was isolated. IL-1 𝛂 mRNA expression was analyzed by quantitative PCR and normalized to 36B4 . F, RAW264.7 cells were transfected with Klf6 plasmid. These cells were stimulated with LPS in the presence of NF𝛋 B peptide inhibitor SN-50, and total RNA from these cells was isolated. IL-1 𝛂 mRNA expression was analyzed by quantitative PCR and normalized to 36B4 .
FIGURE 6 KLF6regulates macrophage polarization by modulating functions of NF𝛋 B. A, wild-type BMDMs were stimulated with 10 ng/ml LPS, and KLF6 ChIP analysis was performed on IL-1 𝛂 ( -976 to -980) and IL-1 𝛃 ( -601 to -605) promoters. Fold changes in KLF6 enrichment over control are indicated. ChIP analysis performed using IgG was used as negative control. B, RAW264.7 cells were co-transfected with NF𝛋 B concatemer luciferase reporter plasmid in the presenceofKLF6orNF𝛋 B-p65plasmid.ThesecellswerestimulatedwithLPS,andinductioninluciferasewasdocumentedandisindicatedasrelativeluciferase activity over the control group. C and D, RAW264.7 cells overexpressed with Klf6 and Lyz2cre , Lyz2cre : Klf6 fl/fl mouse BMDMs were induced with 10 ng/ml LPS. ChIP analysis was performed on IL-1 𝛂 promoter ( -1787 to -1796) utilizing anti-p65 and anti-p300 antibody. ChIP analysis performed using IgG was used as negative control. E, RAW264.7 cells were co-transfected with Klf6 or NF𝛋 B-p65 plasmid. These cells were stimulated with LPS, and total RNA from these cells was isolated. IL-1 𝛂 mRNA expression was analyzed by quantitative PCR and normalized to 36B4 . F, RAW264.7 cells were transfected with Klf6 plasmid. These cells were stimulated with LPS in the presence of NF𝛋 B peptide inhibitor SN-50, and total RNA from these cells was isolated. IL-1 𝛂 mRNA expression was analyzed by quantitative PCR and normalized to 36B4 .CC-BY · From the PDF
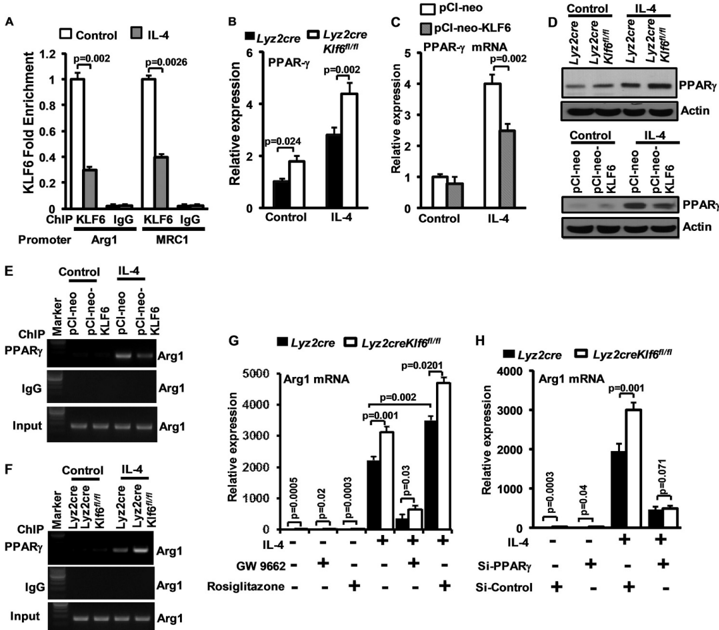
FIGURE7 KLF6regulatesmacrophagepolarizationbymodulatingfunctionsofPPAR 𝛄 . A, wild-type BMDMswerestimulatedwith10ng/mlIL-4,andKLF6 ChIP analysis was performed on Arg1 ( -1009 to -1013) and Mrc1 ( -1637 to -1642) promoters. Fold changes in KLF6 enrichment over control are indicated. ChIP analysis performed using IgG was used as negative control. B, Lyz2cre and Lyz2cre : Klf6 fl/fl mouse BMDMs were induced with 10 ng/ml IL-4 for 18 h. Total mRNAwasanalyzedforPPAR 𝛄 expression by quantitative PCR analysis. C, RAW264.7 cells were overexpressed with KLF6 and stimulated with 10 ng/ml of IL-4. These cells are analyzed for PPAR 𝛄 expression by quantitative PCR analysis. D and E, RAW264.7 cells were overexpressed with Klf6 , and Lyz2cre / Lyz2cre : Klf6 fl/fl mouse BMDMs were induced with 10 ng/ml IL-4 for 18 h. Total cell lysate was analyzed for PPAR 𝛄 protein expression by Western blot analysis. Actin was used as loading control. E and F, RAW264.7 cells overexpressed with Klf6 and Lyz2cre , Lyz2cre : Klf6 fl/fl mouse BMDMs were induced with 10 ng/ml IL-4. ChIP analysis was performed on arginase1 promoter ( -986 to -1003) utilizing anti-PPAR 𝛄 antibody. ChIP analysis performed using IgG was used as negative control. G, Lyz2cre and Lyz2cre : Klf6 fl/fl mouse BMDMs were exposed to GW9662 (2.5 𝛍 M) or rosiglitazone (5 𝛍 M). These cells were induced with 10 ng/ml IL-4 for 18 h, and Arg1 mRNA expression was analyzed by quantitative PCR analysis. H, Lyz2cre and Lyz2cre : Klf6 fl/fl mouse BMDMs were transfected with control siRNA or siRNA targeting PPAR 𝛄 bynucleofection.ThesecellswereinducedwithIL-4for18h,andArg1mRNAexpressionwasanalyzedbyquantitativePCRanalysis. -wasused as a housekeeping gene. Each experiment was performed a minimum of three times. Data represent mean ± S.D., and a p value less than 0.05 between indicated groups are considered significant.
FIGURE7 KLF6regulatesmacrophagepolarizationbymodulatingfunctionsofPPAR 𝛄 . A, wild-type BMDMswerestimulatedwith10ng/mlIL-4,andKLF6 ChIP analysis was performed on Arg1 ( -1009 to -1013) and Mrc1 ( -1637 to -1642) promoters. Fold changes in KLF6 enrichment over control are indicated. ChIP analysis performed using IgG was used as negative control. B, Lyz2cre and Lyz2cre : Klf6 fl/fl mouse BMDMs were induced with 10 ng/ml IL-4 for 18 h. Total mRNAwasanalyzedforPPAR 𝛄 expression by quantitative PCR analysis. C, RAW264.7 cells were overexpressed with KLF6 and stimulated with 10 ng/ml of IL-4. These cells are analyzed for PPAR 𝛄 expression by quantitative PCR analysis. D and E, RAW264.7 cells were overexpressed with Klf6 , and Lyz2cre / Lyz2cre : Klf6 fl/fl mouse BMDMs were induced with 10 ng/ml IL-4 for 18 h. Total cell lysate was analyzed for PPAR 𝛄 protein expression by Western blot analysis. Actin was used as loading control. E and F, RAW264.7 cells overexpressed with Klf6 and Lyz2cre , Lyz2cre : Klf6 fl/fl mouse BMDMs were induced with 10 ng/ml IL-4. ChIP analysis was performed on arginase1 promoter ( -986 to -1003) utilizing anti-PPAR 𝛄 antibody. ChIP analysis performed using IgG was used as negative control. G, Lyz2cre and Lyz2cre : Klf6 fl/fl mouse BMDMs were exposed to GW9662 (2.5 𝛍 M) or rosiglitazone (5 𝛍 M). These cells were induced with 10 ng/ml IL-4 for 18 h, and Arg1 mRNA expression was analyzed by quantitative PCR analysis. H, Lyz2cre and Lyz2cre : Klf6 fl/fl mouse BMDMs were transfected with control siRNA or siRNA targeting PPAR 𝛄 bynucleofection.ThesecellswereinducedwithIL-4for18h,andArg1mRNAexpressionwasanalyzedbyquantitativePCRanalysis. -wasused as a housekeeping gene. Each experiment was performed a minimum of three times. Data represent mean ± S.D., and a p value less than 0.05 between indicated groups are considered significant.CC-BY · From the PDF
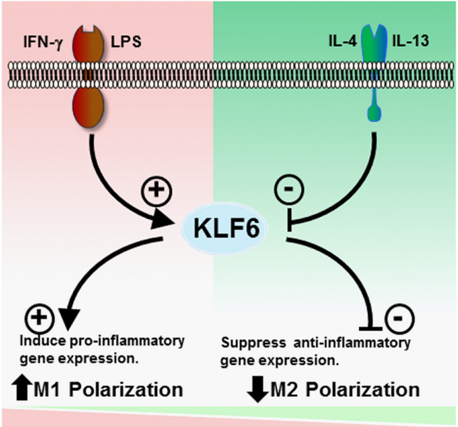
FIGURE 8 KLF6promotesTh1stimulus-induced M1 gene expression and suppresses Th2 stimulus-induced M2 gene expression in macrophages.
FIGURE 8 KLF6promotesTh1stimulus-induced M1 gene expression and suppresses Th2 stimulus-induced M2 gene expression in macrophages.CC-BY · From the PDF

Verification

Claims the paper makes

The claims and statistics of this paper haven’t been checked yet.

Run the check — free, no account needed. It reads the open-access text and checks the sources it cites.

A few free checks a day · papers already verified open instantly · results are public

Claims other papers make about this one

Each is checked against this paper’s own text: does it say what the citing paper says it does?

Self-check

Percentages, sums and reported differences re-computed from the paper’s own numbers.

The self-check needs the paper’s full text.

Citations

Cites

Research works printed but not linked: 23

  1. Olefsky, 2010, Macrophages, inflammation, and insulin resistance, Annu. Rev. Physiol., 72, 219, 10.1146/annurev-physiol-021909-135846 · DOI · Paper page
  2. Serbina, 2008, Monocyte-mediated defense against microbial pathogens, Annu. Rev. Immunol., 26, 421, 10.1146/annurev.immunol.26.021607.090326 · DOI
  3. Muller, 2011, Mechanisms of leukocyte transendothelial migration, Annu. Rev. Pathol., 6, 323, 10.1146/annurev-pathol-011110-130224 · DOI
  4. Auffray, 2009, Blood monocytes: development, heterogeneity, and relationship with dendritic cells, Annu. Rev. Immunol., 27, 669, 10.1146/annurev.immunol.021908.132557 · DOI
  5. Medzhitov, 2009, Transcriptional control of the inflammatory response, Nat. Rev. Immunol., 9, 692, 10.1038/nri2634 · DOI · Paper page
  6. Biswas, 2012, Macrophage polarization and plasticity in health and disease, Immunol. Res., 53, 11, 10.1007/s12026-012-8291-9 · DOI
  7. Szabo, 2003, Molecular mechanisms regulating Th1 immune responses, Annu. Rev. Immunol., 21, 713, 10.1146/annurev.immunol.21.120601.140942 · DOI
  8. Odegaard, 2011, Alternative macrophage activation and metabolism, Annu. Rev. Pathol., 6, 275, 10.1146/annurev-pathol-011110-130138 · DOI · Paper page
  9. Szanto, 2010, STAT6 transcription factor is a facilitator of the nuclear receptor PPARγ-regulated gene expression in macrophages and dendritic cells, Immunity., 33, 699, 10.1016/j.immuni.2010.11.009 · DOI
  10. Andreoli, 2010, Biology of Kruppel-like factor 6 transcriptional regulator in cell life and death, IUBMB Life., 62, 896, 10.1002/iub.396 · DOI
  11. Mahabeleshwar, 2011, The myeloid transcription factor KLF2 regulates the host response to polymicrobial infection and endotoxic shock, Immunity., 34, 715, 10.1016/j.immuni.2011.04.014 · DOI
  12. Liao, 2011, Kruppel-like factor 4 regulates macrophage polarization, J. Clin. Invest., 121, 2736, 10.1172/JCI45444 · DOI · Paper page
  13. Davis, 2013, Isolation, culture, and functional evaluation of bone marrow-derived macrophages, Methods Mol. Biol., 1031, 27, 10.1007/978-1-62703-481-4_3 · DOI
  14. Leow, 2009, Prostate-specific Klf6 inactivation impairs anterior prostate branching morphogenesis through increased activation of the Shh pathway, J. Biol. Chem., 284, 21057, 10.1074/jbc.M109.001776 · DOI
  15. Nayak, 2013, Kruppel-like factor 2 is a transcriptional regulator of chronic and acute inflammation, Am. J. Pathol., 182, 1696, 10.1016/j.ajpath.2013.01.029 · DOI
  16. Cao, 2010, Role of Kruppel-like factors in leukocyte development, function, and disease, Blood., 116, 4404, 10.1182/blood-2010-05-285353 · DOI
  17. Matsumoto, 2006, Developmental regulation of yolk sac hematopoiesis by Kruppel-like factor 6, Blood., 107, 1357, 10.1182/blood-2005-05-1916 · DOI
  18. Lawrence, 2005, IKKα limits macrophage NF-κB activation and contributes to the resolution of inflammation, Nature., 434, 1138, 10.1038/nature03491 · DOI
  19. McConnell, 2010, Mammalian Kruppel-like factors in health and diseases, Physiol. Rev., 90, 1337, 10.1152/physrev.00058.2009 · DOI
  20. Ye, 2003, Hematopoietic stem cells expressing the myeloid lysozyme gene retain long-term, multilineage repopulation potential, Immunity., 19, 689, 10.1016/S1074-7613(03)00299-1 · DOI
  21. Ostuni, 2011, Transcriptional control of macrophage diversity and specialization, Eur. J. Immunol., 41, 2486, 10.1002/eji.201141706 · DOI
  22. Hawiger, 2001, Innate immunity and inflammation: a transcriptional paradigm, Immunol. Res., 23, 99, 10.1385/IR:23:2-3:099 · DOI
  23. Martinez, 2009, Alternative activation of macrophages: an immunologic functional perspective, Annu. Rev. Immunol., 27, 451, 10.1146/annurev.immunol.021908.132532 · DOI · Paper page

Cited by

Sorted by citations

See all 156

Metadata

Authors
Date, D., Das, R., Narla, G., Simon, D. I., Jain, M. K., & Mahabeleshwar, G. H.
Venue
Journal of Biological Chemistry
Publisher
Elsevier BV
Published
2014-04
Volume
289
Issue
15
Pages
10318-10329
ISSN
0021-9258
Cited by
156
References
3
Language
en
Funders
National Institutes of Health (HL097023, HL57506, HL72952, HL75427, HL76754, HL086548)

About these checks

Registry, retraction, Cites and statistics results are computed, not judged, with one exception: a printed reference that no index lists is read once by a model before it counts as a citation error. Claims are extracted by a model and kept only when their quote appears verbatim in the text; each cited source is then checked, with a model’s help, for whether it says what the claim relies on. Those verdicts can be wrong — read the claim’s quote and the cited source before relying on one.

Statistics and arithmetic are recomputed, not judged.

Confidence bands are shown only for fields calibrated on our annotated test set. None is calibrated yet, so no band is shown.

What counts as a claim ›How we measure confidence ›How we check this ›

Are you an author, or do you see a problem with this page? Request a review