

The DOI matches its Crossref record; 51 of the 52 references it cites were found in a registry or an index.
Chemically Modified DNA Aptamers Bind Interleukin-6 with High Affinity and Inhibit Signaling by Blocking Its Interaction with Interleukin-6 Receptor
Open accessAbstract
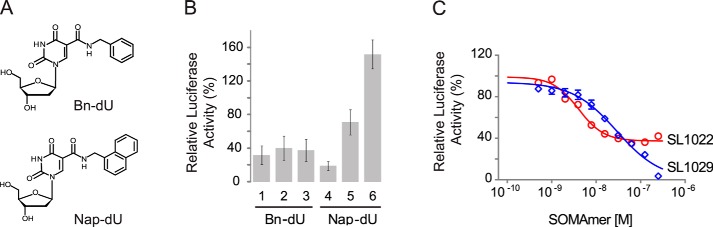
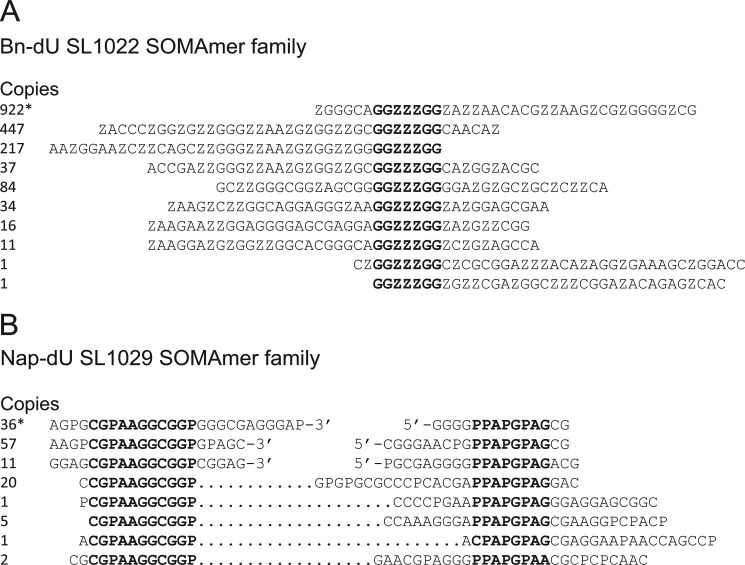
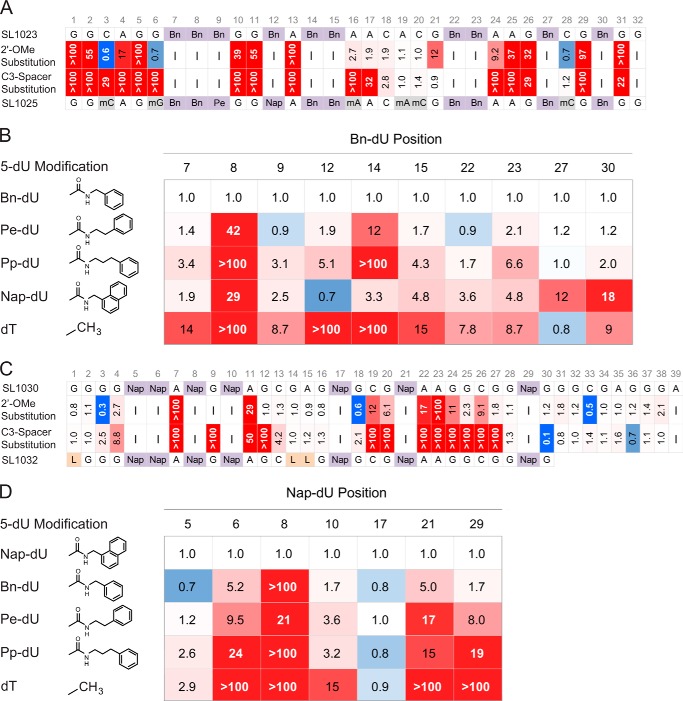
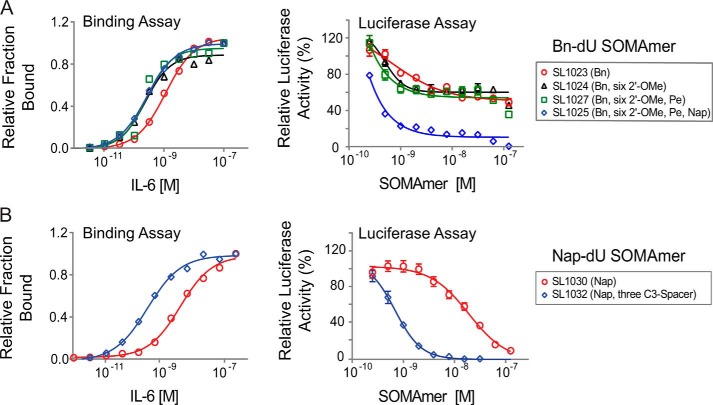
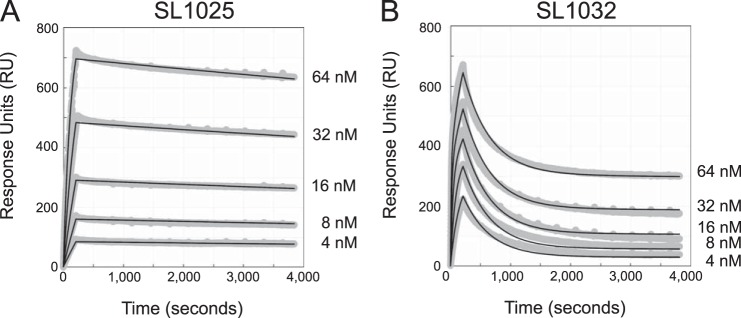
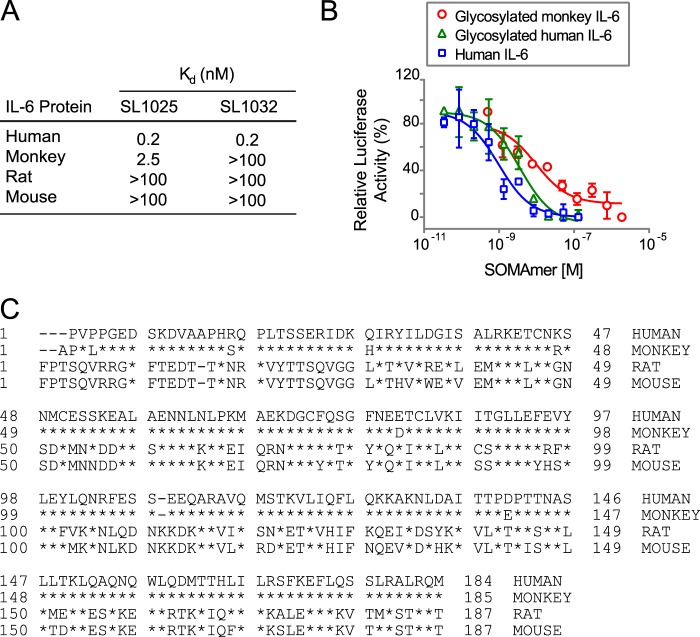
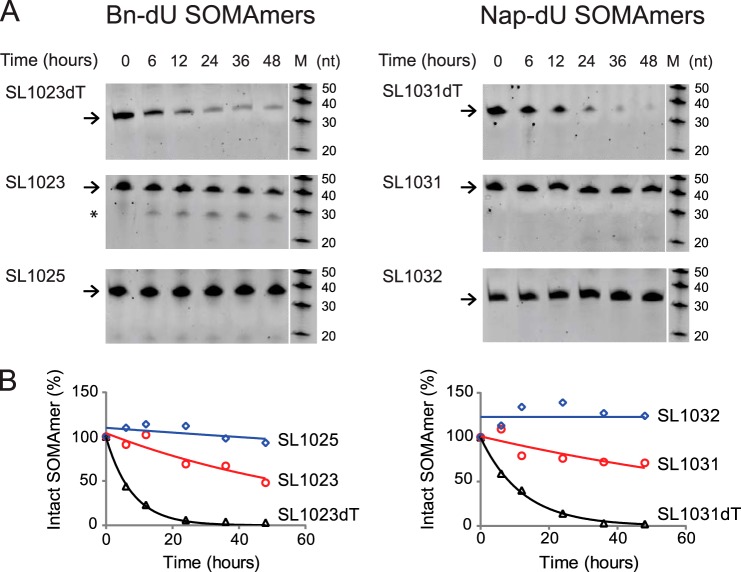
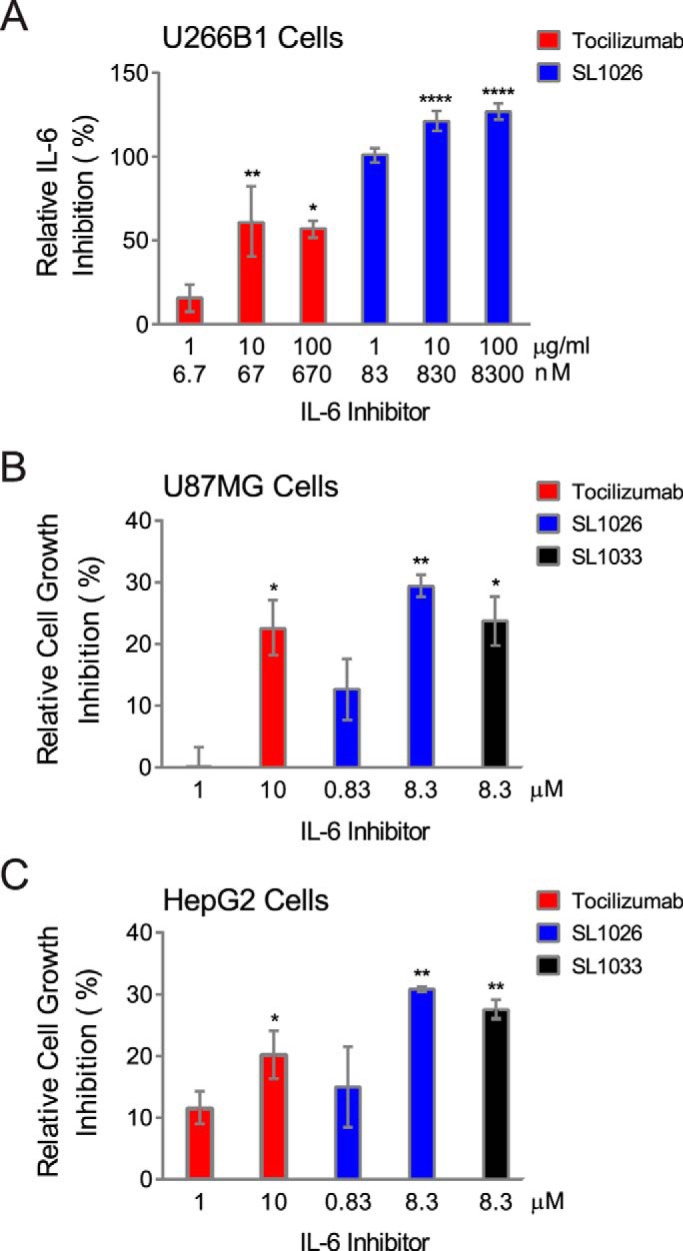
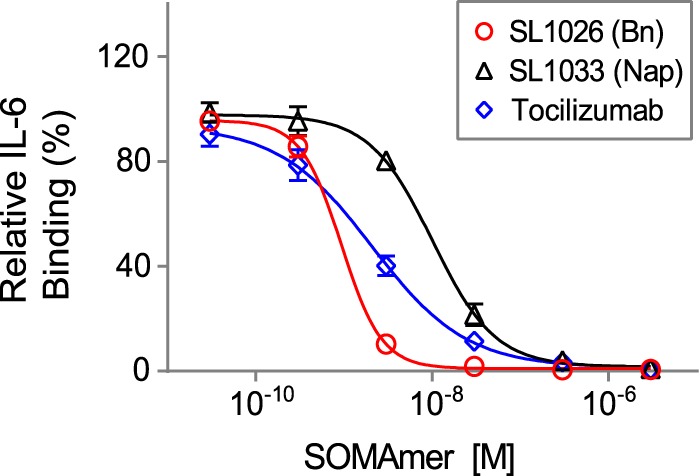
Interleukin-6 (IL-6) is a pleiotropic cytokine that regulates immune and inflammatory responses, and its overproduction is a hallmark of inflammatory diseases. Inhibition of IL-6 signaling with the anti-IL-6 receptor antibody tocilizumab has provided some clinical benefit to patients; however, direct cytokine inhibition may be a more effective option. We used the systematic evolution of ligands by exponential enrichment (SELEX) process to discover slow off-rate modified aptamers (SOMAmers) with hydrophobic base modifications that inhibit IL-6 signaling in vitro. Two classes of IL-6 SOMAmers were isolated from modified DNA libraries containing 40 random positions and either 5-(N-benzylcarboxamide)-2'-deoxyuridine (Bn-dU) or 5-[N-(1-naphthylmethyl)carboxamide]-2'-deoxyuridine (Nap-dU) replacing dT. These modifications facilitate the high affinity binding interaction with IL-6 and provide resistance against degradation by serum endonucleases. Post-SELEX optimization of one Bn-dU and one Nap-dU SOMAmer led to improvements in IL-6 binding (10-fold) and inhibition activity (greater than 20-fold), resulting in lead SOMAmers with sub-nanomolar affinity (Kd = 0.2 nm) and potency (IC50 = 0.2 nm). Although similar in inhibition properties, the two SOMAmers have unique sequences and different ortholog specificities. Furthermore, these SOMAmers were stable in human serum in vitro for more than 48 h. Both SOMAmers prevented IL-6 signaling by blocking the interaction of IL-6 with its receptor and inhibited the proliferation of tumor cells in vitro as effectively as tocilizumab. This new class of IL-6 inhibitor may be an effective therapeutic alternative for patients suffering from inflammatory diseases.
Overview
The claims and statistics of this paper haven’t been checked yet.
Run the check — free, no account needed. It reads the open-access text and checks the sources it cites.
Integrity signals
Registry
Cites
Statistics
Figures
Verification
Claims the paper makes
The claims and statistics of this paper haven’t been checked yet.
Run the check — free, no account needed. It reads the open-access text and checks the sources it cites.
Claims other papers make about this one
Each is checked against this paper’s own text: does it say what the citing paper says it does?
In the citing paper
“Beyond cTnI, we expect that this scalable and reproducible top-down nanoproteomics approach can be generally applied to other low-abundance plasma/serum proteins of interest, such as cytokines or growth factors, if the NPs can be functionalized with a suitable affinity reagent55,56.”
From Nanoproteomics enables proteoform-resolved analysis of low-abundance proteins in human serum (2020) · cites this paper as [56]
Self-check
Percentages, sums and reported differences re-computed from the paper’s own numbers.
The self-check needs the paper’s full text.
Citations
Cites
Tuerk, C., & Gold, L. (1990) · Science · doi:10.1126/science.2200121 · Cited by 10,421
In vitro selection of RNA molecules that bind specific ligands
Ellington, A. D., & Szostak, J. W. (1990) · Nature · doi:10.1038/346818a0 · Cited by 9,845
The pro- and anti-inflammatory properties of the cytokine interleukin-6
Scheller, J., Chalaris, A., Schmidt-Arras, D., & Rose-John, S. (2011) · Biochimica et Biophysica Acta (BBA) - Molecular Cell Research · doi:10.1016/j.bbamcr.2011.01.034 · Cited by 3,212
Pegaptanib for neovascular age-related macular degeneration
Gragoudas, E. S., Adamis, A. P., Cunningham, E. T., Feinsod, M., & Guyer, D. R. (2004) · New England Journal of Medicine · doi:10.1056/nejmoa042760 · Cited by 2,337
Keefe, A. D., Pai, S., & Ellington, A. (2010) · Nature Reviews Drug Discovery · doi:10.1038/nrd3141 · Cited by 2,289
Hirano, T., Yasukawa, K., Harada, H., Taga, T., Watanabe, Y., Matsuda, T., Kashiwamura, S.-I., Nakajima, K., Koyama, K., Iwamatsu, A., et al. (1986) · Nature · doi:10.1038/324073a0 · Cited by 2,139
Interleukin-6-type cytokine signalling through the gp130/Jak/STAT pathway
HEINRICH, P. C., BEHRMANN, I., MÜLLER-NEWEN, G., SCHAPER, F., & GRAEVE, L. (1998) · Biochemical Journal · doi:10.1042/bj3340297 · Cited by 2,130
Deoxynucleoside phosphoramidites—A new class of key intermediates for deoxypolynucleotide synthesis
Beaucage, S. L., & Caruthers, M. H. (1981) · Tetrahedron Letters · doi:10.1016/s0040-4039(01)90461-7 · Cited by 2,029
Aptamer-Based Multiplexed Proteomic Technology for Biomarker Discovery
Gold, L., Ayers, D., Bertino, J., Bock, C., Bock, A., Brody, E. N., Carter, J., Dalby, A. B., Eaton, B. E., Fitzwater, T., et al. (2010) · PLoS ONE · doi:10.1371/journal.pone.0015004 · Cited by 1,754
Self-citationA Road Map for Those Who Don't Know JAK-STAT
Aaronson, D. S., & Horvath, C. M. (2002) · Science · doi:10.1126/science.1071545 · Cited by 1,371
Research works printed but not linked: 1
- Zhao, 2013, Anti-IL-6 antibody Clazakizumab is more potent than Tocilizumab in blocking in vitroex vivo IL-6-induced functions, Arthritis and Rheumatism, 65
Cited by
Sorted by citations
Analysis of aptamer discovery and technology
Dunn, M. R., Jimenez, R. M., & Chaput, J. C. (2017) · Nature Reviews Chemistry · doi:10.1038/s41570-017-0076 · Cited by 938
Chemistry, structure and function of approved oligonucleotide therapeutics
Egli, M., & Manoharan, M. (2023) · Nucleic Acids Research · doi:10.1093/nar/gkad067 · Cited by 909
Recent Progress in Aptamer Discoveries and Modifications for Therapeutic Applications
Ni, S., Zhuo, Z., Pan, Y., Yu, Y., Li, F., Liu, J., Wang, L., Wu, X., Li, D., Wan, Y., et al. (2020) · ACS Applied Materials & Interfaces · doi:10.1021/acsami.0c05750 · Cited by 605
Rohloff, J. C., Gelinas, A. D., Jarvis, T. C., Ochsner, U. A., Schneider, D. J., Gold, L., & Janjic, N. (2014) · Molecular Therapy - Nucleic Acids · doi:10.1038/mtna.2014.49 · Cited by 533
Self-citationAptamers Chemistry: Chemical Modifications and Conjugation Strategies
Odeh, F., Nsairat, H., Alshaer, W., Ismail, M. A., Esawi, E., Qaqish, B. M., Bawab, A. A., & Ismail, S. I. (2019) · Molecules · doi:10.3390/molecules25010003 · Cited by 420
Röthlisberger, P., & Hollenstein, M. (2018) · Advanced Drug Delivery Reviews · doi:10.1016/j.addr.2018.04.007 · Cited by 426
Detection and beyond: challenges and advances in aptamer-based biosensors
Yoo, H., Jo, H., & Oh, S. S. (2020) · Materials Advances · doi:10.1039/d0ma00639d · Cited by 351
Chemical Modifications of Nucleic Acid Aptamers for Therapeutic Purposes
Ni, S., Yao, H., Wang, L., Lu, J. G., Jiang, F., Lü, A., & Zhang, G. (2017) · International Journal of Molecular Sciences · doi:10.3390/ijms18081683 · Cited by 323
Large-scale serum protein biomarker discovery in Duchenne muscular dystrophy
Hathout, Y., Brody, E. N., Clemens, P. R., Cripe, L. H., DeLisle, R. K., Furlong, P., Gordish‐Dressman, H., Hache, L. P., Henricson, E., Hoffman, E. P., et al. (2015) · Proceedings of the National Academy of Sciences · doi:10.1073/pnas.1507719112 · Cited by 289
Nucleic Acid Aptamers: An Emerging Tool for Biotechnology and Biomedical Sensing
Ku, T., Zhang, T., Luo, H., Yen, T., Chen, P., Han, Y., & Lo, Y. (2015) · Sensors · doi:10.3390/s150716281 · Cited by 250
SELEX methods on the road to protein targeting with nucleic acid aptamers
Bayat, P., Nosrati, R., Alibolandi, M., Rafatpanah, H., Abnous, K., Khedri, M., & Ramezani, M. (2018) · Biochimie · doi:10.1016/j.biochi.2018.09.001 · Cited by 246
Aptamers Against Pro- and Anti-Inflammatory Cytokines: A Review
Boshtam, M., Asgary, S., Kouhpayeh, S., Shariati, L., & Khanahmad, H. (2016) · Inflammation · doi:10.1007/s10753-016-0477-1 · Cited by 225
Modified aptamers enable quantitative sub-10-nm cellular DNA-PAINT imaging
Strauss, S., Nickels, P. C., Strauss, M. T., Sabinina, V. J., Ellenberg, J., Carter, J. D., Gupta, S., Janjić, N., & Jungmann, R. (2018) · Nature Methods · doi:10.1038/s41592-018-0105-0 · Cited by 203
Self-citationSelection of DNA aptamers with two modified bases
Gawande, B. N., Rohloff, J. C., Carter, J. D., von Carlowitz, I., Zhang, C., Schneider, D. J., & Janjić, N. (2017) · Proceedings of the National Academy of Sciences · doi:10.1073/pnas.1615475114 · Cited by 194
Self-citationTrends in aptamer selection methods and applications
Yüce, M., Ullah, N., & Budak, H. (2015) · The Analyst · doi:10.1039/c5an00954e · Cited by 193
Brown, A., Brill, J., Amini, R., Nurmi, C., & Li, Y. (2024) · Angewandte Chemie International Edition · doi:10.1002/anie.202318665 · Cited by 193
Machine learning guided aptamer refinement and discovery
Bashir, A., Yang, Q., Wang, J., Hoyer, S., Chou, W.-C., McLean, C. Y., Davis, G., Gong, Q., Armstrong, Z., Jang, J., et al. (2021) · Nature Communications · doi:10.1038/s41467-021-22555-9 · Cited by 171
Elskens, J. P., Elskens, J., & Madder, A. (2020) · International Journal of Molecular Sciences · doi:10.3390/ijms21124522 · Cited by 156
Tertiş, M., Leva, P. I., Bogdan, D., Suciu, M., Graur, F., & Cristea, C. (2019) · Biosensors and Bioelectronics · doi:10.1016/j.bios.2019.05.012 · Cited by 153
Aptamers: A promising chemical antibody for cancer therapy
Zhou, G., Wilson, G., Hebbard, L., Duan, W., Liddle, C., George, J., & Qiao, L. (2016) · Oncotarget · doi:10.18632/oncotarget.7178 · Cited by 143
Programmable DNA switches and their applications
Harroun, S. G., Prévost-Tremblay, C., Lauzon, D., Desrosiers, A., Wang, X., Pedro, L., & Vallée‐Bélisle, A. (2018) · Nanoscale · doi:10.1039/c7nr07348h · Cited by 131
Generation of Aptamers with an Expanded Chemical Repertoire
Diafa, S., & Hollenstein, M. (2015) · Molecules · doi:10.3390/molecules200916643 · Cited by 115
Evolution of sequence-defined highly functionalized nucleic acid polymers
Chen, Z., Lichtor, P. A., Berliner, A. P., Chen, J. C., & Liu, D. R. (2018) · Nature Chemistry · doi:10.1038/s41557-018-0008-9 · Cited by 108
From selection hits to clinical leads: progress in aptamer discovery
Maier, K. E., & Levy, M. (2016) · Molecular Therapy — Methods & Clinical Development · doi:10.1038/mtm.2016.14 · Cited by 102
Crystal Structure of Interleukin-6 in Complex with a Modified Nucleic Acid Ligand
Gelinas, A. D., Davies, D. R., Edwards, T. E., Rohloff, J. C., Carter, J. D., Zhang, C., Gupta, S., Ishikawa, Y., Hirota, M., Nakaishi, Y., et al. (2014) · Journal of Biological Chemistry · doi:10.1074/jbc.m113.532697 · Cited by 107
Self-citationRöthlisberger, P., Gasse, C., & Hollenstein, M. (2017) · International Journal of Molecular Sciences · doi:10.3390/ijms18112430 · Cited by 97
Biological effects of interleukin-6: Clinical applications in autoimmune diseases and cancers
Ho, L., Luo, S., & Lai, J. (2015) · Biochemical Pharmacology · doi:10.1016/j.bcp.2015.06.009 · Cited by 89
Cheung, Y., Röthlisberger, P., Méchaly, A., Weber, P., Lévi-Acobas, F., Lo, Y., Wong, A. W. C., Kinghorn, A. B., Haouz, A., Savage, G. P., et al. (2020) · Proceedings of the National Academy of Sciences · doi:10.1073/pnas.2003267117 · Cited by 85
The Toolbox for Modified Aptamers
Lapa, S. A., Chudinov, A. V., & Timofeev, E. N. (2015) · Molecular Biotechnology · doi:10.1007/s12033-015-9907-9 · Cited by 84
Dolot, R., Lam, C. H., Sierant, M., Zhao, Q., Liu, F., Nawrot, B., Egli, M., & Yang, X. (2018) · Nucleic Acids Research · doi:10.1093/nar/gky268 · Cited by 83
Nanoproteomics enables proteoform-resolved analysis of low-abundance proteins in human serum
Tiambeng, T. N., Roberts, D. S., Brown, K. A., Zhu, Y., Chen, B., Wu, Z., Mitchell, S. D., Guardado-Alvarez, T. M., Jin, S., & Ge, Y. (2020) · Nature Communications · doi:10.1038/s41467-020-17643-1 · Cited by 76
DNA-Catalyzed Amide Hydrolysis
Zhou, C., Avins, J. L., Klauser, P. C., Brandsen, B. M., Lee, Y., & Silverman, S. K. (2016) · Journal of the American Chemical Society · doi:10.1021/jacs.5b12647 · Cited by 77
Key Aspects of Nucleic Acid Library Design for in Vitro Selection
Vorobyeva, M., Davydova, A., Vorobjev, P., Pyshnyi, D. V., & Venyaminova, A. G. (2018) · International Journal of Molecular Sciences · doi:10.3390/ijms19020470 · Cited by 79
Givanoudi, S., Heyndrickx, M., Depuydt, T., Khorshid, M., Robbens, J., & Wagner, P. (2023) · Sensors · doi:10.3390/s23020613 · Cited by 79
Replacing antibodies with modified DNA aptamers in vaccine potency assays
Trausch, J. J., Shank-Retzlaff, M. L., & Verch, T. (2017) · Vaccine · doi:10.1016/j.vaccine.2017.04.003 · Cited by 70
Shoaib, M., Li, H., Zareef, M., Khan, I. M., Iqbal, M. W., Niazi, S., Raza, H., Yan, Y., & Chen, Q. (2025) · Journal of Agricultural and Food Chemistry · doi:10.1021/acs.jafc.4c06338 · Cited by 65
Cancer immunomodulation using bispecific aptamers
Thomas, B. J., Porciani, D., & Burke, D. H. (2022) · Molecular Therapy — Nucleic Acids · doi:10.1016/j.omtn.2022.01.008 · Cited by 62
McConnell, E. M., Holahan, M. R., & DeRosa, M. C. (2014) · Nucleic Acid Therapeutics · doi:10.1089/nat.2014.0492 · Cited by 62
Advances in structure-switching aptasensing towards real time detection of cytokines
Cao, C., Zhang, F., Goldys, E. M., Gao, F., & Liu, G. (2018) · TrAC Trends in Analytical Chemistry · doi:10.1016/j.trac.2018.03.002 · Cited by 60
Discovery of indole-modified aptamers for highly specific recognition of protein glycoforms
Yoshikawa, A. M., Rangel, A. E., Feagin, T., Chun, E. M., Wan, L., Li, A., Möckl, L., Wu, D., Eisenstein, M. S., Pitteri, S. J., et al. (2021) · Nature Communications · doi:10.1038/s41467-021-26933-1 · Cited by 57
Aptamer-iRNAs as Therapeutics for Cancer Treatment
Soldevilla, M. M., Meraviglia-Crivelli, D., Menon, A. P., & Pastor, F. (2018) · Pharmaceuticals · doi:10.3390/ph11040108 · Cited by 54
Aptamers: Molecular Tools for Medical Diagnosis
Özalp, V. C., Kavruk, M., Dilek, Ö., & Bayraç, A. T. (2015) · Current Topics in Medicinal Chemistry · doi:10.2174/1568026615666150413154233 · Cited by 51
Haruta, K., Otaki, N., Nagamine, M., Kayo, T., Sasaki, A., Hiramoto, S., Takahashi, M., Hota, K., Sato, H., & Yamazaki, H. (2016) · Nucleic Acid Therapeutics · doi:10.1089/nat.2016.0627 · Cited by 52
Advances in aptamer-based drug delivery vehicles for cancer therapy
Ghasemi, K., Darroudi, M., Rahimmanesh, I., Ghomi, M., Hassanpour, M., Sharifi, E., Yousefiasl, S., Ahmadi, S., Zarrabi, A., Borzacchiello, A., et al. (2022) · Biomaterials Advances · doi:10.1016/j.bioadv.2022.213077 · Cited by 50
Matsunaga, K., Kimoto, M., Lim, V. W., Tan, H. P., Wong, Y., Sun, W. Y., Vasoo, S. S., Leo, Y., & Hirao, I. (2021) · Nucleic Acids Research · doi:10.1093/nar/gkab515 · Cited by 50
Komarova, N. V., Panova, O. S., Titov, A., & Kuznetsov, A. E. (2022) · Biomedicines · doi:10.3390/biomedicines10051085 · Cited by 49
Dobrovolskaia, M. A., & McNeil, S. E. (2015) · Expert Opinion on Biological Therapy · doi:10.1517/14712598.2015.1014794 · Cited by 49
Bayramoğlu, G., Özalp, V. C., Dincbal, U., & Arica, M. Y. (2018) · ACS Biomaterials Science & Engineering · doi:10.1021/acsbiomaterials.8b00018 · Cited by 49
Sypabekova, M., Aitkulov, A., Blanc, W., & Tosi, D. (2020) · Biosensors and Bioelectronics · doi:10.1016/j.bios.2020.112365 · Cited by 48
Cell-specific aptamers as potential drugs in therapeutic applications: A review of current progress
Yuhan, J., Zhu, L., Zhu, L., Huang, K., He, X., & Xu, W. (2022) · Journal of Controlled Release · doi:10.1016/j.jconrel.2022.04.039 · Cited by 51
Towards applications of synthetic genetic polymers in diagnosis and therapy
Taylor, A. I., Arangundy‐Franklin, S., & Holliger, P. (2014) · Current Opinion in Chemical Biology · doi:10.1016/j.cbpa.2014.09.022 · Cited by 46
Oligonucleotide Aptamer-Mediated Precision Therapy of Hematological Malignancies
Yang, S., Li, H., Xu, L., Deng, Z., Han, W., Liu, Y., Jiang, W., & Zu, Y. (2018) · Molecular Therapy — Nucleic Acids · doi:10.1016/j.omtn.2018.08.023 · Cited by 46
Jarvis, T. C., Davies, D. R., Hisaminato, A., Resnicow, D. I., Gupta, S., Waugh, S. M., Nagabukuro, A., Wadatsu, T., Hishigaki, H., Gawande, B. N., et al. (2015) · Structure · doi:10.1016/j.str.2015.03.027 · Cited by 41
Self-citationHirota, M., Murakami, I., Ishikawa, Y., Suzuki, T. W., Sumida, S.-I., Ibaragi, S., Kasai, H., Horai, N., Drolet, D. W., Gupta, S., et al. (2015) · Nucleic Acid Therapeutics · doi:10.1089/nat.2015.0567 · Cited by 41
Self-citationThevendran, R., Sarah, S., Tang, T., & Citartan, M. (2020) · Journal of Controlled Release · doi:10.1016/j.jconrel.2020.04.051 · Cited by 40
The Potential of Aptamer-Mediated Liquid Biopsy for Early Detection of Cancer
Roy, D., Pascher, A., Juratli, M. A., & Sporn, J. C. (2021) · International Journal of Molecular Sciences · doi:10.3390/ijms22115601 · Cited by 37
Aptamers: A Feasible Technology in Cancer Immunotherapy
Soldevilla, M. M., Villanueva, H., & Pastor, F. (2016) · Journal of Immunology Research · doi:10.1155/2016/1083738 · Cited by 37
Novel insights into the role of aptamers in the fight against cancer
Maimaitiyiming, Y., Hong, D. F., Yang, C., & Naranmandura, H. (2019) · Journal of Cancer Research and Clinical Oncology · doi:10.1007/s00432-019-02882-7 · Cited by 34
Li, K., Deng, J., Jin, H., Yang, X., Fan, X., Li, L., Zhao, Y., Guan, Z., Wu, Y., Zhang, L., et al. (2016) · Organic & Biomolecular Chemistry · doi:10.1039/c6ob02577c · Cited by 32
Pharmacokinetic Properties of DNA Aptamers with Base Modifications
Gupta, S., Drolet, D. W., Wolk, S. K., Waugh, S. M., Rohloff, J. C., Carter, J. D., Mayfield, W. S., Otis, M. R., Fowler, C. R., Suzuki, T. W., et al. (2017) · Nucleic Acid Therapeutics · doi:10.1089/nat.2017.0683 · Cited by 31
Self-citationA highly sensitive and selective impedimetric aptasensor for interleukin-17 receptor A
Jo, H., Kim, S.-K., Youn, H., Lee, H., Lee, K., Jeong, J., Mok, J., Kim, S., Park, H., & Ban, C. (2016) · Biosensors and Bioelectronics · doi:10.1016/j.bios.2016.02.050 · Cited by 30
Qiao, Z., Pan, X., Parlayan, C., Ojima, H., & Kondo, T. (2016) · Biochimica et Biophysica Acta (BBA) - Proteins and Proteomics · doi:10.1016/j.bbapap.2016.09.011 · Cited by 30
Molecular modeling and SPRi investigations of interleukin 6 (IL6) protein and DNA aptamers
Rhinehardt, K. L., Vance, S. A., Mohan, R. V., Sandros, M. G., & Srinivas, G. (2017) · Journal of Biomolecular Structure and Dynamics · doi:10.1080/07391102.2017.1338619 · Cited by 30
Virus-based SELEX (viro-SELEX) allows development of aptamers targeting knotty proteins
Narayan, C., Kwon, J., Kim, C., Kim, S., & Jang, S. K. (2019) · The Analyst · doi:10.1039/c9an01943j · Cited by 29
Nucleic Acid Aptamer: A Novel Potential Diagnostic and Therapeutic Tool for Leukemia
Tan, Y., Li, Y., & Tang, F. (2019) · OncoTargets and Therapy · doi:10.2147/ott.s223946 · Cited by 28
Yu, F., Gudmundsdotter, L., Akal, A., Gunneriusson, E., Frejd, F. Y., & Nygren, P. (2014) · mAbs · doi:10.4161/mabs.36089 · Cited by 27
Kimoto, M., Matsunaga, K., & Hirao, I. (2015) · Methods in molecular biology · doi:10.1007/978-1-4939-3197-2_4 · Cited by 27
Chemically Modified Aptamers in Biological Analysis
Shen, R., Tan, J., & Yuan, Q. (2020) · ACS Applied Bio Materials · doi:10.1021/acsabm.0c00062 · Cited by 27
Yin, W., Pham, C. V., Wang, T., Shamaileh, H. A., Chowdhury, R., Patel, S., Li, Y., Kong, L., Hou, Y., Zhu, Y., et al. (2022) · Biomolecules · doi:10.3390/biom12111623 · Cited by 26
Trausch, J. J., Shank-Retzlaff, M. L., & Verch, T. (2017) · Analytical Chemistry · doi:10.1021/acs.analchem.6b04852 · Cited by 26
Measuring Antibody-Antigen Binding Kinetics Using Surface Plasmon Resonance
Hearty, S., Leonard, P., Ma, H., & O’Kennedy, R. J. (2018) · Methods in molecular biology · doi:10.1007/978-1-4939-8648-4_22 · Cited by 26
Egli, M., & Lybrand, T. P. (2019) · Journal of the American Chemical Society · doi:10.1021/jacs.9b00104 · Cited by 26
Brown, A., Brill, J., Amini, R., Nurmi, C., & Li, Y. (2024) · Angewandte Chemie · doi:10.1002/ange.202318665 · Cited by 25
Civit, L., Théodorou, I., Frey, F., Weber, H., Lingnau, A., Gröber, C., Blank, M., Dambrune, C., Stunden, J., Beyer, M., et al. (2019) · Scientific Reports · doi:10.1038/s41598-019-41460-2 · Cited by 25
Evolving A RIG-I Antagonist: A Modified DNA Aptamer Mimics Viral RNA
Ren, X., Gelinas, A. D., Linehan, M. M., Iwasaki, A., Wang, W., Janjić, N., & Pyle, A. M. (2021) · Journal of Molecular Biology · doi:10.1016/j.jmb.2021.167227 · Cited by 21
Targeting IL-6 by engineered Lactococcus lactis via surface-displayed affibody
Zahirović, A., & Berlec, A. (2022) · Microbial Cell Factories · doi:10.1186/s12934-022-01873-7 · Cited by 20
Side chain determinants of biopolymer function during selection and replication
Lichtor, P. A., Chen, Z., Elowe, N. H., Chen, J. C., & Liu, D. R. (2019) · Nature Chemical Biology · doi:10.1038/s41589-019-0229-2 · Cited by 20
Broadly neutralizing aptamers to SARS-CoV-2: A diverse panel of modified DNA antiviral agents
Gelinas, A. D., Tan, T. K., Liu, S., Gilbert‐Jaramillo, J., Chadwick, J., Harding, A. C., Zhang, C., Ream, B. E., Chase, C. N., Otis, M. R., et al. (2023) · Molecular Therapy — Nucleic Acids · doi:10.1016/j.omtn.2023.01.008 · Cited by 18
Self-citationShatunova, E. A., Korolev, M. A., Omelchenko, V. O., Kurochkina, Y. D., Davydova, A., Venyaminova, A. G., & Vorobyeva, M. (2020) · Biomedicines · doi:10.3390/biomedicines8110527 · Cited by 21
Aptamers as the chaperones (Aptachaperones) of drugs-from siRNAs to DNA nanorobots
Citartan, M., Kaur, H., Presela, R., & Tang, T. (2019) · International Journal of Pharmaceutics · doi:10.1016/j.ijpharm.2019.118483 · Cited by 17
Therapeutic Interventions into Innate Immune Diseases by Means of Aptamers
Yasmeen, F., Seo, H., Javaid, N., Kim, M. S., & Choi, S. (2020) · Pharmaceutics · doi:10.3390/pharmaceutics12100955 · Cited by 16
Recent Advances in Aptamers Targeting Immune System
Hu, P.-P. (2016) · Inflammation · doi:10.1007/s10753-016-0437-9 · Cited by 16
The emerging potential of Aptamers as therapeutic agents in infection and inflammation
Stephens, M. (2022) · Pharmacology & Therapeutics · doi:10.1016/j.pharmthera.2022.108173 · Cited by 15
Schneider, D. J., Lynch, S. A., Gelinas, A. D., Ostroff, R. M., Rohloff, J. C., Williams, P., Janjić, N., & Drolet, D. W. (2022) · Elsevier eBooks · doi:10.1016/b978-0-12-821595-1.00007-5 · Cited by 14
Self-citationXu, X., Zhang, C., Denton, D. T., O’Connell, D., Drolet, D. W., & Geisbrecht, B. V. (2021) · The Journal of Immunology · doi:10.4049/jimmunol.2001260 · Cited by 15
Self-citationGholikhani, T., Kumar, S., Valizadeh, H., Mahdinloo, S., Adibkia, K., Zakeri‐Milani, P., Barzegar-Jalali, M., & Jimenez, B. (2022) · International Journal of Molecular Sciences · doi:10.3390/ijms232214475 · Cited by 15
Bioconjugated nanomaterials for monitoring food contamination
Hussain, B., Yüce, M., Ullah, N., & Budak, H. (2017) · Elsevier eBooks · doi:10.1016/b978-0-12-804301-1.00003-5 · Cited by 15
Yao, L., Wang, L., Liu, S., Qu, H., Mao, Y., Li, Y., & Zheng, L. (2024) · Chemical Science · doi:10.1039/d4sc02183e · Cited by 14
Aptamer‑based therapy for targeting key mediators of cancer metastasis (Review)
Alhamhoom, Y., Sobeai, H. M. A., Alsanea, S., & Alhoshani, A. (2022) · International Journal of Oncology · doi:10.3892/ijo.2022.5355 · Cited by 15
Influence of 5-N-carboxamide modifications on the thermodynamic stability of oligonucleotides
Wolk, S. K., Shoemaker, R. L., Mayfield, W., Mestdagh, A. L., & Janjić, N. (2015) · Nucleic Acids Research · doi:10.1093/nar/gkv981 · Cited by 13
Selection of optimised ligands by fluorescence-activated bead sorting
Paul, A. R., Falsaperna, M., Lavender, H., Garrett, M. D., & Serpell, C. J. (2023) · Chemical Science · doi:10.1039/d3sc03581f · Cited by 13
Aptamers Against Immunologic Targets: Diagnostic and Therapeutic Prospects
Vorobyeva, M., Timoshenko, V., Vorobjev, P., & Venyaminova, A. G. (2015) · Nucleic Acid Therapeutics · doi:10.1089/nat.2015.0568 · Cited by 13
Nucleobase modification by an RNA enzyme
Poudyal, R. R., Nguyen, P. D. M., Lokugamage, M. P., Callaway, M. K., Gavette, J. V., Krishnamurthy, R., & Burke, D. H. (2016) · Nucleic Acids Research · doi:10.1093/nar/gkw1199 · Cited by 14
Decreased IL-6 induces sensitivity of hepatocellular carcinoma cells to sorafenib
Yang, J., Wang, J., & Luo, J. (2019) · Pathology - Research and Practice · doi:10.1016/j.prp.2019.152565 · Cited by 13
Targeting Unique Epitopes on Highly Similar Proteins GDF-11 and GDF-8 with Modified DNA Aptamers
Ochsner, U. A., Green, L. S., Rice, T., Olivas, E., Janjić, N., & Katilius, E. (2019) · Biochemistry · doi:10.1021/acs.biochem.9b00760 · Cited by 14
Enhancing CAR-T Cell Therapy with Functional Nucleic Acids
Maru, B., Nadeau, L., & McKeague, M. (2021) · ACS Pharmacology & Translational Science · doi:10.1021/acsptsci.1c00188 · Cited by 12
Investigation of the Stereochemical-Dependent DNA and RNA Binding of Arginine-Based Nucleopeptides
Tomassi, S., Franco-Montalbán, F., Russo, R., Novellino, E., Messere, A., & Maro, S. D. (2019) · Symmetry · doi:10.3390/sym11040567 · Cited by 12
Status and Prospects of Aptamers as Drug Components
Mattice, C., & DeRosa, M. C. (2015) · BioDrugs · doi:10.1007/s40259-015-0126-5 · Cited by 11
Chunta, S., Khongwichit, S., Swangphon, P., Srisuk, M., Lieberzeit, P. A., & Amatatongchai, M. (2025) · ACS Applied Materials & Interfaces · doi:10.1021/acsami.5c07018 · Cited by 10
Nucleic acid aptamers in orthopedic diseases: promising therapeutic agents for bone disorders
He, Z., Peng, Q., Bin, W., Zhao, L., Chen, Y., Zhang, Y., Yang, W., Yan, X., & Liu, H. (2025) · Bone Research · doi:10.1038/s41413-025-00447-8 · Cited by 11
Metadata
- Authors
- Gupta, S., Hirota, M., Waugh, S. M., Murakami, I., Suzuki, T., Muraguchi, M., Shibamori, M., Ishikawa, Y., Jarvis, T. C., Carter, J. D., Zhang, C., Gawande, B., Vrkljan, M., Janjic, N., & Schneider, D. J.
- Affiliations
- SomaLogic (United States) (US)
- Corresponding author
- Schneider, Daniel J.
- Venue
- Journal of Biological Chemistry
- Publisher
- Elsevier BV
- Published
- 2014-03
- Volume
- 289
- Issue
- 12
- Pages
- 8706-8719
- ISSN
- 0021-9258 (ISSN-L)
- PMC
- PMC3961692
- OpenAlex
- W2084203294
- Cited by
- 151
- References
- 52
- Citations by year
- 2026: 3 · 2025: 13 · 2024: 7 · 2023: 10 · 2022: 16 · 2021: 9 · 2020: 13 · 2019: 17 · 2018: 14 · 2017: 13 · 2016: 14 · 2015: 16 · 2014: 6
- FWCI
- 6.69
- Type
- journal article
- Language
- en
- Open access
- hybrid
- doi.org
- Licence
- Locations
- Journal of Biological Chemistry (publishedVersion, cc-by)
- Europe PMC (PubMed Central) (publishedVersion, cc-by)
- PubMed Central (publishedVersion, cc-by)
- PubMed (publishedVersion)
- Topics
- Life Sciences › Biochemistry, Genetics and Molecular Biology › Molecular Biology › Advanced biosensing and bioanalysis techniques
- Life Sciences › Biochemistry, Genetics and Molecular Biology › Molecular Biology › DNA and Nucleic Acid Chemistry
- Life Sciences › Biochemistry, Genetics and Molecular Biology › Molecular Biology › RNA Interference and Gene Delivery
- Keywords
- interleukin-6, SOMAmer, IL-6 receptor, cytokine signaling inhibition, SELEX, serum stability, tumor cell proliferation, inflammatory diseases
- MeSH terms
- Interleukin-6 Inhibitors, Amino Acid Sequence, Animals, Anti-Inflammatory Agents, Base Sequence, Cricetulus, Humans, Macaca fascicularis, Molecular Sequence Data, Interleukin-6, CHO Cells, Receptors, Interleukin-6, Serum, Mice, Rats, SELEX Aptamer Technique, Aptamers, Nucleotide, Drug Discovery
About these checks
Registry, retraction, Cites and statistics results are computed, not judged, with one exception: a printed reference that no index lists is read once by a model before it counts as a citation error. Claims are extracted by a model and kept only when their quote appears verbatim in the text; each cited source is then checked, with a model’s help, for whether it says what the claim relies on. Those verdicts can be wrong — read the claim’s quote and the cited source before relying on one.
Statistics and arithmetic are recomputed, not judged.
Confidence bands are shown only for fields calibrated on our annotated test set. None is calibrated yet, so no band is shown.
What counts as a claim ›How we measure confidence ›How we check this ›
Are you an author, or do you see a problem with this page? Request a review
