Cited by 310Mitochondrial Function and PathologyBiochemical Acid Research StudiesRedox biology and oxidative stress

The DOI matches its Crossref record; 87 of the 87 references it cites were found in a registry or an index.

The 2-Oxoacid Dehydrogenase Complexes in Mitochondria Can Produce Superoxide/Hydrogen Peroxide at Much Higher Rates Than Complex I

Open access
Quinlan, Casey L., Goncalves, Renata L.S., Hey-Mogensen, Martin, Yadava, Nagendra, Bunik, Victoria I., Brand, Martin D.·2014·Journal of Biological Chemistry

Abstract

Several flavin-dependent enzymes of the mitochondrial matrix utilize NAD(+) or NADH at about the same operating redox potential as the NADH/NAD(+) pool and comprise the NADH/NAD(+) isopotential enzyme group. Complex I (specifically the flavin, site IF) is often regarded as the major source of matrix superoxide/H2O2 production at this redox potential. However, the 2-oxoglutarate dehydrogenase (OGDH), branched-chain 2-oxoacid dehydrogenase (BCKDH), and pyruvate dehydrogenase (PDH) complexes are also capable of considerable superoxide/H2O2 production. To differentiate the superoxide/H2O2-producing capacities of these different mitochondrial sites in situ, we compared the observed rates of H2O2 production over a range of different NAD(P)H reduction levels in isolated skeletal muscle mitochondria under conditions that favored superoxide/H2O2 production from complex I, the OGDH complex, the BCKDH complex, or the PDH complex. The rates from all four complexes increased at higher NAD(P)H/NAD(P)(+) ratios, although the 2-oxoacid dehydrogenase complexes produced superoxide/H2O2 at high rates only when oxidizing their specific 2-oxoacid substrates and not in the reverse reaction from NADH. At optimal conditions for each system, superoxide/H2O2 was produced by the OGDH complex at about twice the rate from the PDH complex, four times the rate from the BCKDH complex, and eight times the rate from site IF of complex I. Depending on the substrates present, the dominant sites of superoxide/H2O2 production at the level of NADH may be the OGDH and PDH complexes, but these activities may often be misattributed to complex I.

Overview

The claims and statistics of this paper haven’t been checked yet.

Run the check — free, no account needed. It reads the open-access text and checks the sources it cites.

A few free checks a day · papers already verified open instantly · results are public

Integrity signals

Registry

Crossref · 10.1074/jbc.m113.545301

Cites

87 of 87 references verified0 citation errors · 0 not checkable

Statistics

Figures

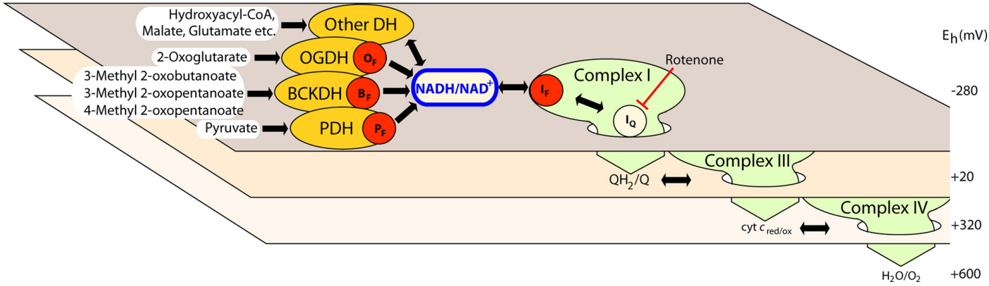
FIGURE 1 The NADH/NAD ÷ isopotential group and its component superoxide/H2O2-producing enzymes. The three planes represent different isopotential groups of redox centers in mitochondria. Each group contains multiple redox centers operating at about the same redox potential (E h ): centers around NADH/NAD + at E h ∼-280 mV, around QH2/Q at E h ∼+ 20 mV, and around cytochrome c at E h ∼+ 320 mV (34). The normal flow of electrons from substrate dehydrogenases through NADH and the respiratory complexes of the electron transport chain to oxygen are indicated by the large green arrows dropping down through the isopotential planes. Electrons from NAD-linked substrates enter the NADH/NAD + pool at E h ∼-280 mV through NAD-linked dehydrogenases ( DH ) including the OGDH, BCKDH, and PDH complexes and flow into complex I (site I F ). In the absence of rotenone they then drop down via site IQ to QH2/QinthenextisopotentialpoolthroughcomplexIIItocytochrome c andultimately to their final acceptor, oxygen. In the presence of rotenone ( red blunted arrow ) other sites of superoxide and H 2 O2 production are fully oxidized and, therefore, do not leak electrons to O 2 , and only the sites in the NADH/NAD + isopotential pool are active. These sites ( red dots ) are site I F , the flavin of the OGDH complex (O F ), the flavin of the BCKDH complex (B F ), and the flavin of the PDH complex (P F ) (see Ref. 26).
FIGURE 1 The NADH/NAD ÷ isopotential group and its component superoxide/H2O2-producing enzymes. The three planes represent different isopotential groups of redox centers in mitochondria. Each group contains multiple redox centers operating at about the same redox potential (E h ): centers around NADH/NAD + at E h ∼-280 mV, around QH2/Q at E h ∼+ 20 mV, and around cytochrome c at E h ∼+ 320 mV (34). The normal flow of electrons from substrate dehydrogenases through NADH and the respiratory complexes of the electron transport chain to oxygen are indicated by the large green arrows dropping down through the isopotential planes. Electrons from NAD-linked substrates enter the NADH/NAD + pool at E h ∼-280 mV through NAD-linked dehydrogenases ( DH ) including the OGDH, BCKDH, and PDH complexes and flow into complex I (site I F ). In the absence of rotenone they then drop down via site IQ to QH2/QinthenextisopotentialpoolthroughcomplexIIItocytochrome c andultimately to their final acceptor, oxygen. In the presence of rotenone ( red blunted arrow ) other sites of superoxide and H 2 O2 production are fully oxidized and, therefore, do not leak electrons to O 2 , and only the sites in the NADH/NAD + isopotential pool are active. These sites ( red dots ) are site I F , the flavin of the OGDH complex (O F ), the flavin of the BCKDH complex (B F ), and the flavin of the PDH complex (P F ) (see Ref. 26).CC-BY · From the PDF
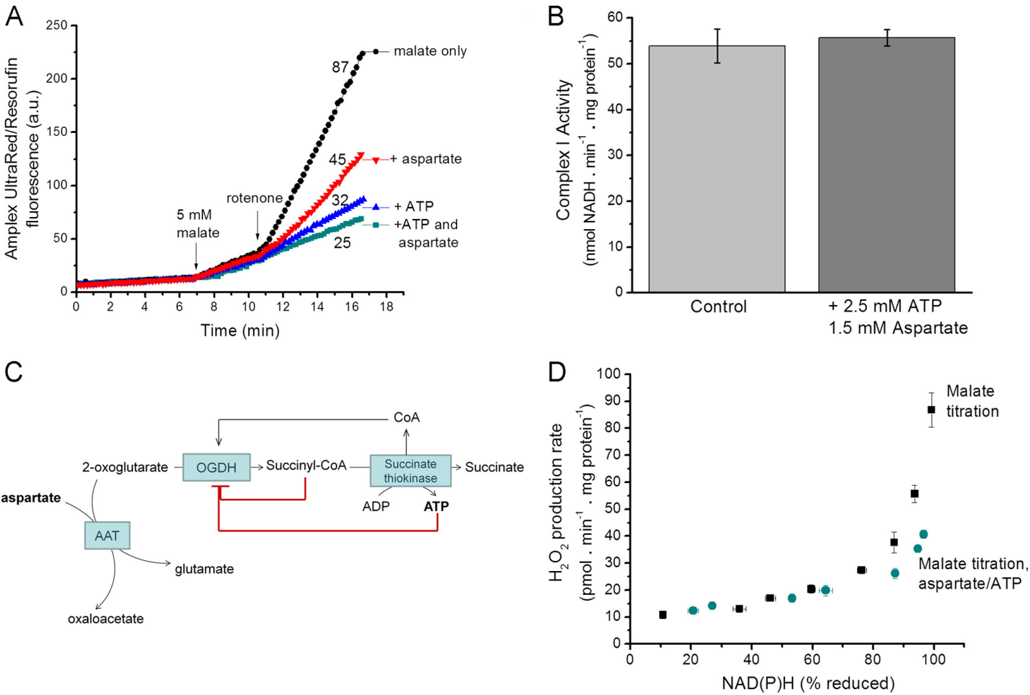
FIGURE 2 Superoxide/H2O2 production with malate as substrate; complex I and the OGDH complex. A , Amplex UltraRed traces illustrate that H2O2 production rates with 5 mM malate as substrate were decreased by the addition of 2.5 mM ATP and 1.5 mM aspartate. Mitochondria were suspended in non-phosphorylating medium, and 4 𝛍 M rotenone was added where indicated. A representative trace is shown; numbers indicate mean rates in pmol of H2O2 H18528 min -1 H18528 mg of protein -1 from four replicates. a.u. , arbitrary units. B , complex I activity measured in alamethicin-permeabilized mitochondria as the rotenone-sensitive NADH:Q-oxidoreductase activity at 30 °C was unaffected by addition of ATP plus aspartate. C , schematic to illustrate that in isolated mitochondria ATP and aspartate may indirectly inhibit the OGDH complex by decreasing its substrates 2-oxoglutarate (through aspartate aminotransferase ( AAT )) and CoA (through inhibition of succinate thiokinase), increasing its inhibitory product succinyl CoA (through inhibition of succinate thiokinase) and through direct inhibitory effects of ATP on the enzyme. D , dependence of superoxide/H 2 O2 production on the redox state of NAD(P)H (measured by autofluorescence). Malate was titrated from 20 𝛍 M-5 mM in the presence of 4 𝛍 Mrotenone either in the presence or absence of 1.5 mM aspartate and 2.5 mM ATP. Data in A are representative traces. Data in B and D are the means ± S.E. ( n = 3).
FIGURE 2 Superoxide/H2O2 production with malate as substrate; complex I and the OGDH complex. A , Amplex UltraRed traces illustrate that H2O2 production rates with 5 mM malate as substrate were decreased by the addition of 2.5 mM ATP and 1.5 mM aspartate. Mitochondria were suspended in non-phosphorylating medium, and 4 𝛍 M rotenone was added where indicated. A representative trace is shown; numbers indicate mean rates in pmol of H2O2 H18528 min -1 H18528 mg of protein -1 from four replicates. a.u. , arbitrary units. B , complex I activity measured in alamethicin-permeabilized mitochondria as the rotenone-sensitive NADH:Q-oxidoreductase activity at 30 °C was unaffected by addition of ATP plus aspartate. C , schematic to illustrate that in isolated mitochondria ATP and aspartate may indirectly inhibit the OGDH complex by decreasing its substrates 2-oxoglutarate (through aspartate aminotransferase ( AAT )) and CoA (through inhibition of succinate thiokinase), increasing its inhibitory product succinyl CoA (through inhibition of succinate thiokinase) and through direct inhibitory effects of ATP on the enzyme. D , dependence of superoxide/H 2 O2 production on the redox state of NAD(P)H (measured by autofluorescence). Malate was titrated from 20 𝛍 M-5 mM in the presence of 4 𝛍 Mrotenone either in the presence or absence of 1.5 mM aspartate and 2.5 mM ATP. Data in A are representative traces. Data in B and D are the means ± S.E. ( n = 3).CC-BY · From the PDF
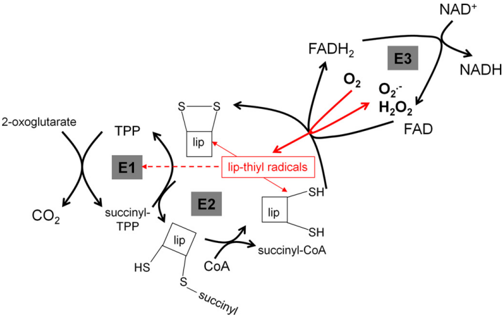
FIGURE 3 Generation of superoxide and H2O2 by the 2-oxoglutarate dehydrogenase complex. The complex contains multiple copies of the three major components: thiamin pyrophosphate ( TPP )-dependent E1, E2, which contains the lipoyl group ( lip ), and E3, which contains FAD. Side reactions involving the E3-bound FAD and the E2-bound lipoyl residues when NAD is limiting are shown in red . Oxidation of FADH2 by O2 can generate superoxide or H2O2 (19-21). When it generates superoxide, the resulting FADH* can reduce lipoyl residues to thiyl radicals (19, 50), which may inactivate E1 ( dashed line ) or dismutate ( arrows to the reduced and oxidized lipoyl species ).
FIGURE 3 Generation of superoxide and H2O2 by the 2-oxoglutarate dehydrogenase complex. The complex contains multiple copies of the three major components: thiamin pyrophosphate ( TPP )-dependent E1, E2, which contains the lipoyl group ( lip ), and E3, which contains FAD. Side reactions involving the E3-bound FAD and the E2-bound lipoyl residues when NAD is limiting are shown in red . Oxidation of FADH2 by O2 can generate superoxide or H2O2 (19-21). When it generates superoxide, the resulting FADH* can reduce lipoyl residues to thiyl radicals (19, 50), which may inactivate E1 ( dashed line ) or dismutate ( arrows to the reduced and oxidized lipoyl species ).CC-BY · From the PDF
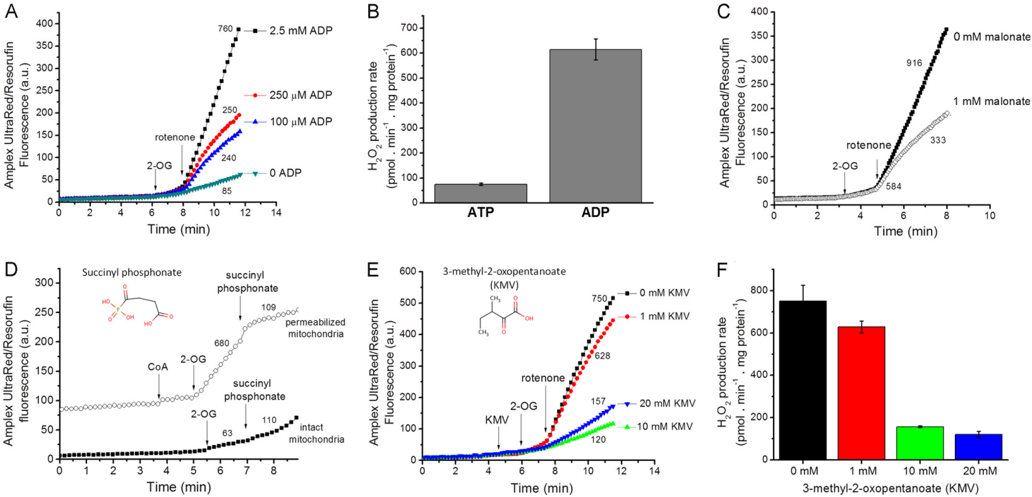
FIGURE 4 Theproperties of superoxide/H2O2 production by the OGDH complex. A , typical Amplex UltraRed traces indicate that mitochondria suspended in non-phosphorylating medium with 2.5 mM 2-oxoglutarate ( 2-OG ) as substrate generated H 2 O2 at relatively low rates in the absence of the positive regulator ADP. Rates were greatly enhanced by the addition of 4 𝛍 Mrotenone and were dependent on the ADP concentration. a.u. , arbitrary units. B , mean rates of H2O2 production with 2.5 mM 2-oxoglutarate and 4 𝛍 M rotenone in the presence of either 2.5 mM ATP or 2.5 mM ADP. Data are the mean ± S.E. ( n = 3). C , Effect of 1 mMmalonate on the rates of H 2 O2 production with 2.5 mM 2-oxoglutarate as substrate in the presence of 2.5 mM ADP. D , effect of 2 mM succinyl phosphonate onH2O2 productionrates in intact and alamethicin-permeabilized mitochondria. In the permeabilized mitochondria, 50 𝛍 M2-oxoglutarate was oxidized in the presence of 100 𝛍 MCoA.In the intact mitochondria, 50 𝛍 M2-oxoglutarate was oxidized in the presence of 2.5 mM ADP and 4 𝛍 Mrotenone. E , Amplex UltraRed traces show the effect of different concentrations of KMV in the presence of 2.5 mM 2-oxoglutarate and 2.5 mM ADP. F , mean rates of H2O2 production when OGDH was inhibited by increasing concentrations of 2-methyl-3-oxopentanoate in the presence of 2.5 mM 2-oxoglutarate and 2.5 mM ADP. Data are the means ± S.E. ( n = 3). Panels A , C , D , and E showrepresentativetraces; additions are indicated by arrows ; numbers indicate meanrates in pmol of H2O2 H18528 min -1 H18528 mg of protein -1 ( n ≥ 3).
FIGURE 4 Theproperties of superoxide/H2O2 production by the OGDH complex. A , typical Amplex UltraRed traces indicate that mitochondria suspended in non-phosphorylating medium with 2.5 mM 2-oxoglutarate ( 2-OG ) as substrate generated H 2 O2 at relatively low rates in the absence of the positive regulator ADP. Rates were greatly enhanced by the addition of 4 𝛍 Mrotenone and were dependent on the ADP concentration. a.u. , arbitrary units. B , mean rates of H2O2 production with 2.5 mM 2-oxoglutarate and 4 𝛍 M rotenone in the presence of either 2.5 mM ATP or 2.5 mM ADP. Data are the mean ± S.E. ( n = 3). C , Effect of 1 mMmalonate on the rates of H 2 O2 production with 2.5 mM 2-oxoglutarate as substrate in the presence of 2.5 mM ADP. D , effect of 2 mM succinyl phosphonate onH2O2 productionrates in intact and alamethicin-permeabilized mitochondria. In the permeabilized mitochondria, 50 𝛍 M2-oxoglutarate was oxidized in the presence of 100 𝛍 MCoA.In the intact mitochondria, 50 𝛍 M2-oxoglutarate was oxidized in the presence of 2.5 mM ADP and 4 𝛍 Mrotenone. E , Amplex UltraRed traces show the effect of different concentrations of KMV in the presence of 2.5 mM 2-oxoglutarate and 2.5 mM ADP. F , mean rates of H2O2 production when OGDH was inhibited by increasing concentrations of 2-methyl-3-oxopentanoate in the presence of 2.5 mM 2-oxoglutarate and 2.5 mM ADP. Data are the means ± S.E. ( n = 3). Panels A , C , D , and E showrepresentativetraces; additions are indicated by arrows ; numbers indicate meanrates in pmol of H2O2 H18528 min -1 H18528 mg of protein -1 ( n ≥ 3).CC-BY · From the PDF
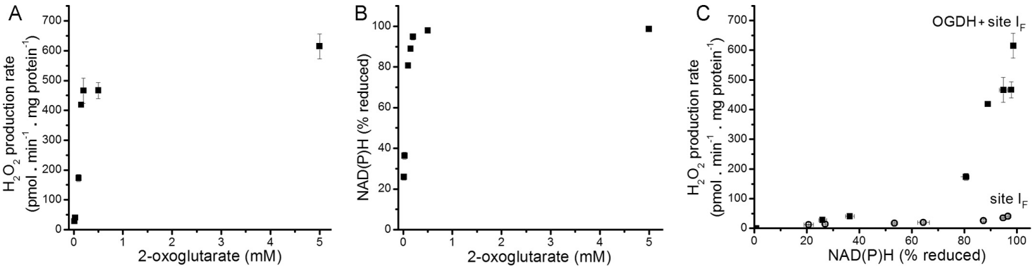
FIGURE5 RelationshipbetweentheobservedrateofH2O2 productionbytheOGDHcomplexandthereductionstateofNAD(P)H . A , dependenceofthe rate of H 2 O2 production on 2-oxoglutarate concentration in non-phosphorylating medium in the presence of 2.5 mM ADP after the addition of 4 𝛍 Mrotenone. B , dependence of %NAD(P)H reduction on 2-oxoglutarate concentration in non-phosphorylating medium in the presence of 2.5 mM ADP after the addition of rotenone (100% reduction was subsequently established by addition of 5 mM malate). C , relationship between the observed rate of H 2 O2 production from the OGDHcomplex(plus site IF ) and NAD(P)H reduction state ( filled squares ), obtained by combining panels A and B ; open symbols are the replotted data for site I F alone from Fig. 2 D . Where not visible, error bars are contained within the points. Data are the means ± S.E. ( n = 4).
FIGURE5 RelationshipbetweentheobservedrateofH2O2 productionbytheOGDHcomplexandthereductionstateofNAD(P)H . A , dependenceofthe rate of H 2 O2 production on 2-oxoglutarate concentration in non-phosphorylating medium in the presence of 2.5 mM ADP after the addition of 4 𝛍 Mrotenone. B , dependence of %NAD(P)H reduction on 2-oxoglutarate concentration in non-phosphorylating medium in the presence of 2.5 mM ADP after the addition of rotenone (100% reduction was subsequently established by addition of 5 mM malate). C , relationship between the observed rate of H 2 O2 production from the OGDHcomplex(plus site IF ) and NAD(P)H reduction state ( filled squares ), obtained by combining panels A and B ; open symbols are the replotted data for site I F alone from Fig. 2 D . Where not visible, error bars are contained within the points. Data are the means ± S.E. ( n = 4).CC-BY · From the PDF
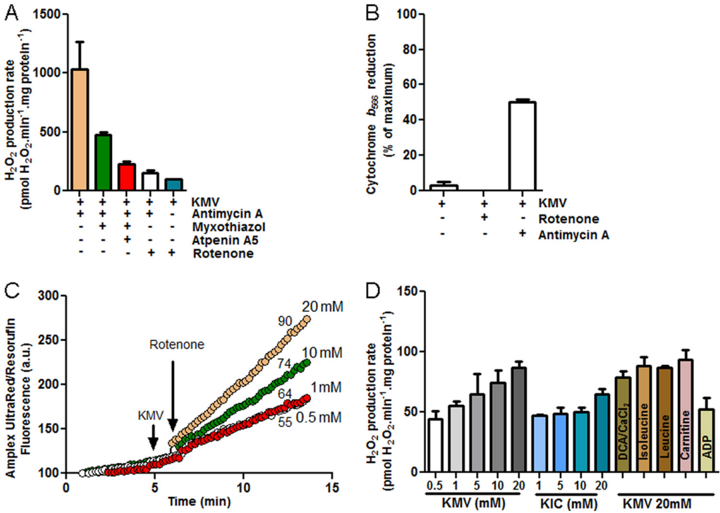
FIGURE 6 The branched-chain 2-oxoacid dehydrogenase complex produces superoxide/H2O2. A , mean rates of H 2O2 production with 20 mM KMV in non-phosphorylating medium in the presence of 2 𝛍 M antimycin A ( beige bar ), 2 𝛍 M antimycin A plus 2 𝛍 M myxothiazol ( green bar ), 2 𝛍 M antimycin A, 2 𝛍 M myxothiazol and 2 𝛍 M atpenin A5 ( red bar ), 2 𝛍 M antimycin A plus 4 𝛍 M rotenone ( white bar ), and 4 𝛍 M rotenone ( blue bar ). Data are the means ± S.E. ( n = 3). B , cytochrome b 566 reduction state in non-phosphorylating medium in the presence of 20 mM 3-methyl-2-oxopentanoate plus 4 𝛍 M rotenone or plus 2 𝛍 M antimycin A. C , typical Amplex UltraRed traces indicate that mitochondria suspended in non-phosphorylating medium with different concentrations of 3-methyl-2-oxopentanoate as substrate generated H 2 O2. Rates were greatly enhanced by the addition of 4 𝛍 M rotenone. a.u. , arbitrary units. Arrows indicate additions; numbers indicate mean rates in pmol of H2O2 H18528 min -1 H18528 mgof protein -1 ( n ≥ 3). D , mean rates of H 2 O2 production in non-phosphorylating medium in the presence of the branched-chain 2-oxoacids KMV or KIC at different concentrations and with 20 mM 3-methyl-2-oxopentanoate in the presence of 4 𝛍 Mrotenoneand 450 nM free Ca 2 + plus 1 mM dichloroacetate ( DCA ), 1 mM isoleucine, 1 mM leucine, 1 mM carnitine, or 2.5 mM ADP. Data are the means ± S.E. ( n = 3).
FIGURE 6 The branched-chain 2-oxoacid dehydrogenase complex produces superoxide/H2O2. A , mean rates of H 2O2 production with 20 mM KMV in non-phosphorylating medium in the presence of 2 𝛍 M antimycin A ( beige bar ), 2 𝛍 M antimycin A plus 2 𝛍 M myxothiazol ( green bar ), 2 𝛍 M antimycin A, 2 𝛍 M myxothiazol and 2 𝛍 M atpenin A5 ( red bar ), 2 𝛍 M antimycin A plus 4 𝛍 M rotenone ( white bar ), and 4 𝛍 M rotenone ( blue bar ). Data are the means ± S.E. ( n = 3). B , cytochrome b 566 reduction state in non-phosphorylating medium in the presence of 20 mM 3-methyl-2-oxopentanoate plus 4 𝛍 M rotenone or plus 2 𝛍 M antimycin A. C , typical Amplex UltraRed traces indicate that mitochondria suspended in non-phosphorylating medium with different concentrations of 3-methyl-2-oxopentanoate as substrate generated H 2 O2. Rates were greatly enhanced by the addition of 4 𝛍 M rotenone. a.u. , arbitrary units. Arrows indicate additions; numbers indicate mean rates in pmol of H2O2 H18528 min -1 H18528 mgof protein -1 ( n ≥ 3). D , mean rates of H 2 O2 production in non-phosphorylating medium in the presence of the branched-chain 2-oxoacids KMV or KIC at different concentrations and with 20 mM 3-methyl-2-oxopentanoate in the presence of 4 𝛍 Mrotenoneand 450 nM free Ca 2 + plus 1 mM dichloroacetate ( DCA ), 1 mM isoleucine, 1 mM leucine, 1 mM carnitine, or 2.5 mM ADP. Data are the means ± S.E. ( n = 3).CC-BY · From the PDF
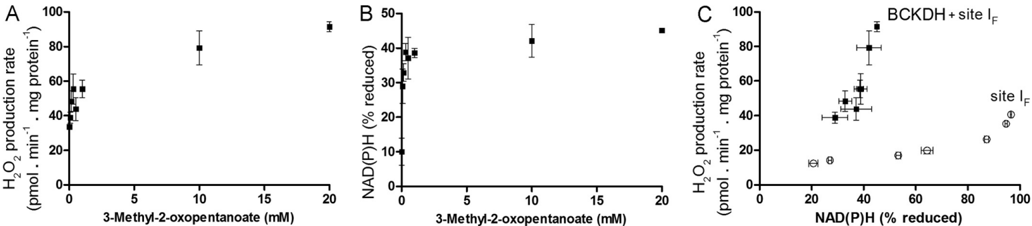
FIGURE 7 Relationship between the observed rate of H2O2 production by the BCKDH complex and the reduction state of NAD(P)H. A , dependence of the rate of H2O2 production on KMV concentration in non-phosphorylating medium after the addition of 4 𝛍 M rotenone. B , dependence of %NAD(P)H reduction on 3-methyl-2-oxopentanoate concentration in non-phosphorylating medium after the addition of rotenone (100% reduction was subsequently established by the addition of 5 mM malate and glutamate). C , relationship between the observed rate of H 2 O2 production from the BCKDH complex (plus site I F ) and NAD(P)H reduction state ( filled squares ) obtained by combining panels A and B ; the open symbols are the replotted data for site I F alone from Fig. 2 D . Where not visible, error bars are contained within the points. Data are the means ± S.E. ( n = 4).
FIGURE 7 Relationship between the observed rate of H2O2 production by the BCKDH complex and the reduction state of NAD(P)H. A , dependence of the rate of H2O2 production on KMV concentration in non-phosphorylating medium after the addition of 4 𝛍 M rotenone. B , dependence of %NAD(P)H reduction on 3-methyl-2-oxopentanoate concentration in non-phosphorylating medium after the addition of rotenone (100% reduction was subsequently established by the addition of 5 mM malate and glutamate). C , relationship between the observed rate of H 2 O2 production from the BCKDH complex (plus site I F ) and NAD(P)H reduction state ( filled squares ) obtained by combining panels A and B ; the open symbols are the replotted data for site I F alone from Fig. 2 D . Where not visible, error bars are contained within the points. Data are the means ± S.E. ( n = 4).CC-BY · From the PDF
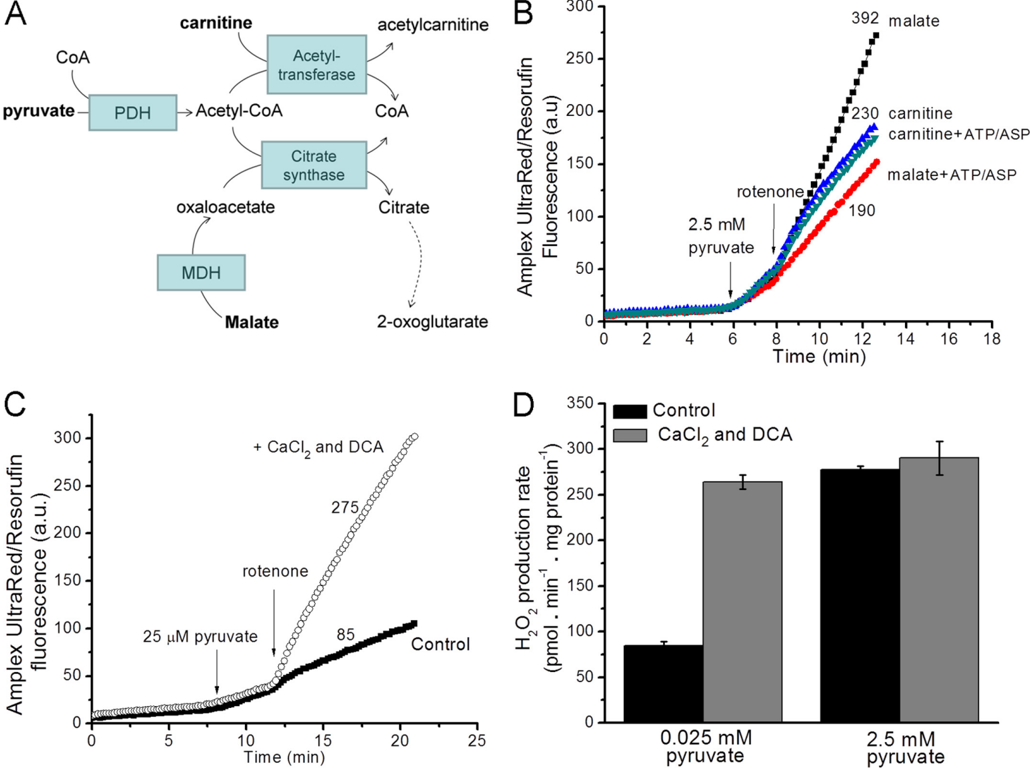
FIGURE 8 Experimental design for measuring superoxide/H2O2 production from the pyruvate dehydrogenase complex. A , carbon flows with pyruvate plus carnitine or pyruvate plus malate as substrates. MDH , malate dehydrogenase. B , H 2 O2 production in non-phosphorylating medium with 2.5 mM pyruvate plus 5 mM malate or 2.5 mM pyruvate plus 5 mM carnitine as substrate. The contribution from other sites during oxidation of these substrate pairs was assessed by the sensitivity of the rates to 2.5 mM ATP and 1.5 mM aspartate ( ASP ). 4 𝛍 M rotenone was added where indicated. a.u. , arbitrary units. C , Amplex UltraRed traces in non-phosphorylating medium show that at a low pyruvate concentration (25 𝛍 M) the rates of H 2 O2 production were low. The presence of 450 nM free Ca 2 + and1mMdichloroacetate( DCA ) increased the observed rate at low pyruvate concentration. D , rates of H 2 O2 production in non-phosphorylating medium at low (25 𝛍 M) and high (2.5 mM) pyruvate concentrations in the presence and absence of 450 nM free Ca 2 + and 1 mM dichloroacetate. Data are the means ± S.E. ( n = 3). Panels B and C show representative traces; numbers indicate mean rates in pmol of H2O2 H18528 min -1 H18528 mgof protein -1 ( n = 3).
FIGURE 8 Experimental design for measuring superoxide/H2O2 production from the pyruvate dehydrogenase complex. A , carbon flows with pyruvate plus carnitine or pyruvate plus malate as substrates. MDH , malate dehydrogenase. B , H 2 O2 production in non-phosphorylating medium with 2.5 mM pyruvate plus 5 mM malate or 2.5 mM pyruvate plus 5 mM carnitine as substrate. The contribution from other sites during oxidation of these substrate pairs was assessed by the sensitivity of the rates to 2.5 mM ATP and 1.5 mM aspartate ( ASP ). 4 𝛍 M rotenone was added where indicated. a.u. , arbitrary units. C , Amplex UltraRed traces in non-phosphorylating medium show that at a low pyruvate concentration (25 𝛍 M) the rates of H 2 O2 production were low. The presence of 450 nM free Ca 2 + and1mMdichloroacetate( DCA ) increased the observed rate at low pyruvate concentration. D , rates of H 2 O2 production in non-phosphorylating medium at low (25 𝛍 M) and high (2.5 mM) pyruvate concentrations in the presence and absence of 450 nM free Ca 2 + and 1 mM dichloroacetate. Data are the means ± S.E. ( n = 3). Panels B and C show representative traces; numbers indicate mean rates in pmol of H2O2 H18528 min -1 H18528 mgof protein -1 ( n = 3).CC-BY · From the PDF
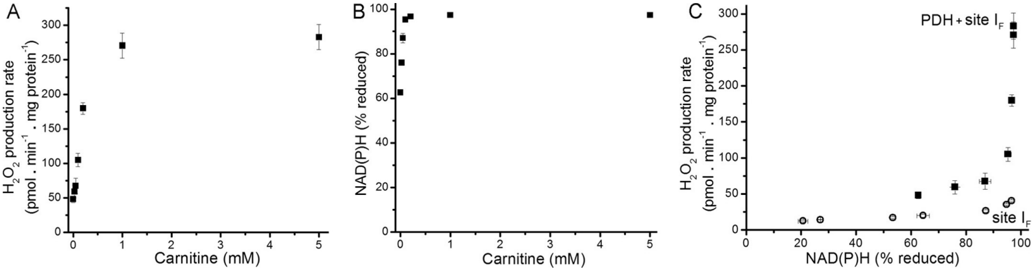
FIGURE 9 Relationship between the observed rate of H 2 O2 production by the PDH complex and the reduction state of NAD(P)H. A , dependence of the rate of H 2 O2 production on carnitine concentration in non-phosphorylating medium in the presence of 2.5 mM pyruvate and 4 𝛍 Mrotenone. B , dependence of %NAD(P)H reduction on carnitine concentration in non-phosphorylating medium after the addition of rotenone (100% reduction was subsequently established by the addition of 5 mM malate). C , relationship between the observed rate of H 2 O2 production from the PDH complex (plus site I F ) and the NAD(P)H reduction state ( filled squares ), obtained by combining panels A and B ; the open symbols are the data for site I F alone from Fig. 2 D . Where not visible, error bars are contained within the points. Data are the means ± S.E. ( n = 3).
FIGURE 9 Relationship between the observed rate of H 2 O2 production by the PDH complex and the reduction state of NAD(P)H. A , dependence of the rate of H 2 O2 production on carnitine concentration in non-phosphorylating medium in the presence of 2.5 mM pyruvate and 4 𝛍 Mrotenone. B , dependence of %NAD(P)H reduction on carnitine concentration in non-phosphorylating medium after the addition of rotenone (100% reduction was subsequently established by the addition of 5 mM malate). C , relationship between the observed rate of H 2 O2 production from the PDH complex (plus site I F ) and the NAD(P)H reduction state ( filled squares ), obtained by combining panels A and B ; the open symbols are the data for site I F alone from Fig. 2 D . Where not visible, error bars are contained within the points. Data are the means ± S.E. ( n = 3).CC-BY · From the PDF
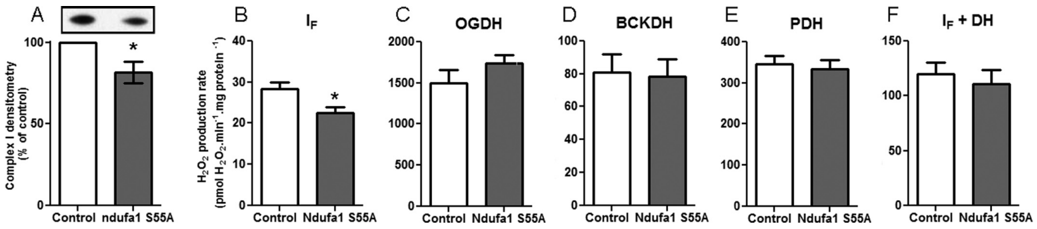
FIGURE10 Superoxide/H2O2 productionbymitochondriafromcomplexI-deficient Ndufa1 S55A/Y mice. A , densitometry of Western blots of mitochondria from wild type and mutant mice probed for the 75-kDa NDUFS1 subunit of complex I ( inset , representative Western blot. Left , control; right , Ndufa S55A/Y ). B-F , superoxide/H2O2 generation in non-phosphorylating medium after the addition of 4 𝛍 M rotenone by mitochondria from control ( white bars ) or complex I deficient ( Ndufa S55A/Y ) mice ( gray bars ) in the presence of 5 mM malate, 2.5 mM ATP, and 1.5 mM aspartate ( B ), 2.5 mM 2-oxoglutarate and 2.5 mM ADP ( C ), 20 mM 3-methyl-2-oxopentanoate ( D ), 2.5 mM pyruvate and 5 mM carnitine ( E ), and 5 mM malate ( F ). DH , NADHdehydrogenases.Datain A are expressed as % of paired control from five independent paired skeletal muscle mitochondrial preparations; error bars indicate 95% confidence limits; *, p < 0.05 by 95% confidence interval. Data in B-F are the means ± S.E. ( n = 5); *, p < 0.05 by Student's t test.
FIGURE10 Superoxide/H2O2 productionbymitochondriafromcomplexI-deficient Ndufa1 S55A/Y mice. A , densitometry of Western blots of mitochondria from wild type and mutant mice probed for the 75-kDa NDUFS1 subunit of complex I ( inset , representative Western blot. Left , control; right , Ndufa S55A/Y ). B-F , superoxide/H2O2 generation in non-phosphorylating medium after the addition of 4 𝛍 M rotenone by mitochondria from control ( white bars ) or complex I deficient ( Ndufa S55A/Y ) mice ( gray bars ) in the presence of 5 mM malate, 2.5 mM ATP, and 1.5 mM aspartate ( B ), 2.5 mM 2-oxoglutarate and 2.5 mM ADP ( C ), 20 mM 3-methyl-2-oxopentanoate ( D ), 2.5 mM pyruvate and 5 mM carnitine ( E ), and 5 mM malate ( F ). DH , NADHdehydrogenases.Datain A are expressed as % of paired control from five independent paired skeletal muscle mitochondrial preparations; error bars indicate 95% confidence limits; *, p < 0.05 by 95% confidence interval. Data in B-F are the means ± S.E. ( n = 5); *, p < 0.05 by Student's t test.CC-BY · From the PDF
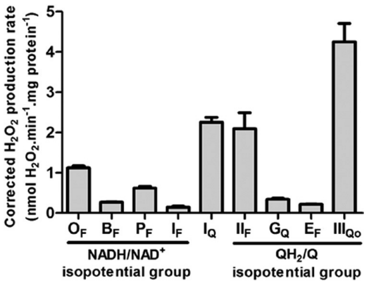
FIGURE 11 Maximumrates of superoxide/H2O2 production from characterized sites of the mitochondrial respiratory chain. The components of the NADH/NAD + isopotential group are: O F , flavin site of 2-oxoglutarate dehydrogenase; BF, flavin site of branched-chain 2-oxoacid dehydrogenase; PF , flavin site of pyruvate dehydrogenase; I F , flavin site of complex I. The ubiquinone binding site of complex I (site I Q) is between isopotential groups. The components of the QH2/Q isopotential group are: II F , flavin site of complex II; G Q, quinone site of mitochondrial glycerol-3-phosphate dehydrogenase; E F , flavin site of the electron transferring flavoprotein/ETF:ubiquinone oxidoreductase system; III Qo, Q o binding site of complex III. All data were mathematically corrected for matrix peroxidase activity using the 1-chloro2,4-dinitrobenzene correction described under 'Experimental Procedures.' Datafor O F , B F , P F , and I F are from Figs. 5 C , 7 C , 9 C , and 2 D (plus aspartate/ATP); other sites are replotted from (16). The maximum rates from O F , BF , and PF were corrected by subtracting the rate from site I F at the same NAD(P)H reduction level. Data are the means ± S.E. ( n ≥ 3).
FIGURE 11 Maximumrates of superoxide/H2O2 production from characterized sites of the mitochondrial respiratory chain. The components of the NADH/NAD + isopotential group are: O F , flavin site of 2-oxoglutarate dehydrogenase; BF, flavin site of branched-chain 2-oxoacid dehydrogenase; PF , flavin site of pyruvate dehydrogenase; I F , flavin site of complex I. The ubiquinone binding site of complex I (site I Q) is between isopotential groups. The components of the QH2/Q isopotential group are: II F , flavin site of complex II; G Q, quinone site of mitochondrial glycerol-3-phosphate dehydrogenase; E F , flavin site of the electron transferring flavoprotein/ETF:ubiquinone oxidoreductase system; III Qo, Q o binding site of complex III. All data were mathematically corrected for matrix peroxidase activity using the 1-chloro2,4-dinitrobenzene correction described under 'Experimental Procedures.' Datafor O F , B F , P F , and I F are from Figs. 5 C , 7 C , 9 C , and 2 D (plus aspartate/ATP); other sites are replotted from (16). The maximum rates from O F , BF , and PF were corrected by subtracting the rate from site I F at the same NAD(P)H reduction level. Data are the means ± S.E. ( n ≥ 3).CC-BY · From the PDF

Verification

Claims the paper makes

The claims and statistics of this paper haven’t been checked yet.

Run the check — free, no account needed. It reads the open-access text and checks the sources it cites.

A few free checks a day · papers already verified open instantly · results are public

Claims other papers make about this one

Each is checked against this paper’s own text: does it say what the citing paper says it does?

Self-check

Percentages, sums and reported differences re-computed from the paper’s own numbers.

The self-check needs the paper’s full text.

Citations

Cites

Show all 87 references

Cited by

Sorted by citations

See all 310

Metadata

Authors
Quinlan, C. L., Goncalves, R. L. S., Hey-Mogensen, M., Yadava, N., Bunik, V. I., & Brand, M. D.
Affiliations
  • Buck Institute for Research on Aging (US)
  • Lomonosov Moscow State University (RU)
Corresponding author
Brand, Martin D.
Venue
Journal of Biological Chemistry
Publisher
Elsevier BV
Published
2014-03
Volume
289
Issue
12
Pages
8312-8325
ISSN
0021-9258 (ISSN-L)
OpenAlex
W1986366581
Cited by
310
References
87
Citations by year
2026: 11 · 2025: 18 · 2024: 14 · 2023: 26 · 2022: 21 · 2021: 41 · 2020: 18 · 2019: 27 · 2018: 21 · 2017: 31 · 2016: 30 · 2015: 33 · 2014: 19
FWCI
15.45
Type
journal article
Language
en
Open access
Locations
  • Journal of Biological Chemistry (publishedVersion, cc-by)
  • PubMed Central (publishedVersion)
  • PubMed (publishedVersion)
Funders
National Institutes of Health (TL1 AG032116)
Topics
  • Life Sciences › Biochemistry, Genetics and Molecular Biology › Molecular Biology › Mitochondrial Function and Pathology
  • Life Sciences › Biochemistry, Genetics and Molecular Biology › Biochemistry › Biochemical Acid Research Studies
  • Life Sciences › Biochemistry, Genetics and Molecular Biology › Molecular Biology › Redox biology and oxidative stress
Keywords
superoxide production, hydrogen peroxide production, 2-oxoglutarate dehydrogenase, pyruvate dehydrogenase complex, complex I, mitochondrial matrix, flavoenzyme, skeletal muscle mitochondria, reactive oxygen species
MeSH terms
Animals, Female, Hydrogen Peroxide, Ketoglutarate Dehydrogenase Complex, Mitochondria, Muscle, NAD, Oxidation-Reduction, Pyruvate Dehydrogenase Complex, Superoxides, Rats, Wistar, Muscle, Skeletal, Rats

About these checks

Registry, retraction, Cites and statistics results are computed, not judged, with one exception: a printed reference that no index lists is read once by a model before it counts as a citation error. Claims are extracted by a model and kept only when their quote appears verbatim in the text; each cited source is then checked, with a model’s help, for whether it says what the claim relies on. Those verdicts can be wrong — read the claim’s quote and the cited source before relying on one.

Statistics and arithmetic are recomputed, not judged.

Confidence bands are shown only for fields calibrated on our annotated test set. None is calibrated yet, so no band is shown.

What counts as a claim ›How we measure confidence ›How we check this ›

Are you an author, or do you see a problem with this page? Request a review