Cited by 25Mesenchymal stem cell researchRespiratory Support and MechanismsMitochondrial Function and Pathology

The DOI matches its Crossref record; 6 of the 6 references it cites were found in a registry or an index.

MSC-mediated mitochondrial transfer promotes metabolic reprograming in endothelial cells and vascular regeneration in ARDS

Open access

Abstract

Background Mesenchymal stem cells (MSCs) are a potential therapy for acute respiratory distress syndrome (ARDS), but their mechanisms in repairing mitochondrial damage in ARDS endothelial cells remain unclear.Methods We first examined MSCs’ mitochondrial transfer ability and mechanisms to mouse pulmonary microvascular endothelial cells (MPMECs) in ARDS. Then, we investigated how MSC-mediated mitochondrial transfer affects the repair of endothelial damage. Finally, we elucidated the mechanisms by which MSC-mediated mitochondrial transfer promotes vascular regeneration.Results Compared to mitochondrial-damaged MSCs, normal MSCs showed a significantly higher mitochondrial transfer rate to MPMECs, with increases of 41.68% in vitro (P < 0.0001) and 10.50% in vivo (P = 0.0005). Furthermore, MSC-mediated mitochondrial transfer significantly reduced reactive oxygen species (P < 0.05) and promoted proliferation (P < 0.0001) in MPMECs. Finally, MSC-mediated mitochondrial transfer significantly increased the activity of the tricarboxylic acid (TCA) cycle (MD of CS mRNA: 23.76, P = 0.032), and further enhanced fatty acid synthesis (MD of FAS mRNA: 6.67, P = 0.0001), leading to a 6.7-fold increase in vascular endothelial growth factor release from MPMECs and promoted vascular regeneration in ARDS.Conclusion MSC-mediated mitochondrial transfer to MPMECs activates the TCA cycle and fatty acid synthesis, promoting endothelial proliferation and pro-angiogenic factor release, thereby enhancing vascular regeneration in ARDS.

Overview

The claims and statistics of this paper haven’t been checked yet.

Run the check — free, no account needed. It reads the open-access text and checks the sources it cites.

A few free checks a day · papers already verified open instantly · results are public

Integrity signals

Registry

Crossref · 10.1080/13510002.2025.2474897

Cites

6 of 6 references verified0 citation errors · 0 not checkable

Statistics

Figures

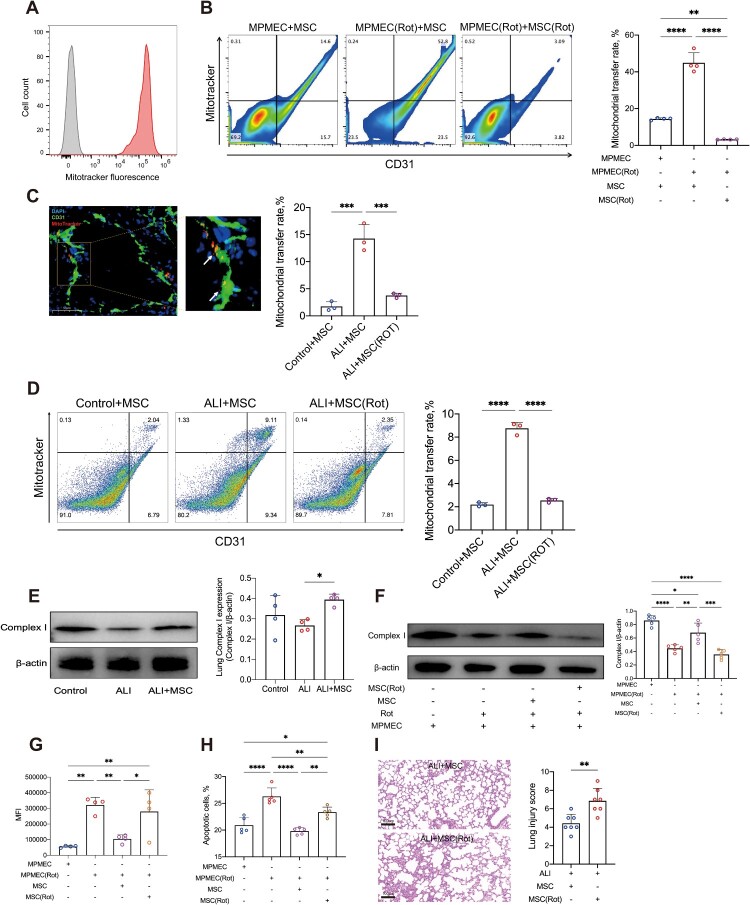
Figure 1. MSCs Mitigate Endothelial Injury in ARDS through Mitochondrial Transfer. (A) Representative flow cytometry histogram showing mitoTracker labeled mitochondrial transfer from MSCs to MPMECs (N = 3). Gray histogram, negative control. (B) Representative flow cytometry images and quantitative analysis of MSC-derived mitochondrial transfer to MPMECs (N = 4). CD31, marker for MPMECs; mitoTracker, marker for MSC-derived mitochondria. (C) Representative immunofluorescence images and HALO quantitative analysis of mouse lung tissue showing MSC-derived mitochondrial transfer to MPMECs (N = 3). Green signal, CD31-positive MPMECs; red signal, mitochondria derived from MSCs; blue signal, nuclei; scale bar, 50 μm. (D) Representative flow cytometry images and quantitative analysis of single-cell suspension from mouse lung tissue showing MSC-derived mitochondrial transfer to MPMECs (N = 3). CD31, marker for MPMECs; mitoTracker, marker for MSC-derived mitochondria. (E) Representative Western Blot images and quantitative analysis of mitochondrial complex I expression in ARDS mouse lung tissue under different conditions (N = 4). (F) Representative Western Blot images and quantitative analysis of mitochondrial complex I expression in MPMECs treated with different conditions (N = 5). (G) Flow cytometry analysis of average ROS fluorescence intensity in MPMECs treated with different conditions (N = 4). (H) Flow cytometry analysis of apoptosis rate in MPMECs treated with different conditions (N = 5). (I) Representative H&E staining images and quantitative analysis using lung injury score of lung tissues from ARDS mouse treated with MSCs or rotenone-treated MSCs (N = 7); scale bar, 100 μm. *p < 0.05, **p < 0.01, ***p < 0.001, ****p < 0.0001. Each dot represents an independent experiment. Error bars indicate mean ± SD.
Figure 1. MSCs Mitigate Endothelial Injury in ARDS through Mitochondrial Transfer. (A) Representative flow cytometry histogram showing mitoTracker labeled mitochondrial transfer from MSCs to MPMECs (N = 3). Gray histogram, negative control. (B) Representative flow cytometry images and quantitative analysis of MSC-derived mitochondrial transfer to MPMECs (N = 4). CD31, marker for MPMECs; mitoTracker, marker for MSC-derived mitochondria. (C) Representative immunofluorescence images and HALO quantitative analysis of mouse lung tissue showing MSC-derived mitochondrial transfer to MPMECs (N = 3). Green signal, CD31-positive MPMECs; red signal, mitochondria derived from MSCs; blue signal, nuclei; scale bar, 50 μm. (D) Representative flow cytometry images and quantitative analysis of single-cell suspension from mouse lung tissue showing MSC-derived mitochondrial transfer to MPMECs (N = 3). CD31, marker for MPMECs; mitoTracker, marker for MSC-derived mitochondria. (E) Representative Western Blot images and quantitative analysis of mitochondrial complex I expression in ARDS mouse lung tissue under different conditions (N = 4). (F) Representative Western Blot images and quantitative analysis of mitochondrial complex I expression in MPMECs treated with different conditions (N = 5). (G) Flow cytometry analysis of average ROS fluorescence intensity in MPMECs treated with different conditions (N = 4). (H) Flow cytometry analysis of apoptosis rate in MPMECs treated with different conditions (N = 5). (I) Representative H&E staining images and quantitative analysis using lung injury score of lung tissues from ARDS mouse treated with MSCs or rotenone-treated MSCs (N = 7); scale bar, 100 μm. *p < 0.05, **p < 0.01, ***p < 0.001, ****p < 0.0001. Each dot represents an independent experiment. Error bars indicate mean ± SD.CC BY-NC · PubMed Central
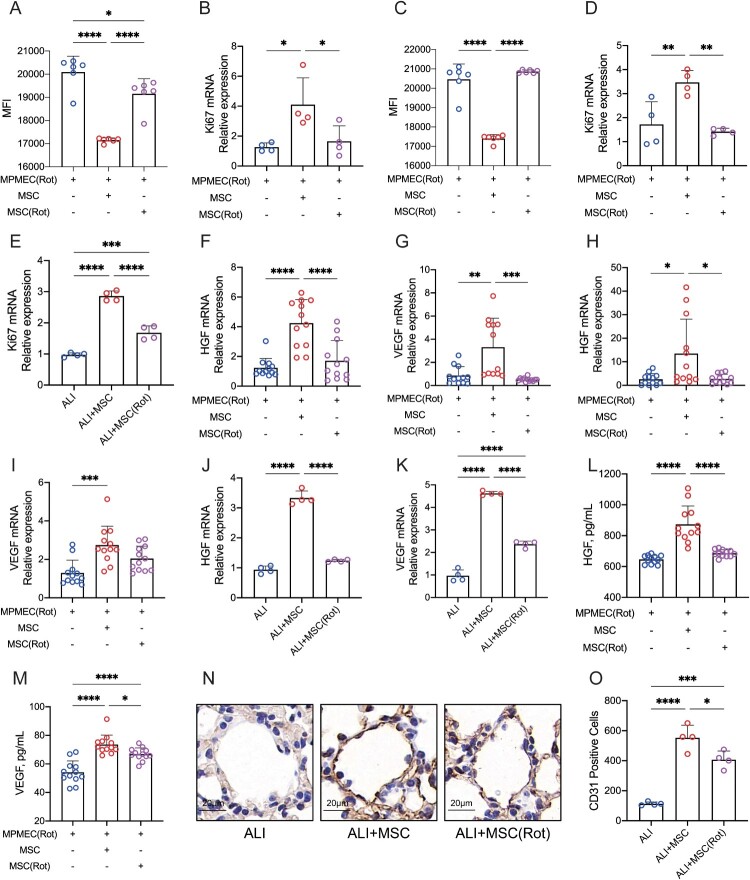
Figure 2. MSCs Promote Endothelial Cell Proliferation and Vascular Regeneration in ARDS through Mitochondrial Transfer. (A) Quantitative flow cytometry analysis of CFSE mean fluorescence intensity in mitochondrial damaged MPMECs, or co-cultured with MSCs under different conditions (N = 5). (B) Relative expression of cell proliferation marker Ki67 mRNA in mitochondrial damaged MPMECs, or co-cultured with MSCs under different conditions (N = 5). (C) Quantitative flow cytometry analysis of CFSE mean fluorescence intensity in mitochondrial damaged MPMECs, or cultured with MSCs in Transwell chambers for isolation under different conditions (N = 5). (D) Relative expression of Ki67 mRNA in mitochondrial damaged MPMECs, or cultured with MSCs in Transwell chambers for isolation under different conditions (N = 4). (E) Relative expression of Ki67 mRNA in ARDS mouse lung tissue under different conditions (N = 4). (F-G) Relative expression of HGF mRNA (F) and VEGF mRNA (G) in mitochondrial damaged MPMECs, or co-cultured with MSCs under different conditions (N = 12). (H-I) Relative expression of HGF mRNA (H) and VEGF mRNA (I) in mitochondrial damaged MPMECs, or cultured with MSCs in Transwell chambers for isolation under different conditions (N = 12). (J-K) Relative expression of HGF mRNA (J) and VEGF mRNA (K) in ARDS mouse lung tissue under different conditions (N = 4). (L-M) ELISA quantitative analysis of HGF (L) and VEGF (M) in cell culture supernatants of mitochondrial damaged MPMECs, or co-cultured with MSCs under different conditions (N = 12). (N-O) Representative immunohistochemical images (N) and HALO quantitative analysis (O) of lung vasculature in ARDS mice under different conditions (N = 4). Brown signal, endothelial cells; blue signal, nuclei; scale bar, 20 μm. *p < 0.05, **p < 0.01, ***p < 0.001, ****p < 0.0001. Each dot represents an independent experiment. Error bars indicate mean ± SD.
Figure 2. MSCs Promote Endothelial Cell Proliferation and Vascular Regeneration in ARDS through Mitochondrial Transfer. (A) Quantitative flow cytometry analysis of CFSE mean fluorescence intensity in mitochondrial damaged MPMECs, or co-cultured with MSCs under different conditions (N = 5). (B) Relative expression of cell proliferation marker Ki67 mRNA in mitochondrial damaged MPMECs, or co-cultured with MSCs under different conditions (N = 5). (C) Quantitative flow cytometry analysis of CFSE mean fluorescence intensity in mitochondrial damaged MPMECs, or cultured with MSCs in Transwell chambers for isolation under different conditions (N = 5). (D) Relative expression of Ki67 mRNA in mitochondrial damaged MPMECs, or cultured with MSCs in Transwell chambers for isolation under different conditions (N = 4). (E) Relative expression of Ki67 mRNA in ARDS mouse lung tissue under different conditions (N = 4). (F-G) Relative expression of HGF mRNA (F) and VEGF mRNA (G) in mitochondrial damaged MPMECs, or co-cultured with MSCs under different conditions (N = 12). (H-I) Relative expression of HGF mRNA (H) and VEGF mRNA (I) in mitochondrial damaged MPMECs, or cultured with MSCs in Transwell chambers for isolation under different conditions (N = 12). (J-K) Relative expression of HGF mRNA (J) and VEGF mRNA (K) in ARDS mouse lung tissue under different conditions (N = 4). (L-M) ELISA quantitative analysis of HGF (L) and VEGF (M) in cell culture supernatants of mitochondrial damaged MPMECs, or co-cultured with MSCs under different conditions (N = 12). (N-O) Representative immunohistochemical images (N) and HALO quantitative analysis (O) of lung vasculature in ARDS mice under different conditions (N = 4). Brown signal, endothelial cells; blue signal, nuclei; scale bar, 20 μm. *p < 0.05, **p < 0.01, ***p < 0.001, ****p < 0.0001. Each dot represents an independent experiment. Error bars indicate mean ± SD.CC BY-NC · PubMed Central
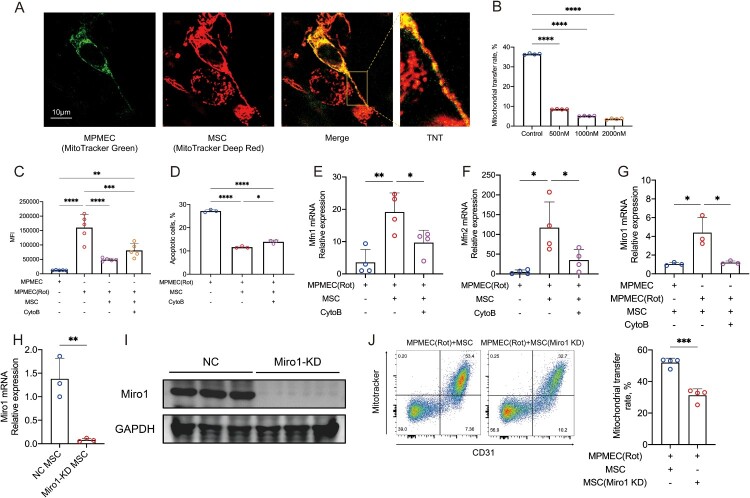
Figure 3. MSCs Transfer Mitochondria to MPMECs via TNTs. (A) Representative confocal microscopy image showing mitochondrial transfer from MSCs to MPMECs via TNTs (N = 3). Red signal, MSCs; green signal, MPMECs; enlarged section, TNT; scale bar, 10 μm. (B) Flow cytometry quantification of mitochondrial transfer rate from MSCs to MPMECs in co-culture systems with different concentrations of Cytochalasin B (N = 4). (C) Quantitative flow cytometry analysis of ROS in MPMECs treated with different conditions (N = 5). (D) Quantitative flow cytometry analysis of apoptosis in mitochondrial damaged MPMECs, or co-cultured with MSCs under different conditions (N = 3). (E-F) Relative expression of Mfn1 mRNA (E) and Mfn2 mRNA (F) in mitochondrial damaged MPMECs, or co-cultured with MSCs under different conditions (N = 4). (G) Relative expression of Miro1 mRNA in MSCs co-cultured with MPMECs under different conditions (N = 3). (H-I) Relative expression of Miro1 mRNA (H) and Miro1 protein (I) in negative control MSCs and Miro1 knockdown MSCs (N = 3). (J) Representative flow cytometry images and quantitative analysis of mitochondrial transfer rate from negative control MSCs or Miro1 knockdown MSCs to mitochondrial damaged MPMECs (N = 4). CD31, marker for MPMECs; mitoTracker, marker for MSC-derived mitochondria. *p < 0.05, **p < 0.01, ***p < 0.001, ****p < 0.0001. Each dot represents an independent experiment. Error bars indicate mean ± SD.
Figure 3. MSCs Transfer Mitochondria to MPMECs via TNTs. (A) Representative confocal microscopy image showing mitochondrial transfer from MSCs to MPMECs via TNTs (N = 3). Red signal, MSCs; green signal, MPMECs; enlarged section, TNT; scale bar, 10 μm. (B) Flow cytometry quantification of mitochondrial transfer rate from MSCs to MPMECs in co-culture systems with different concentrations of Cytochalasin B (N = 4). (C) Quantitative flow cytometry analysis of ROS in MPMECs treated with different conditions (N = 5). (D) Quantitative flow cytometry analysis of apoptosis in mitochondrial damaged MPMECs, or co-cultured with MSCs under different conditions (N = 3). (E-F) Relative expression of Mfn1 mRNA (E) and Mfn2 mRNA (F) in mitochondrial damaged MPMECs, or co-cultured with MSCs under different conditions (N = 4). (G) Relative expression of Miro1 mRNA in MSCs co-cultured with MPMECs under different conditions (N = 3). (H-I) Relative expression of Miro1 mRNA (H) and Miro1 protein (I) in negative control MSCs and Miro1 knockdown MSCs (N = 3). (J) Representative flow cytometry images and quantitative analysis of mitochondrial transfer rate from negative control MSCs or Miro1 knockdown MSCs to mitochondrial damaged MPMECs (N = 4). CD31, marker for MPMECs; mitoTracker, marker for MSC-derived mitochondria. *p < 0.05, **p < 0.01, ***p < 0.001, ****p < 0.0001. Each dot represents an independent experiment. Error bars indicate mean ± SD.CC BY-NC · PubMed Central
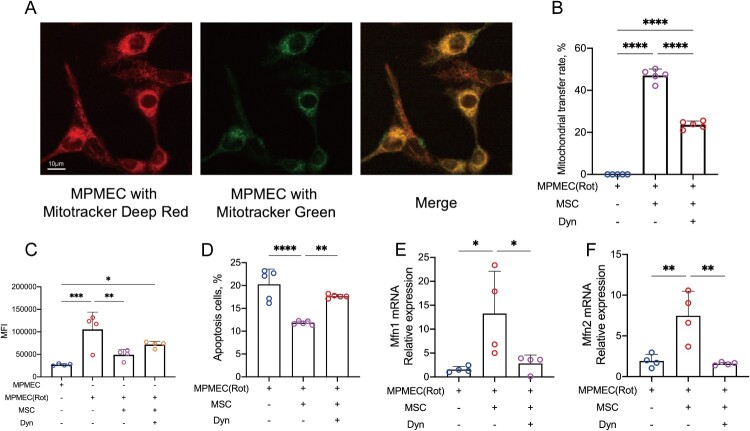
Figure 4. MPMECs Accept Mitochondria from MSCs through Dynamin-Dependent Clathrin-Mediated Endocytosis. (A) Representative fluorescence microscopy image showing mitochondrial transfer from MSCs to mitochondrial damaged MPMECs cultured in Transwell chambers for isolation (N = 3). Red signal, mitochondria of MPMECs; green signal, mitochondria from MSCs; scale bar, 10 μm. (B) Flow cytometry quantification of mitochondrial transfer rate from MSCs to mitochondrial damaged MPMECs cultured in Transwell chambers for isolation under different conditions (N = 5). (C) Quantitative flow cytometry analysis of ROS in MPMECs, or cultured with MSCs in Transwell chambers for isolation under different conditions (N = 4). (D) Quantitative flow cytometry analysis of apoptosis in mitochondrial damaged MPMECs, or cultured with MSCs in Transwell chambers for isolation under different conditions (N = 5). (E-F) Relative expression of Mfn1 mRNA (E) and Mfn2 mRNA (F) in mitochondrial damaged MPMECs, or cultured with MSCs in Transwell chambers for isolation under different conditions (N = 4). *p < 0.05, **p < 0.01, ***p < 0.001, ****p < 0.0001. Each dot represents an independent experiment. Error bars indicate mean ± SD.
Figure 4. MPMECs Accept Mitochondria from MSCs through Dynamin-Dependent Clathrin-Mediated Endocytosis. (A) Representative fluorescence microscopy image showing mitochondrial transfer from MSCs to mitochondrial damaged MPMECs cultured in Transwell chambers for isolation (N = 3). Red signal, mitochondria of MPMECs; green signal, mitochondria from MSCs; scale bar, 10 μm. (B) Flow cytometry quantification of mitochondrial transfer rate from MSCs to mitochondrial damaged MPMECs cultured in Transwell chambers for isolation under different conditions (N = 5). (C) Quantitative flow cytometry analysis of ROS in MPMECs, or cultured with MSCs in Transwell chambers for isolation under different conditions (N = 4). (D) Quantitative flow cytometry analysis of apoptosis in mitochondrial damaged MPMECs, or cultured with MSCs in Transwell chambers for isolation under different conditions (N = 5). (E-F) Relative expression of Mfn1 mRNA (E) and Mfn2 mRNA (F) in mitochondrial damaged MPMECs, or cultured with MSCs in Transwell chambers for isolation under different conditions (N = 4). *p < 0.05, **p < 0.01, ***p < 0.001, ****p < 0.0001. Each dot represents an independent experiment. Error bars indicate mean ± SD.CC BY-NC · PubMed Central
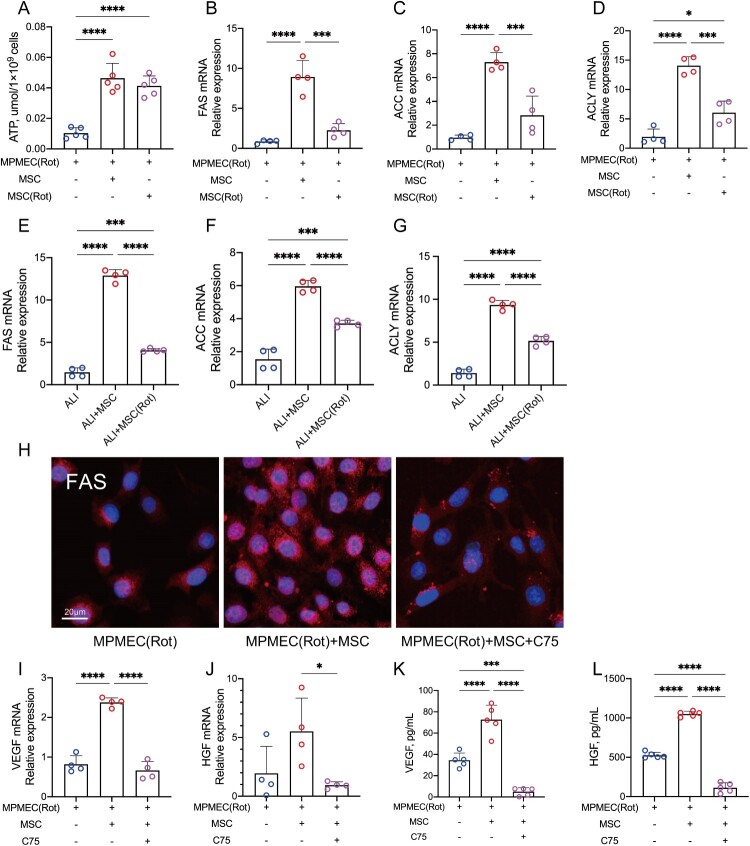
Figure 5. MSCs Transfer Mitochondria to MPMECs Promoting Fatty Acid Synthesis and Vascular Regeneration. (A) Quantitative analysis of ATP in mitochondrial damaged MPMECs, or co-cultured with MSCs under different conditions (N = 5). (B-D) Relative expression of key fatty acid synthesis enzyme FAS mRNA (B), ACC mRNA (C), ACLY mRNA (D) in mitochondrial damaged MPMECs, or co-cultured with MSCs under different conditions (N = 4). (E-G) Relative expression of key fatty acid synthesis enzyme FAS mRNA (E), ACC mRNA (F), ACLY mRNA (G) in lung tissues of ARDS mice, or treated with MSCs under different conditions (N = 4). (H) Representative immunofluorescence images of FAS in mitochondrial damaged MPMECs, or co-cultured with MSCs under different conditions (N = 3). Red signal, FAS; blue signal, nuclei; scale bar, 20 μm. (I-J) Relative expression of VEGF mRNA (I) and HGF mRNA (J) in mitochondrial damaged MPMECs, or co-cultured with MSCs under different conditions (N = 4). (K-L) ELISA quantitative analysis of VEGF (K) and HGF (L) in cell culture supernatants of mitochondrial damaged MPMECs, or co-cultured with MSCs under different conditions (N = 5). *p < 0.05, **p < 0.01, ***p < 0.001, ****p < 0.0001. Each dot represents an independent experiment. Error bars indicate mean ± SD.
Figure 5. MSCs Transfer Mitochondria to MPMECs Promoting Fatty Acid Synthesis and Vascular Regeneration. (A) Quantitative analysis of ATP in mitochondrial damaged MPMECs, or co-cultured with MSCs under different conditions (N = 5). (B-D) Relative expression of key fatty acid synthesis enzyme FAS mRNA (B), ACC mRNA (C), ACLY mRNA (D) in mitochondrial damaged MPMECs, or co-cultured with MSCs under different conditions (N = 4). (E-G) Relative expression of key fatty acid synthesis enzyme FAS mRNA (E), ACC mRNA (F), ACLY mRNA (G) in lung tissues of ARDS mice, or treated with MSCs under different conditions (N = 4). (H) Representative immunofluorescence images of FAS in mitochondrial damaged MPMECs, or co-cultured with MSCs under different conditions (N = 3). Red signal, FAS; blue signal, nuclei; scale bar, 20 μm. (I-J) Relative expression of VEGF mRNA (I) and HGF mRNA (J) in mitochondrial damaged MPMECs, or co-cultured with MSCs under different conditions (N = 4). (K-L) ELISA quantitative analysis of VEGF (K) and HGF (L) in cell culture supernatants of mitochondrial damaged MPMECs, or co-cultured with MSCs under different conditions (N = 5). *p < 0.05, **p < 0.01, ***p < 0.001, ****p < 0.0001. Each dot represents an independent experiment. Error bars indicate mean ± SD.CC BY-NC · PubMed Central
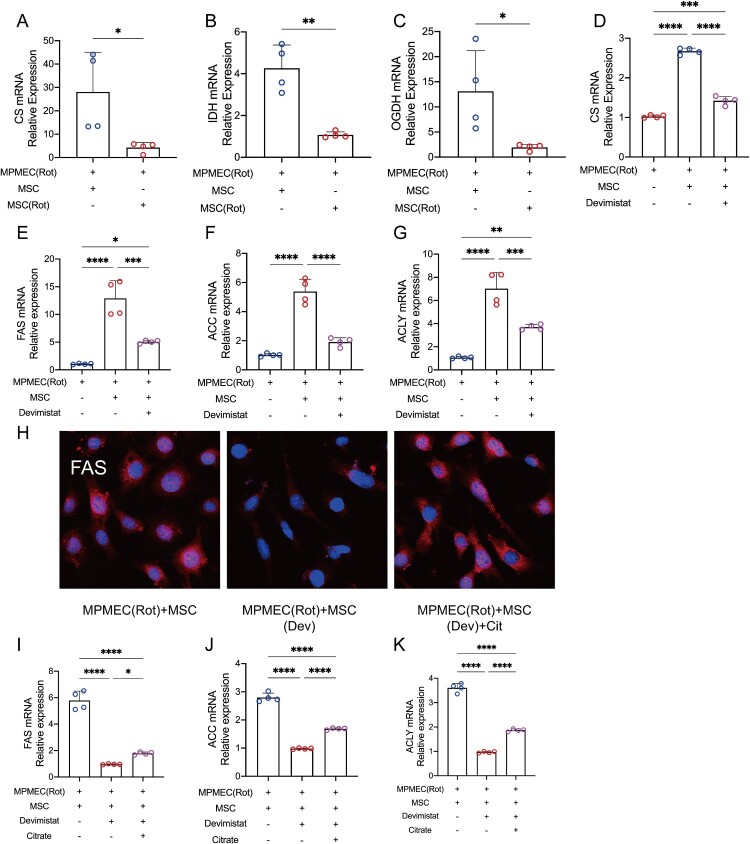
Figure 6. MSCs Transfer Mitochondria to MPMECs Stimulating the TCA Cycle and Activating Citrate-Dependent Fatty Acid Synthesis. (A-C) Relative expression of the key TCA cycle enzyme CS mRNA (A), IDH mRNA (B) and OGDH mRNA (C) in mitochondrial damaged MPMECs, or co-cultured with MSCs under different conditions (N = 4). (D) Relative expression of CS mRNA in mitochondrial damaged MPMECs, or co-cultured with MSCs with or without Devimistat (N = 4). (E-G) Relative expression of key fatty acid synthesis enzyme FAS mRNA (E), ACC mRNA (F) and ACLY mRNA (G) in mitochondrial damaged MPMECs, or co-cultured with MSCs with or without Devimistat (N = 4). (H) Representative immunofluorescence images of FAS in mitochondrial damaged MPMECs co-cultured with MSCs under different conditions (N = 3). Red signal, FAS; blue signal, nuclei. (I-K) Relative expression of key fatty acid synthesis enzyme FAS mRNA (I), ACC mRNA (J) and ACLY mRNA (K) in mitochondrial damaged MPMECs co-cultured with MSCs under different conditions (N = 4). *p < 0.05, **p < 0.01, ***p < 0.001, ****p < 0.0001. Each dot represents an independent experiment. Error bars indicate mean ± SD.
Figure 6. MSCs Transfer Mitochondria to MPMECs Stimulating the TCA Cycle and Activating Citrate-Dependent Fatty Acid Synthesis. (A-C) Relative expression of the key TCA cycle enzyme CS mRNA (A), IDH mRNA (B) and OGDH mRNA (C) in mitochondrial damaged MPMECs, or co-cultured with MSCs under different conditions (N = 4). (D) Relative expression of CS mRNA in mitochondrial damaged MPMECs, or co-cultured with MSCs with or without Devimistat (N = 4). (E-G) Relative expression of key fatty acid synthesis enzyme FAS mRNA (E), ACC mRNA (F) and ACLY mRNA (G) in mitochondrial damaged MPMECs, or co-cultured with MSCs with or without Devimistat (N = 4). (H) Representative immunofluorescence images of FAS in mitochondrial damaged MPMECs co-cultured with MSCs under different conditions (N = 3). Red signal, FAS; blue signal, nuclei. (I-K) Relative expression of key fatty acid synthesis enzyme FAS mRNA (I), ACC mRNA (J) and ACLY mRNA (K) in mitochondrial damaged MPMECs co-cultured with MSCs under different conditions (N = 4). *p < 0.05, **p < 0.01, ***p < 0.001, ****p < 0.0001. Each dot represents an independent experiment. Error bars indicate mean ± SD.CC BY-NC · PubMed Central
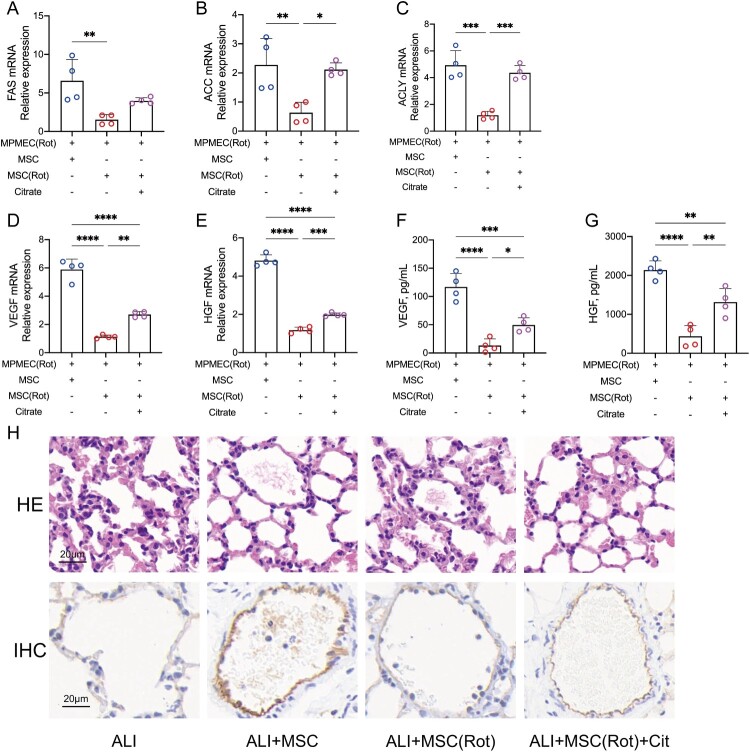
Figure 7. Citrate Restores the Vascular Regenerative Function of Mitochondrially Damaged MSCs. (A-C) Relative expression of key fatty acid synthesis enzyme FAS mRNA (A), ACC mRNA (B) and ACLY mRNA (C) in mitochondrial damaged MPMECs co-cultured with MSCs under different conditions (N = 4). (D-E) Relative expression of VEGF mRNA (D) and HGF mRNA (E) in mitochondrial damaged MPMECs co-cultured with MSCs under different conditions (N = 4). (F-G) ELISA quantitative analysis of VEGF (F) and HGF (G) in cell culture supernatants of mitochondrial damaged MPMECs co-cultured with MSCs under different conditions (N = 4). (H) Representative images of H&E staining (top row) and endothelial cell immunohistochemical analysis (bottom row) of lung tissue in ARDS mice, or treated with MSCs under different conditions (N = 3). The brown signal indicates endothelial cells; the blue signal indicates nuclei; scale bar, 20 μm. *p < 0.05, **p < 0.01, ***p < 0.001, ****p < 0.0001. Each dot represents an independent experiment. Error bars indicate mean ± SD.
Figure 7. Citrate Restores the Vascular Regenerative Function of Mitochondrially Damaged MSCs. (A-C) Relative expression of key fatty acid synthesis enzyme FAS mRNA (A), ACC mRNA (B) and ACLY mRNA (C) in mitochondrial damaged MPMECs co-cultured with MSCs under different conditions (N = 4). (D-E) Relative expression of VEGF mRNA (D) and HGF mRNA (E) in mitochondrial damaged MPMECs co-cultured with MSCs under different conditions (N = 4). (F-G) ELISA quantitative analysis of VEGF (F) and HGF (G) in cell culture supernatants of mitochondrial damaged MPMECs co-cultured with MSCs under different conditions (N = 4). (H) Representative images of H&E staining (top row) and endothelial cell immunohistochemical analysis (bottom row) of lung tissue in ARDS mice, or treated with MSCs under different conditions (N = 3). The brown signal indicates endothelial cells; the blue signal indicates nuclei; scale bar, 20 μm. *p < 0.05, **p < 0.01, ***p < 0.001, ****p < 0.0001. Each dot represents an independent experiment. Error bars indicate mean ± SD.CC BY-NC · PubMed Central
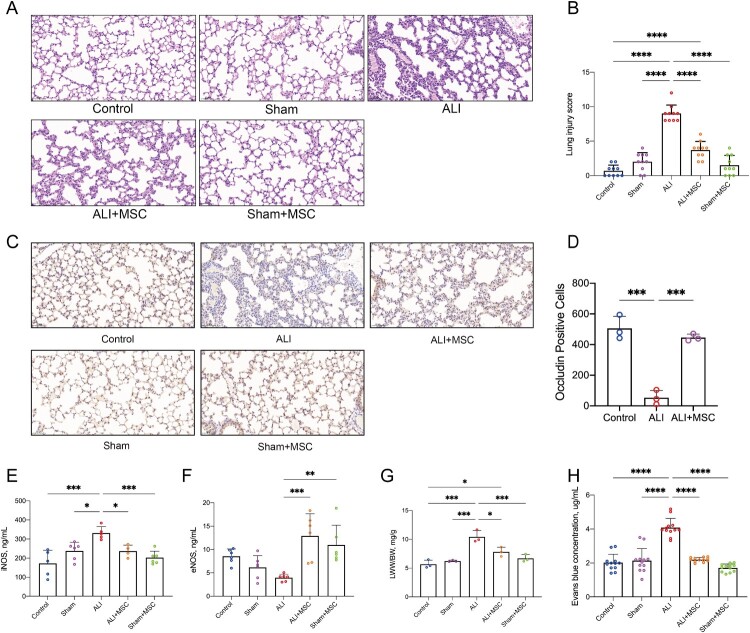
Figure 8. MSCs Alleviate LPS-Induced Lung Injury. (A–B) Representative H&E-stained images (A) and quantitative analysis of lung injury score (B) of lung tissues from normal mice, sham-operated, ARDS, ARDS treated with MSCs, and sham-operated mice treated with MSCs (N = 3). Scale bar, 50 μm. (C) Representative immunohistochemical images of endothelial cell adhesion protein Occludin in lung tissues from normal mice, sham-operated, ARDS, ARDS treated with MSCs, and sham-operated mice treated with MSCs (N = 3). Brown signal, Occludin-positive signal; blue signal, nuclei; scale bar, 50 μm. (D) HALO quantitative analysis of Occludin immunohistochemistry in lung tissues from normal mice, ARDS, and ARDS treated with MSCs (N = 3). (E-F) ELISA quantitative analysis of iNOS (E) and eNOS (F) expression in lung tissues from normal mice, sham-operated, ARDS, ARDS treated with MSCs, and sham-operated mice treated with MSCs. (G) The LWW/BW ratio from normal mice, sham-operated, ARDS, ARDS treated with MSCs, and sham-operated mice treated with MSCs (N = 3). (H) Evans blue content in lung tissues from normal mice, sham-operated, ARDS, ARDS treated with MSCs, and sham-operated mice treated with MSCs. *p < 0.05, **p < 0.01, ***p < 0.001, ****p < 0.0001. Each dot represents an independent experiment. Error bars indicate mean ± SD.
Figure 8. MSCs Alleviate LPS-Induced Lung Injury. (A–B) Representative H&E-stained images (A) and quantitative analysis of lung injury score (B) of lung tissues from normal mice, sham-operated, ARDS, ARDS treated with MSCs, and sham-operated mice treated with MSCs (N = 3). Scale bar, 50 μm. (C) Representative immunohistochemical images of endothelial cell adhesion protein Occludin in lung tissues from normal mice, sham-operated, ARDS, ARDS treated with MSCs, and sham-operated mice treated with MSCs (N = 3). Brown signal, Occludin-positive signal; blue signal, nuclei; scale bar, 50 μm. (D) HALO quantitative analysis of Occludin immunohistochemistry in lung tissues from normal mice, ARDS, and ARDS treated with MSCs (N = 3). (E-F) ELISA quantitative analysis of iNOS (E) and eNOS (F) expression in lung tissues from normal mice, sham-operated, ARDS, ARDS treated with MSCs, and sham-operated mice treated with MSCs. (G) The LWW/BW ratio from normal mice, sham-operated, ARDS, ARDS treated with MSCs, and sham-operated mice treated with MSCs (N = 3). (H) Evans blue content in lung tissues from normal mice, sham-operated, ARDS, ARDS treated with MSCs, and sham-operated mice treated with MSCs. *p < 0.05, **p < 0.01, ***p < 0.001, ****p < 0.0001. Each dot represents an independent experiment. Error bars indicate mean ± SD.CC BY-NC · PubMed Central

Verification

Claims the paper makes

The claims and statistics of this paper haven’t been checked yet.

Run the check — free, no account needed. It reads the open-access text and checks the sources it cites.

A few free checks a day · papers already verified open instantly · results are public

Claims other papers make about this one

Each is checked against this paper’s own text: does it say what the citing paper says it does?

Self-check

Percentages, sums and reported differences re-computed from the paper’s own numbers.

The self-check needs the paper’s full text.

Citations

Cites

Research works printed but not linked: 41

  1. 10.1038/s41572-019-0069-0 · DOI
  2. 10.1001/jama.2016.0291 · DOI · Paper page
  3. 10.21037/jtd.2018.08.137 · DOI
  4. 10.1007/s00134-023-07050-7 · DOI
  5. 10.1186/s13287-023-03277-9 · DOI
  6. 10.3389/fimmu.2022.871828 · DOI
  7. 10.1136/thoraxjnl-2021-217928 · DOI
  8. 10.3389/fimmu.2021.738697 · DOI
  9. 10.3390/cells10102588 · DOI
  10. 10.1016/j.lfs.2021.119876 · DOI
  11. 10.1016/S0140-6736(21)00439-6 · DOI
  12. 10.1152/ajpheart.00166.2021 · DOI
  13. 10.1097/BCR.0000000000000501 · DOI
  14. 10.1016/j.resp.2010.08.013 · DOI
  15. 10.1073/pnas.0510511103 · DOI
  16. 10.1016/j.cmet.2014.12.003 · DOI · Paper page
  17. 10.1038/s41586-023-06537-z · DOI
  18. 10.1183/13993003.02978-2020 · DOI
  19. 10.1136/thoraxjnl-2021-218194 · DOI
  20. 10.1164/rccm.201701-0170OC · DOI · Paper page
  21. 10.1186/s13287-022-03219-x · DOI
  22. 10.1038/s41467-022-28338-0 · DOI
  23. 10.3389/fimmu.2021.759176 · DOI
  24. 10.3389/fimmu.2022.973089 · DOI
  25. 10.1038/s41392-022-01134-4 · DOI · Paper page
  26. 10.1002/JLB.3MR0321-545RR · DOI
  27. 10.1016/j.intimp.2021.107694 · DOI
  28. 10.1016/j.ceb.2021.03.003 · DOI
  29. 10.3389/fcell.2022.915117 · DOI
  30. Ahmad T, Mukherjee S, Pattnaik B, et al. Miro1 regulates intercellular mitochondrial transport & enhances mesenchymal stem cell rescue efficacy. Embo J. 2014;33 (9):994–1010.
  31. 10.3389/fcvm.2021.771298 · DOI
  32. 10.1038/s41586-020-2589-x · DOI · Paper page
  33. Wick KD, Ware LB, Matthay MA. Acute respiratory distress syndrome. BMJ (Clinical Research ed). 2024;387:e076612.
  34. 10.3892/etm.2022.11406 · DOI
  35. 10.1186/s13287-019-1488-2 · DOI · Paper page
  36. 10.1159/000438545 · DOI
  37. 10.1016/j.cmet.2018.07.016 · DOI
  38. 10.1016/j.cmet.2020.12.006 · DOI
  39. 10.1016/j.ejphar.2018.05.003 · DOI
  40. 10.3390/ijms222313057 · DOI
  41. 10.1038/s41467-019-13668-3 · DOI · Paper page

Cited by

Sorted by citations

See all 25

Metadata

Authors
Wang, J., Meng, S., Chen, Y., Wang, H., Hu, W., Liu, S., Huang, L., Xu, J., Li, Q., Wu, X., Huang, W., & Huang, Y.
Affiliations
Zhongda Hospital Southeast University (CN)
Corresponding author
Huang, Yingzi
Venue
Redox Report
Published
2025-03-13
Volume
30
Issue
1
Pages
2474897-2474897
ISSN
  • 1351-0002 (ISSN-L)
  • 1743-2928
OpenAlex
W4408464831
Cited by
25
References
6
Citations by year
2026: 14 · 2025: 11
FWCI
16.16
Type
journal article
Language
en
Open access
Locations
  • Redox Report (publishedVersion, cc-by-nc)
  • Europe PMC (PubMed Central) (publishedVersion, cc-by-nc)
  • PubMed Central (publishedVersion, cc-by-nc)
  • PubMed (publishedVersion)
  • DOAJ (DOAJ: Directory of Open Access Journals) (submittedVersion, cc-by-sa)
Funders
  • National Key R&D Program of China (2022YFC2304600)
  • National Natural Science Foundation of China (82272235, 82102300, 82272211, 82302470)
  • Science Foundation of the Commission of Health of Jiangsu Province (ZDB2020009)
  • Jiangsu Province Key research and development Program (Social Development) Special Project (BE2021734)
  • China Postdoctoral Science Foundation (2022M710685)
  • Special fund project for health science and technology development of Nanjing Municipal Health Commission (YKK21265)
Topics
  • Life Sciences › Biochemistry, Genetics and Molecular Biology › Cell Biology › Mesenchymal stem cell research
  • Health Sciences › Medicine › Pulmonary and Respiratory Medicine › Respiratory Support and Mechanisms
  • Life Sciences › Biochemistry, Genetics and Molecular Biology › Molecular Biology › Mitochondrial Function and Pathology
Keywords
mesenchymal stem cells, mitochondrial transfer, acute respiratory distress syndrome, endothelial cells, vascular regeneration, metabolic reprogramming, TCA cycle, fatty acid synthesis, reactive oxygen species, endothelial cell proliferation, vascular endothelial growth factor, angiogenesis, mitochondrial damage
MeSH terms
Animals, Cells, Cultured, Humans, Male, Mice, Inbred C57BL, Mitochondria, Regeneration, Respiratory Distress Syndrome, Reactive Oxygen Species, Endothelial Cells, Cell Proliferation, Mice, Mesenchymal Stem Cells

About these checks

Registry, retraction, Cites and statistics results are computed, not judged, with one exception: a printed reference that no index lists is read once by a model before it counts as a citation error. Claims are extracted by a model and kept only when their quote appears verbatim in the text; each cited source is then checked, with a model’s help, for whether it says what the claim relies on. Those verdicts can be wrong — read the claim’s quote and the cited source before relying on one.

Statistics and arithmetic are recomputed, not judged.

Confidence bands are shown only for fields calibrated on our annotated test set. None is calibrated yet, so no band is shown.

What counts as a claim ›How we measure confidence ›How we check this ›

Are you an author, or do you see a problem with this page? Request a review