Cited by 148

The DOI matches its Crossref record; 5 of the 5 references it cites were found in a registry or an index.

A rapid and high content assay that measures cyto-ID-stained autophagic compartments and estimates autophagy flux with potential clinical applications

Guo, Sujuan, Liang, Yanping, Murphy, Susan F, Huang, Angela, Shen, Haihong, Kelly, Deborah F, Sobrado, Pablo, Sheng, Zhi·2015·Autophagy

Overview

The claims and statistics of this paper haven’t been checked yet.

Run the check — free, no account needed. It reads the open-access text and checks the sources it cites.

A few free checks a day · papers already verified open instantly · results are public

Integrity signals

Registry

Crossref · 10.1080/15548627.2015.1017181

Cites

5 of 5 references verified0 citation errors · 0 not checkable

Statistics

Figures

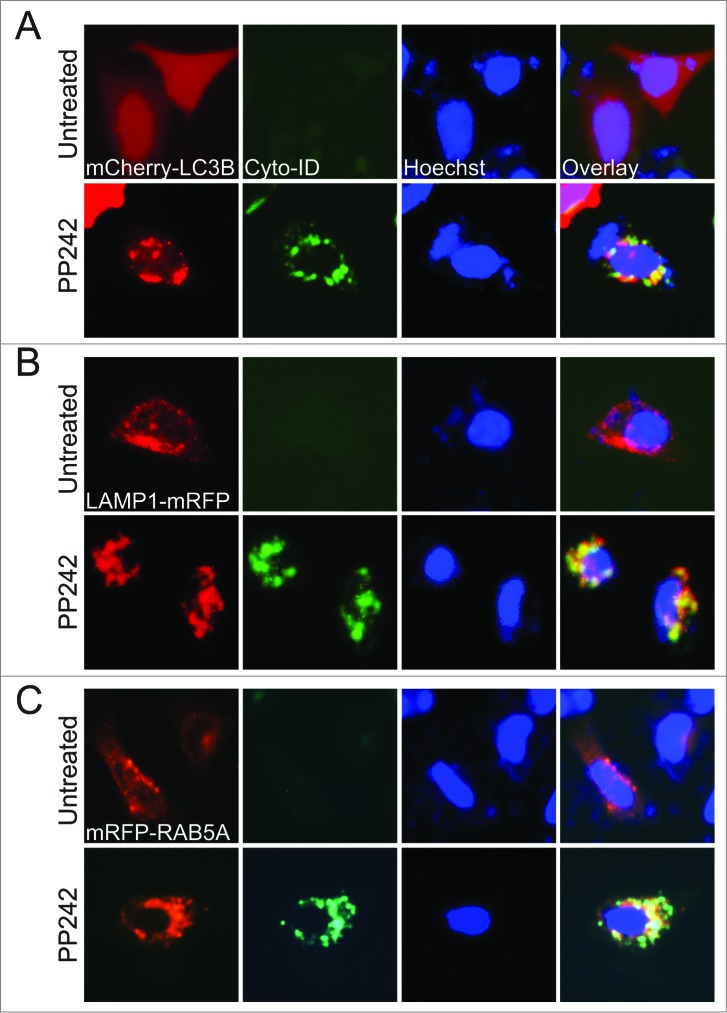
Figure 1. The Cyto-ID dye specifically labeled autophagic compartments with minimal staining of lysosomes and endosomes. Colocalization of the Cyto-ID fluorescence dye, Hoechst 33342, and mCherry-LC3B (A), LAMP1-mRFP (B), or mRFP-RAB5A (C) in HeLa cells treated without or with 10 μM PP242 for 4 h.
Figure 1. The Cyto-ID dye specifically labeled autophagic compartments with minimal staining of lysosomes and endosomes. Colocalization of the Cyto-ID fluorescence dye, Hoechst 33342, and mCherry-LC3B (A), LAMP1-mRFP (B), or mRFP-RAB5A (C) in HeLa cells treated without or with 10 μM PP242 for 4 h.CC BY-NC · PubMed Central
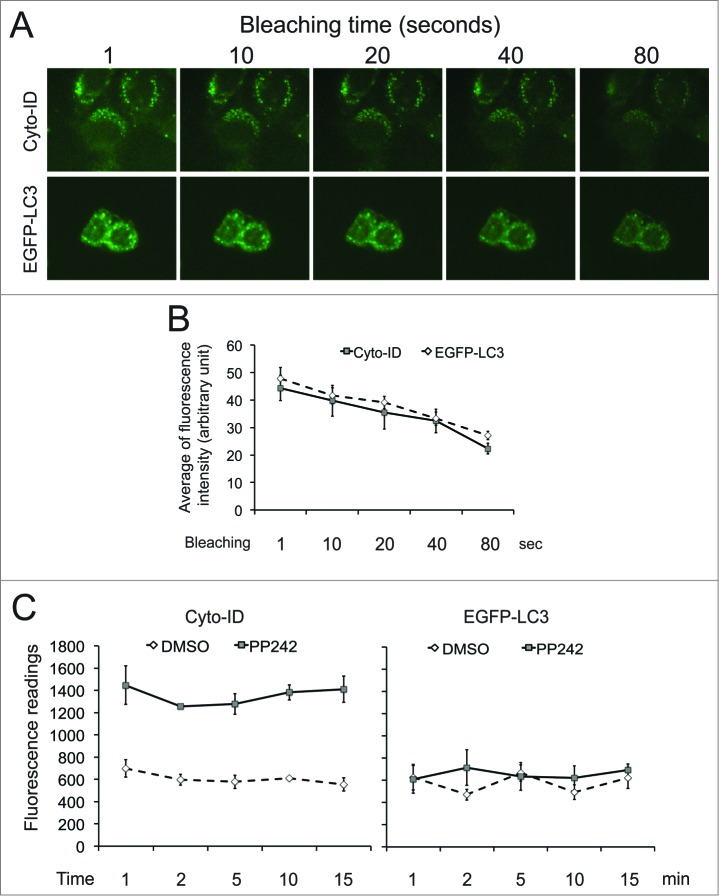
Figure 2. The Cyto-ID dye but not EGFP-LC3 was suitable for spectrophotometry. (A) Light sensitivity of the Cyto-ID dye or EGFP-LC3. HeLa cells transfected with or without EGFP-LC3 were treated with 10 μM PP242 for 4 h. HeLa cells with no EGFP-LC3 were further stained with the Cyto-ID. Images at the same field were taken at different time points (1 to 80 sec) after exposing cells to the light. (B) Quantification of fluorescent dots in images presented in A. The average intensities were obtained from 5 fluorescent dots and the error bars depicts means ± s.d. (C) Fluorescence intensities of the Cyto-ID or EGFP-LC3 recorded by a spectrophotometer at various time points.
Figure 2. The Cyto-ID dye but not EGFP-LC3 was suitable for spectrophotometry. (A) Light sensitivity of the Cyto-ID dye or EGFP-LC3. HeLa cells transfected with or without EGFP-LC3 were treated with 10 μM PP242 for 4 h. HeLa cells with no EGFP-LC3 were further stained with the Cyto-ID. Images at the same field were taken at different time points (1 to 80 sec) after exposing cells to the light. (B) Quantification of fluorescent dots in images presented in A. The average intensities were obtained from 5 fluorescent dots and the error bars depicts means ± s.d. (C) Fluorescence intensities of the Cyto-ID or EGFP-LC3 recorded by a spectrophotometer at various time points.CC BY-NC · PubMed Central
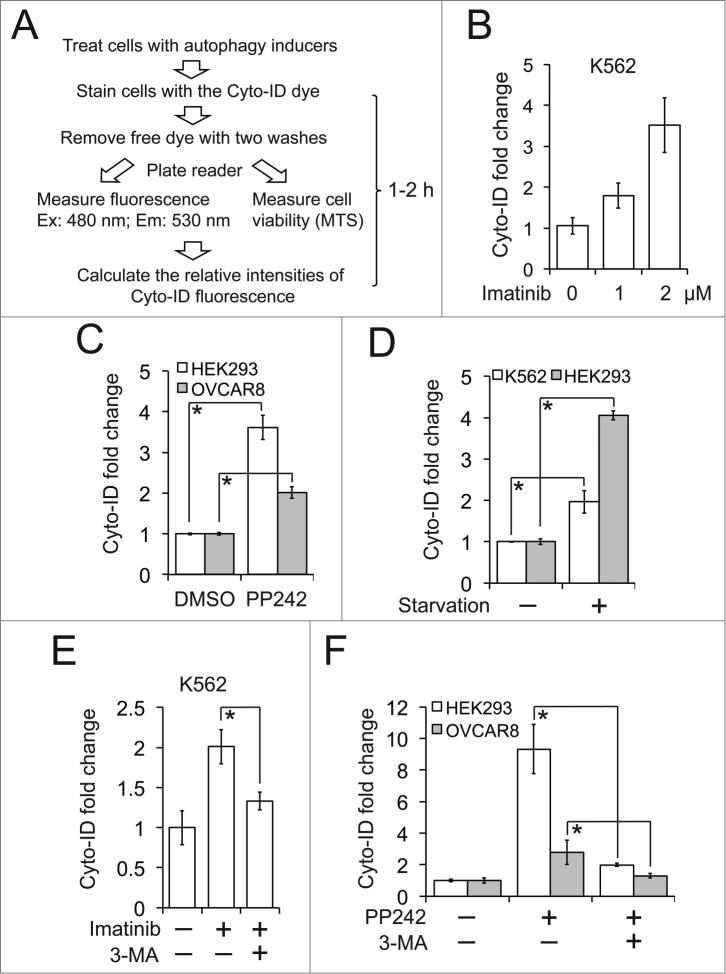
Figure 3. The Cyto-ID assay quantitatively measured the size of autophagic compartments. (A) A schematic outline of the Cyto-ID-based fluorescence spectrophotometric assay. (B) Imatinib-induced autophagy. K562 cells were treated with 1 or 2 μM imatinib for 16 h. (C) PP242-induced autophagy. HEK293 and OVCAR8 cells were treated with PP242 at 2 or 5 μM overnight, respectively. (D) Starvation-induced autophagy. K562 or HEK293 cells were incubated in Earle's Balanced Salt Solution for 30 min or 12 h, respectively. (E) Imatinib-induced autophagy affected by 3-MA. K562 cells were treated with 2 μM imatinib in the absence or presence of 10 mM 3-MA for 4 h. (F) PP242-induced autophagy affected by 3-MA. HEK293 or OVCAR8 cells were treated with 4 or 10 μM PP242, respectively, in the absence or presence of 10 mM 3-MA for 4 h. All experiments were repeated 3 times and error bars depict means ± s.d.; * P < 0.05.
Figure 3. The Cyto-ID assay quantitatively measured the size of autophagic compartments. (A) A schematic outline of the Cyto-ID-based fluorescence spectrophotometric assay. (B) Imatinib-induced autophagy. K562 cells were treated with 1 or 2 μM imatinib for 16 h. (C) PP242-induced autophagy. HEK293 and OVCAR8 cells were treated with PP242 at 2 or 5 μM overnight, respectively. (D) Starvation-induced autophagy. K562 or HEK293 cells were incubated in Earle's Balanced Salt Solution for 30 min or 12 h, respectively. (E) Imatinib-induced autophagy affected by 3-MA. K562 cells were treated with 2 μM imatinib in the absence or presence of 10 mM 3-MA for 4 h. (F) PP242-induced autophagy affected by 3-MA. HEK293 or OVCAR8 cells were treated with 4 or 10 μM PP242, respectively, in the absence or presence of 10 mM 3-MA for 4 h. All experiments were repeated 3 times and error bars depict means ± s.d.; * P < 0.05.CC BY-NC · PubMed Central
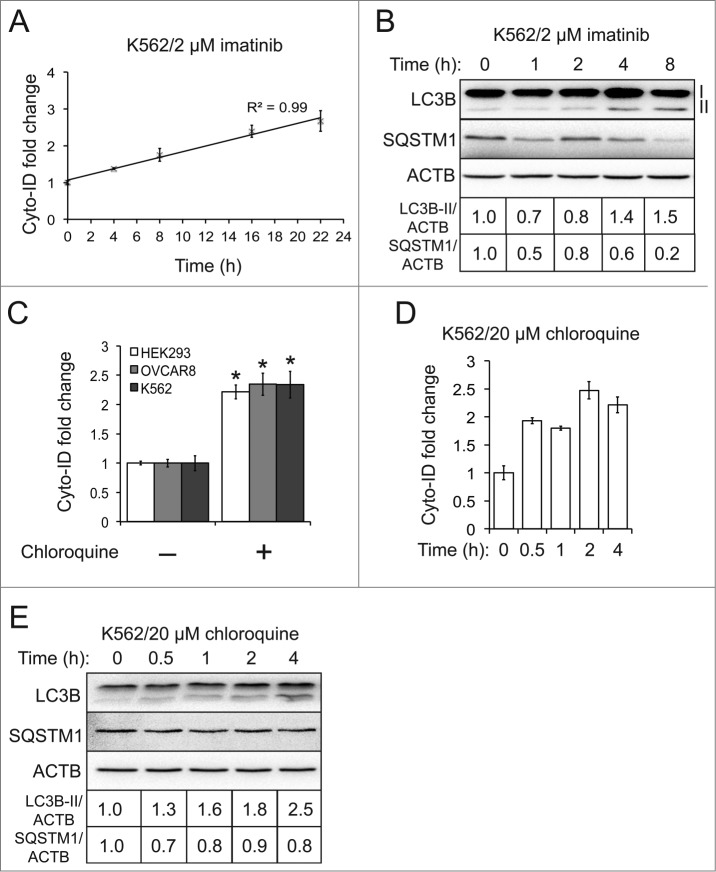
Figure 4. The Cyto-ID assay estimated autophagy flux. (A) Imatinib-induced autophagy flux at different time points measured by the Cyto-ID assay. (B) Imatinib-induced autophagy flux at different time points measured by the LC3B or SQSTM1 immunoblotting assay. (C) Chloroquine-blocked autophagy flux at steady state. The chloroquine treatments were 5 μM in HEK293 for 4 h, 20 μM in OVCAR8 for 4 h, or 20 μM in K562 for 4 h, respectively. (D) Chloroquine-blocked autophagy flux at different time points analyzed by the Cyto-ID assay. (E) Chloroquine-blocked autophagy flux at different time points analyzed by the LC3B or SQSTM1 immunoblotting assay. All experiments were repeated 3 times and error bars depict means ± s.d. *P < 0.05.
Figure 4. The Cyto-ID assay estimated autophagy flux. (A) Imatinib-induced autophagy flux at different time points measured by the Cyto-ID assay. (B) Imatinib-induced autophagy flux at different time points measured by the LC3B or SQSTM1 immunoblotting assay. (C) Chloroquine-blocked autophagy flux at steady state. The chloroquine treatments were 5 μM in HEK293 for 4 h, 20 μM in OVCAR8 for 4 h, or 20 μM in K562 for 4 h, respectively. (D) Chloroquine-blocked autophagy flux at different time points analyzed by the Cyto-ID assay. (E) Chloroquine-blocked autophagy flux at different time points analyzed by the LC3B or SQSTM1 immunoblotting assay. All experiments were repeated 3 times and error bars depict means ± s.d. *P < 0.05.CC BY-NC · PubMed Central
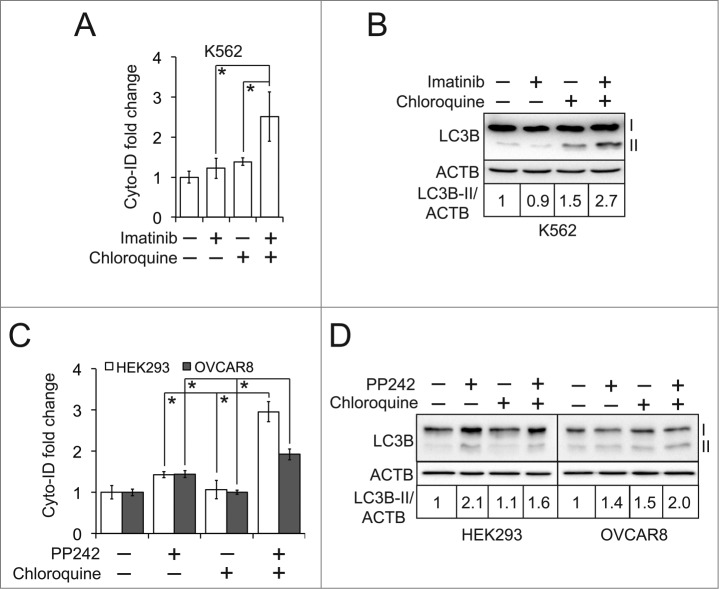
Figure 5. The Cyto-ID assay determined the status of autophagy flux. (A) Autophagy flux affected by imatinib and chloroquine. K562 cells were treated with 1 μM imatinib and/or 2.5 μM chloroquine for 6 h. (B) Autophagy flux assessed by the LC3B immunoblotting assay. (C) Autophagy flux affected by PP242 and chloroquine. HEK293 cells were treated with 1 μM PP242 together with 0.5 μM chloroquine for 1 h. OVCAR8 cells were treated with 2 μM PP242 and 0.25 μM chloroquine for 1 h. (D) Autophagy flux assessed by the LC3B immunoblotting assay. All experiments were repeated 3 times and error bars depict means ± s.d.; * P < 0.05.
Figure 5. The Cyto-ID assay determined the status of autophagy flux. (A) Autophagy flux affected by imatinib and chloroquine. K562 cells were treated with 1 μM imatinib and/or 2.5 μM chloroquine for 6 h. (B) Autophagy flux assessed by the LC3B immunoblotting assay. (C) Autophagy flux affected by PP242 and chloroquine. HEK293 cells were treated with 1 μM PP242 together with 0.5 μM chloroquine for 1 h. OVCAR8 cells were treated with 2 μM PP242 and 0.25 μM chloroquine for 1 h. (D) Autophagy flux assessed by the LC3B immunoblotting assay. All experiments were repeated 3 times and error bars depict means ± s.d.; * P < 0.05.CC BY-NC · PubMed Central
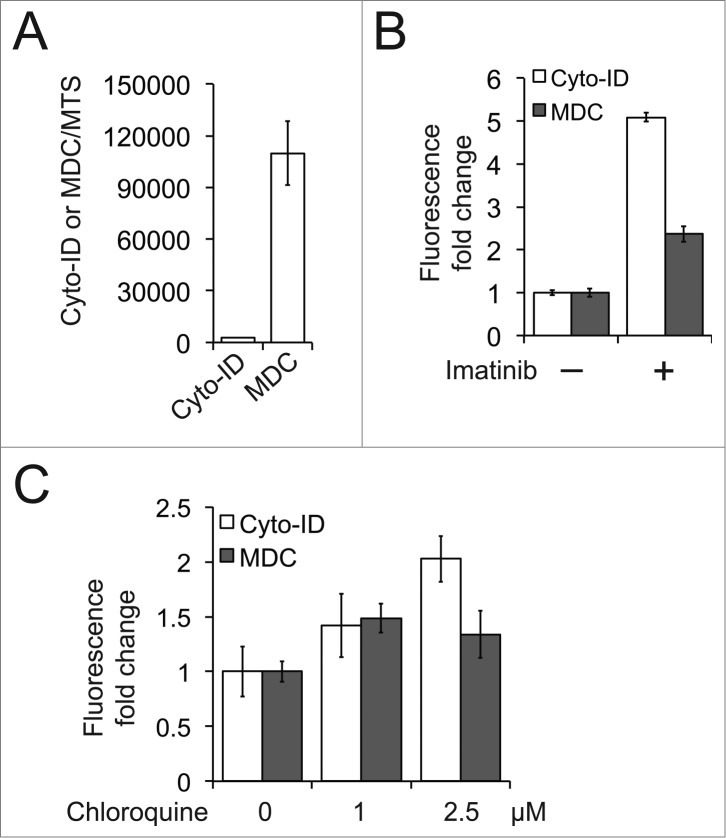
Figure 6. The Cyto-ID was more sensitive than MDC in quantifying autophagic compartments. (A) Background levels of the Cyto-ID or MDC fluorescence in nonautophagic K562 cells. (B) Imatinib-induced autophagy. K562 cells were treated with 1 μM imatinib for 16 h and autophagy was assayed by the Cyto-ID- or MDC-based spectrophotometric assay. (c) Chloroquine-blocked autophagy flux in K562 cells.
Figure 6. The Cyto-ID was more sensitive than MDC in quantifying autophagic compartments. (A) Background levels of the Cyto-ID or MDC fluorescence in nonautophagic K562 cells. (B) Imatinib-induced autophagy. K562 cells were treated with 1 μM imatinib for 16 h and autophagy was assayed by the Cyto-ID- or MDC-based spectrophotometric assay. (c) Chloroquine-blocked autophagy flux in K562 cells.CC BY-NC · PubMed Central
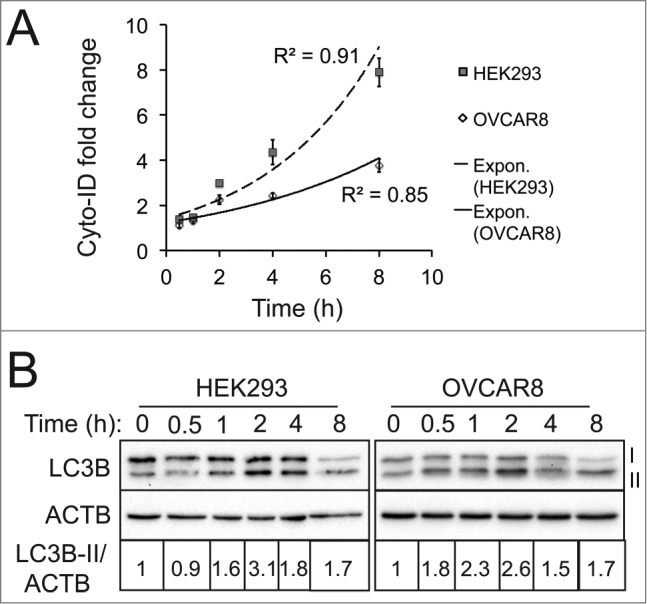
Figure 7. The Cyto-ID assay yielded a more reliable quantification of autophagic compartments. (A) PP242-induced autophagy at different time points assessed by the Cyto-ID assay. HEK293 or OVCAR8 cells were treated with PP242 (4 or 10 μM, respectively) at the indicated time points. (B) PP242-induced autophagy at different time points analyzed by the LC3B immunoblotting assay. All experiments were repeated 3 times and error bars depict means ± s.d.
Figure 7. The Cyto-ID assay yielded a more reliable quantification of autophagic compartments. (A) PP242-induced autophagy at different time points assessed by the Cyto-ID assay. HEK293 or OVCAR8 cells were treated with PP242 (4 or 10 μM, respectively) at the indicated time points. (B) PP242-induced autophagy at different time points analyzed by the LC3B immunoblotting assay. All experiments were repeated 3 times and error bars depict means ± s.d.CC BY-NC · PubMed Central
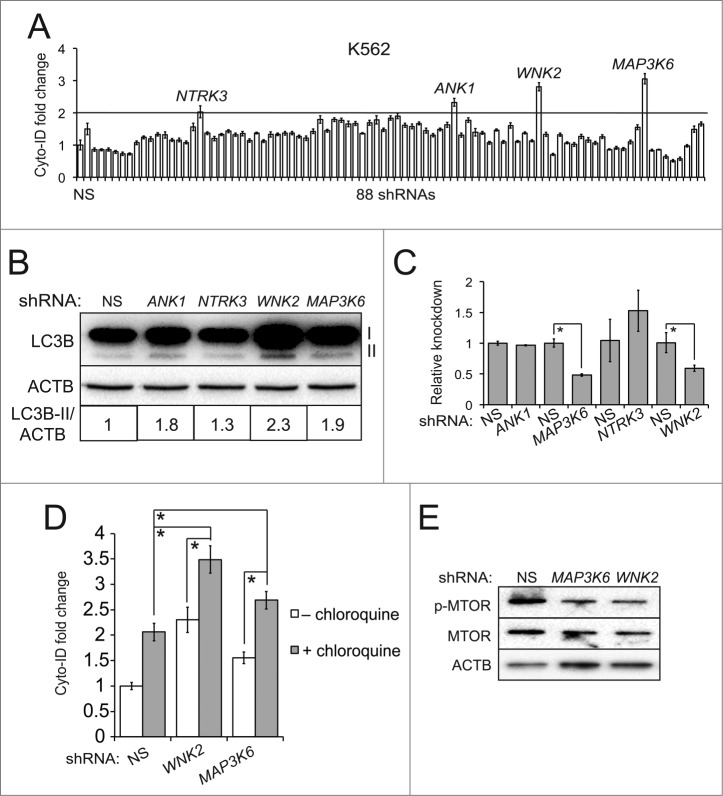
Figure 8. An RNAi screen identified MAP3K6 and WNK2 as autophagy-modulating genes. (A) An RNAi screen. K562 cells were transduced with the viruses of nonsilencing (NS) shRNA or 88 individual shRNAs of human kinases. The line represents the cut-off (2-fold increase). (B) Validation using the LC3B immunoblotting assay. K562 cells were transduced with the viruses harboring nonsilencing (NS) or candidate shRNAs. (C) Knockdown of each candidate gene. The mRNA levels of candidate genes were measured using qRT-PCR. (D) Autophagy flux affected by candidate shRNAs and chloroquine. K562 cells with NS or candidate shRNAs were treated with or without 2.5 μM chloroquine for 4 h. (E) MTOR pathway affected by shRNAs against MAP3K6 or WNK2. All experiments were repeated 3 times and error bars depict means ± s.d.; *P < 0.05.
Figure 8. An RNAi screen identified MAP3K6 and WNK2 as autophagy-modulating genes. (A) An RNAi screen. K562 cells were transduced with the viruses of nonsilencing (NS) shRNA or 88 individual shRNAs of human kinases. The line represents the cut-off (2-fold increase). (B) Validation using the LC3B immunoblotting assay. K562 cells were transduced with the viruses harboring nonsilencing (NS) or candidate shRNAs. (C) Knockdown of each candidate gene. The mRNA levels of candidate genes were measured using qRT-PCR. (D) Autophagy flux affected by candidate shRNAs and chloroquine. K562 cells with NS or candidate shRNAs were treated with or without 2.5 μM chloroquine for 4 h. (E) MTOR pathway affected by shRNAs against MAP3K6 or WNK2. All experiments were repeated 3 times and error bars depict means ± s.d.; *P < 0.05.CC BY-NC · PubMed Central
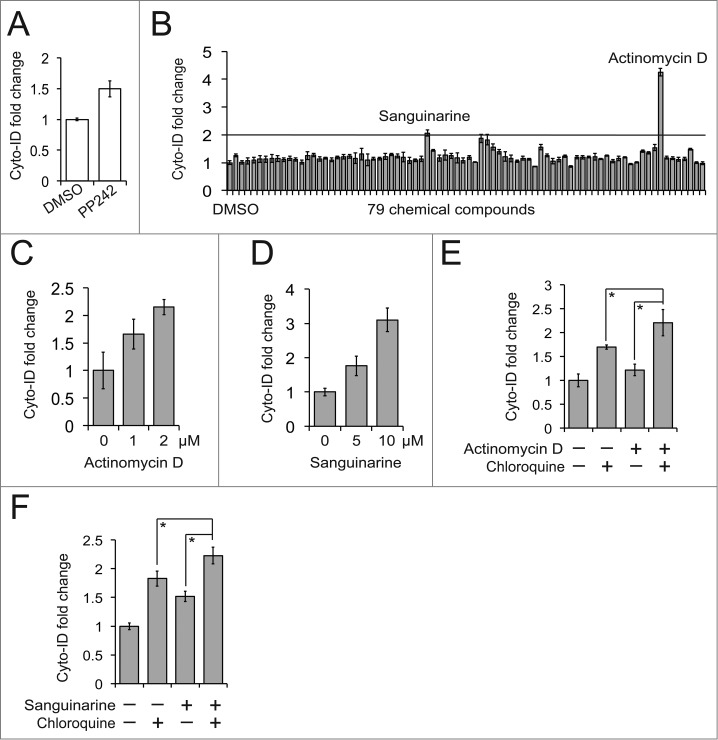
Figure 9. A small molecule screen identified actinomycin D and sanguinarine as autophagy modulators. (A) PP242-induced autophagy in K562 cells. K562 cells were treated with 10 μM PP242 for 4 h. (B) A small molecule screen. K562 cells were added to a 96-well plate preloaded with either vehicle (DMSO) or 79 chemical compounds and then incubated for 4 h. The line represents the cut-off (2-fold increase). (C) Actinomycin D-induced autophagy in K562 cells. (D) Sanguinarine-induced autophagy in K562 cells. (E) Actinomycin D-affected autophagy flux in K562 cells. K562 cells were treated with a combination of 1 μM actinomycin D and 2.5 μM chloroquine for 4 h. (F) Sanguinarine-affected autophagy flux. K562 cells were treated with a combination of 2 μM sanguinarine and 2.5 μM chloroquine for 4 h. All experiments were repeated 3 times and error bars depict means ± s.d.; *P < 0.05.
Figure 9. A small molecule screen identified actinomycin D and sanguinarine as autophagy modulators. (A) PP242-induced autophagy in K562 cells. K562 cells were treated with 10 μM PP242 for 4 h. (B) A small molecule screen. K562 cells were added to a 96-well plate preloaded with either vehicle (DMSO) or 79 chemical compounds and then incubated for 4 h. The line represents the cut-off (2-fold increase). (C) Actinomycin D-induced autophagy in K562 cells. (D) Sanguinarine-induced autophagy in K562 cells. (E) Actinomycin D-affected autophagy flux in K562 cells. K562 cells were treated with a combination of 1 μM actinomycin D and 2.5 μM chloroquine for 4 h. (F) Sanguinarine-affected autophagy flux. K562 cells were treated with a combination of 2 μM sanguinarine and 2.5 μM chloroquine for 4 h. All experiments were repeated 3 times and error bars depict means ± s.d.; *P < 0.05.CC BY-NC · PubMed Central
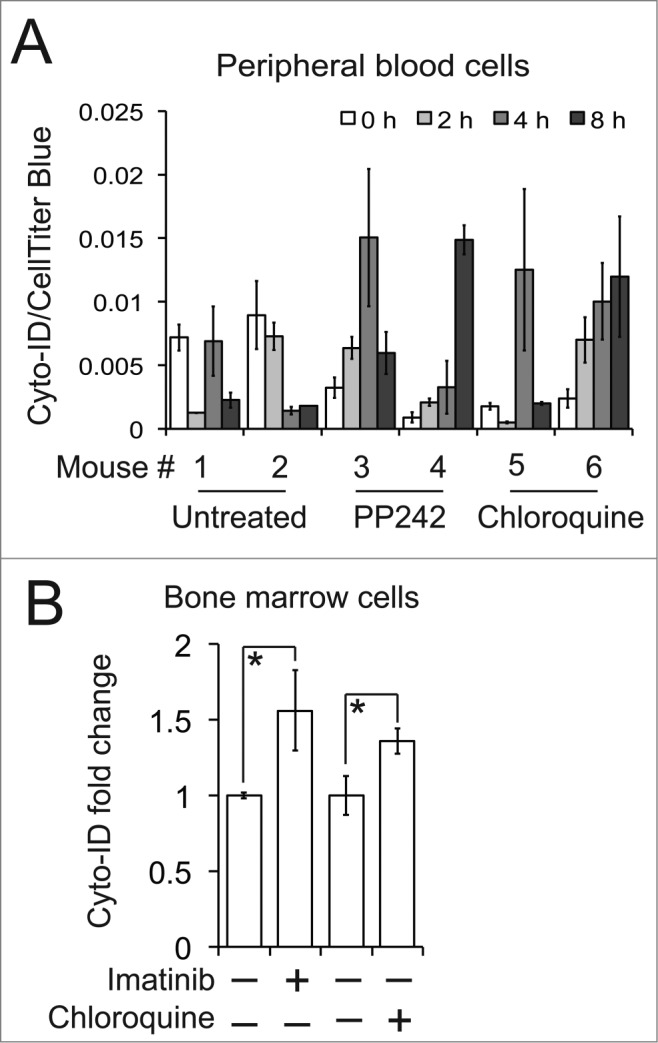
Figure 10. Detection of autophagy in mice. (A) PP242 or chloroquine-mediated autophagy in mouse primary peripheral blood cells. Mice were treated with PP242 (60 mg/kg/d, IP) or chloroquine (50 mg/kg/d, IP). (B) Imatinib or chloroquine-affected autophagy in primary bone marrow cells isolated from the mice with BCR-ABL-driven leukemia. Leukemic mice were treated with either imatinib (100 mg/kg/d) or chloroquine (50 mg/kg/every other day) by gavage. There are 3 or 4 mice per treatment group and error bars depict means ± s.d.; * P < 0.05.
Figure 10. Detection of autophagy in mice. (A) PP242 or chloroquine-mediated autophagy in mouse primary peripheral blood cells. Mice were treated with PP242 (60 mg/kg/d, IP) or chloroquine (50 mg/kg/d, IP). (B) Imatinib or chloroquine-affected autophagy in primary bone marrow cells isolated from the mice with BCR-ABL-driven leukemia. Leukemic mice were treated with either imatinib (100 mg/kg/d) or chloroquine (50 mg/kg/every other day) by gavage. There are 3 or 4 mice per treatment group and error bars depict means ± s.d.; * P < 0.05.CC BY-NC · PubMed Central

Verification

Claims the paper makes

The claims and statistics of this paper haven’t been checked yet.

Run the check — free, no account needed. It reads the open-access text and checks the sources it cites.

A few free checks a day · papers already verified open instantly · results are public

Claims other papers make about this one

Each is checked against this paper’s own text: does it say what the citing paper says it does?

Self-check

Percentages, sums and reported differences re-computed from the paper’s own numbers.

The self-check needs the paper’s full text.

Citations

Cites

Show all 5 references

Research works printed but not linked: 24

  1. Parzych KR, 2013, Antioxid Redox Signal, 4, 460
  2. 10.1038/nrd3802 · DOI
  3. 10.1056/NEJMra1205406 · DOI · Paper page
  4. 10.7326/0003-4819-144-5-200603070-00008 · DOI
  5. 10.1016/S0140-6736(12)61134-9 · DOI · Paper page
  6. 10.1016/j.cell.2010.01.028 · DOI · Paper page
  7. 10.4161/auto.21028 · DOI
  8. 10.1007/s00418-012-1057-6 · DOI
  9. 10.1034/j.1600-0854.2003.00135.x · DOI
  10. 10.1371/journal.pbio.0030233 · DOI
  11. 10.1038/nchembio.117 · DOI
  12. 10.1073/pnas.79.6.1889 · DOI
  13. 10.1016/0040-8166(81)90013-6 · DOI
  14. Biederbick A, 1995, Eur J Cell Biol, 66, 3
  15. 10.4161/auto.1.1.1495 · DOI
  16. 10.1074/jbc.M703663200 · DOI · Paper page
  17. Kovacs J, 1972, Acta Biol Acad Sci Hung, 23, 181
  18. 10.1016/j.devcel.2010.05.005 · DOI
  19. 10.1038/emboj.2012.36 · DOI
  20. 10.1038/nature10546 · DOI · Paper page
  21. 10.4161/auto.7.8.15770 · DOI · Paper page
  22. 10.1073/pnas.0709695104 · DOI
  23. 10.1182/blood-2010-12-322537 · DOI
  24. 10.1038/emboj.2009.35 · DOI

Cited by

Sorted by citations

See all 148

Metadata

Authors
Guo, S., Liang, Y., Murphy, S. F., Huang, A., Shen, H., Kelly, D. F., Sobrado, P., & Sheng, Z.
Venue
Autophagy
Published
2015-02-25
Volume
11
Issue
3
Pages
560-572
ISSN
  • 1554-8627
  • 1554-8635
Cited by
148
References
5
Language
en

About these checks

Registry, retraction, Cites and statistics results are computed, not judged, with one exception: a printed reference that no index lists is read once by a model before it counts as a citation error. Claims are extracted by a model and kept only when their quote appears verbatim in the text; each cited source is then checked, with a model’s help, for whether it says what the claim relies on. Those verdicts can be wrong — read the claim’s quote and the cited source before relying on one.

Statistics and arithmetic are recomputed, not judged.

Confidence bands are shown only for fields calibrated on our annotated test set. None is calibrated yet, so no band is shown.

What counts as a claim ›How we measure confidence ›How we check this ›

Are you an author, or do you see a problem with this page? Request a review

How to cite

Cite CoChat for the checks on this page, and the paper for its own findings.

This page
CoChat. (2026). Citation check: A rapid and high content assay that measures cyto-ID-stained autophagic compartments and estimates autophagy flux with potential clinical applications. https://app.cochat.ai/papers/10.1080/15548627.2015.1017181
The paper
Guo, S., Liang, Y., Murphy, S. F., Huang, A., Shen, H., Kelly, D. F., Sobrado, P., & Sheng, Z. (2015). A rapid and high content assay that measures cyto-ID-stained autophagic compartments and estimates autophagy flux with potential clinical applications. Autophagy. https://doi.org/10.1080/15548627.2015.1017181