

The DOI matches its Crossref record; 98 of the 101 references it cites were found in a registry or an index.
Autophagy flux in CA1 neurons of Alzheimer hippocampus: Increased induction overburdens failing lysosomes to propel neuritic dystrophy
Open accessAbstract
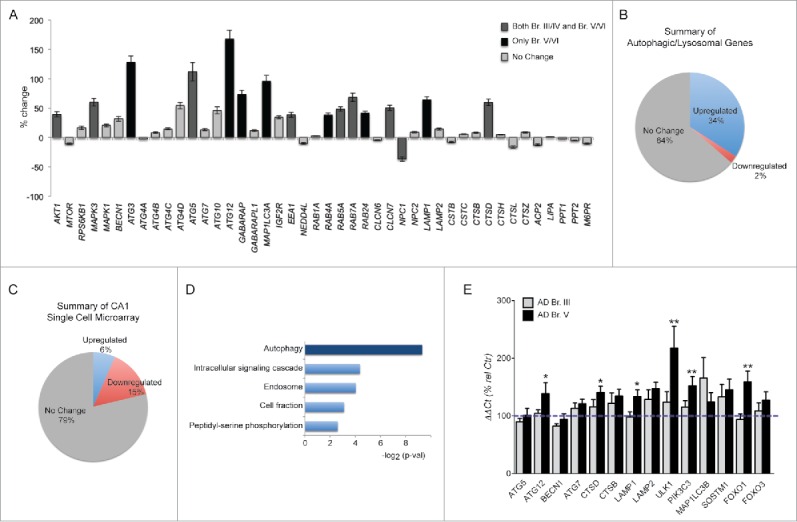
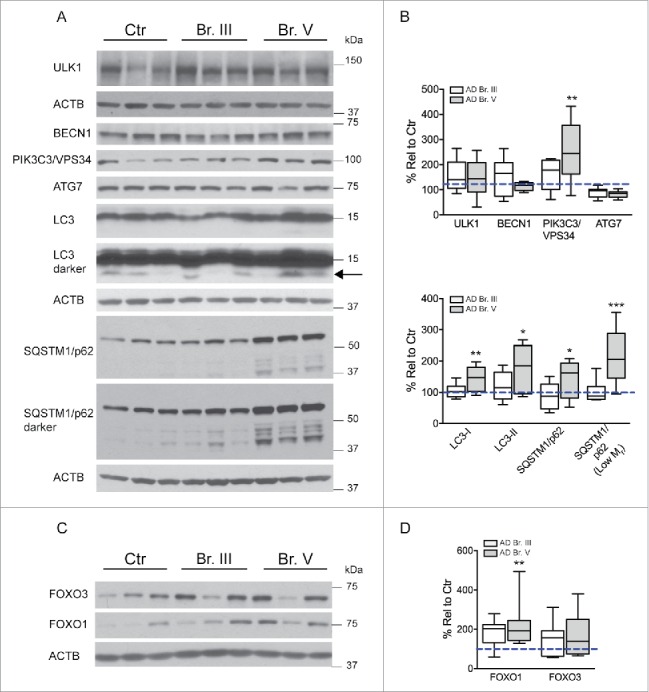
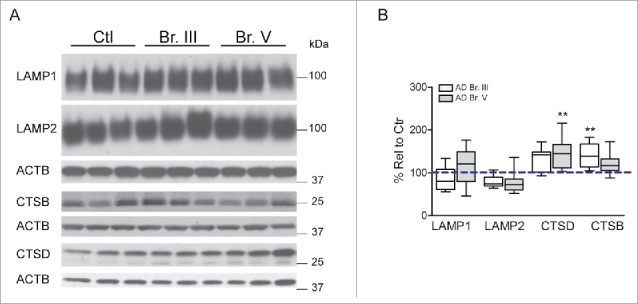
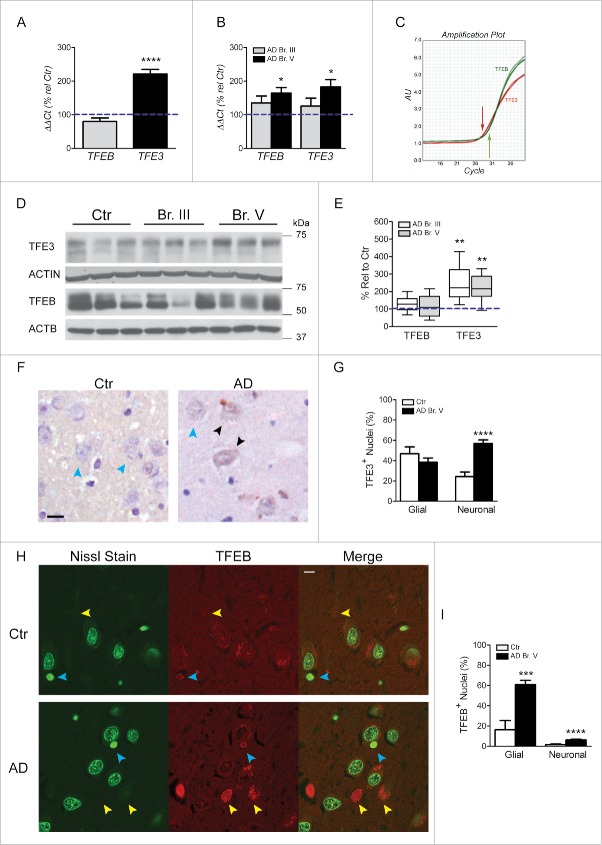
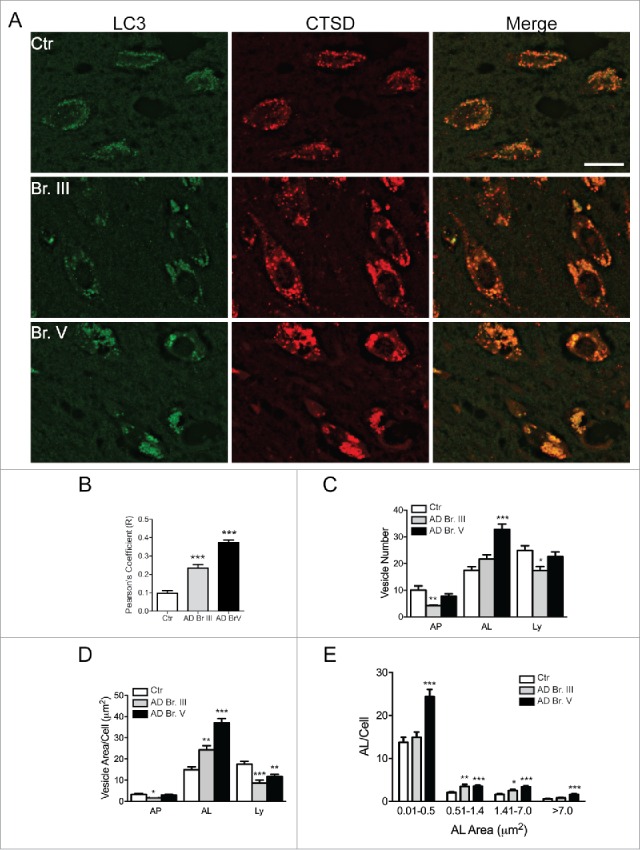
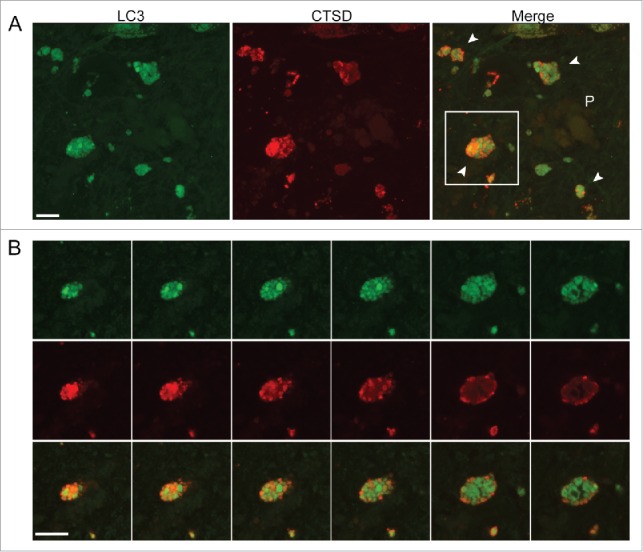
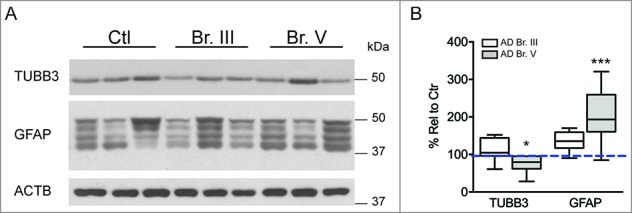
Defective autophagy contributes to Alzheimer disease (AD) pathogenesis although evidence is conflicting on whether multiple stages are impaired. Here, for the first time, we have comprehensively evaluated the entire autophagic process specifically in CA1 pyramidal neurons of hippocampus from early and late-stage AD subjects and nondemented controls. CA1 neurons aspirated by laser capture microdissection were analyzed using a custom-designed microarray comprising 578 neuropathology- and neuroscience-associated genes. Striking upregulation of autophagy-related genes, exceeding that of other gene ontology groups, reflected increases in autophagosome formation and lysosomal biogenesis beginning at early AD stages. Upregulated autophagosome formation was further indicated by elevated gene and protein expression levels for autophagosome components and increased LC3-positive puncta. Increased lysosomal biogenesis was evidenced by activation of MiTF/TFE family transcriptional regulators, particularly TFE3 (transcription factor binding to IGHM enhancer 3) and by elevated expression of their target genes and encoded proteins. Notably, TFEB (transcription factor EB) activation was associated more strongly with glia than neurons. These findings establish that autophagic sequestration is both competent and upregulated in AD. Autophagosome-lysosome fusion is not evidently altered. Despite this early disease response, however, autophagy flux is progressively impeded due to deficient substrate clearance, as reflected by autolysosomal accumulation of LC3-II and SQSTM1/p62 and expansion of autolysosomal size and total area. We propose that sustained induction of autophagy in the face of progressively declining lysosomal clearance of substrates explains the uncommonly robust autophagic pathology and neuritic dystrophy implicated in AD pathogenesis.
Overview
The claims and statistics of this paper haven’t been checked yet.
Run the check — free, no account needed. It reads the open-access text and checks the sources it cites.
Integrity signals
Registry
Cites
Statistics
Figures
Verification
Claims the paper makes
The claims and statistics of this paper haven’t been checked yet.
Run the check — free, no account needed. It reads the open-access text and checks the sources it cites.
Claims other papers make about this one
Each is checked against this paper’s own text: does it say what the citing paper says it does?
The cited source doesn’t support the claim as written.
In the citing paper
“Gene set enrichment analyses were performed according to standard procedures [39, 40] on two published RNA-seq datasets [31, 48]”
From A gene toolbox for monitoring autophagy transcription (2021) · cites this paper as [48]
Checked by a reasoning model — may be wrong.
Experimental — accuracy not yet measuredIn the citing paper
“Disruption of autophagic flux and a failure of autophagosomes to fuse with lysosomes leads to a build-up of vesicles, which can be seen in dystrophic neurites and cell bodies in AD, CBD and PSP, as well as in tauopathy models73–76.”
From Tau-targeting therapies for Alzheimer disease (2018) · cites this paper as [75]
Self-check
Percentages, sums and reported differences re-computed from the paper’s own numbers.
The self-check needs the paper’s full text.
Citations
Cites
Fiji: an open-source platform for biological-image analysis
Schindelin, J., Arganda-Carreras, I., Frise, E., Kaynig, V., Longair, M., Pietzsch, T., Preibisch, S., Rueden, C., Saalfeld, S., Schmid, B., et al. (2012) · Nature Methods · doi:10.1038/nmeth.2019 · Cited by 66,890
Systematic and integrative analysis of large gene lists using DAVID bioinformatics resources
Huang, D. W., Sherman, B. T., & Lempicki, R. A. (2009) · Nature Protocols · doi:10.1038/nprot.2008.211 · Cited by 35,890
Vandesompele, J., De Preter, K., Pattyn, F., Poppe, B., Van Roy, N., De Paepe, A., & Speleman, F. (2002) · Genome Biology · doi:10.1186/gb-2002-3-7-research0034 · Cited by 20,038
Measurement of protein using bicinchoninic acid
Smith, P. K., Krohn, R. I., Hermanson, G. T., Mallia, A. K., Gartner, F. H., Provenzano, M. D., Fujimoto, E. K., Goeke, N. M., Olson, B. J., & Klenk, D. C. (1985) · Analytical Biochemistry · doi:10.1016/0003-2697(85)90442-7 · Cited by 18,482
Neuropathological stageing of Alzheimer-related changes.
Braak, H., & Braak, E. (1991) · Acta Neuropathologica · doi:10.1007/bf00308809 · Cited by 16,123 · cited 3×
“V/VI, n D 15).79 Based on results from these analyses, subsequent studies were typed solely on the basis of the primary neuropathological assessment as described by Braak and Braak.79 For qPCR and western blot analyses, fresh-frozen postmortem human brain tissue was obtained from the Harvard Brain Tissue Resource Cent…”
MethodInfluentialGuidelines for the use and interpretation of assays for monitoring autophagy (3rd edition).
Klionsky, D. J., Abdelmohsen, K., Abe, A., Abedin, M. J., Abeliovich, H., Acevedo Arozena, A., Adachi, H., Adams, C. M., Adams, P. D., Adeli, K., et al. (2016) · Autophagy · doi:10.1080/15548627.2015.1100356 · Cited by 5,894
Glenner, G. G., & Wong, C. W. (1984) · Biochemical and Biophysical Research Communications · doi:10.1016/s0006-291x(84)80190-4 · Cited by 5,404
Mirra, S. S., Heyman, A., McKeel, D., Sumi, S. M., Crain, B. J., Brownlee, L. M., Vogel, F. S., Hughes, J. P., Belle, G. V., Berg, L., et al. (1991) · Neurology · doi:10.1212/wnl.41.4.479 · Cited by 4,961
Autophagy and the Integrated Stress Response
Kroemer, G., Mariño, G., & Levine, B. (2010) · Molecular Cell · doi:10.1016/j.molcel.2010.09.023 · Cited by 3,506
TFEB Links Autophagy to Lysosomal Biogenesis
Settembre, C., Di Malta, C., Polito, V. A., Arencibia, M. G., Vetrini, F., Erdin, S., Erdin, S. U., Huynh, T., Medina, D., Colella, P., et al. (2011) · Science · doi:10.1126/science.1204592 · Cited by 3,365
Research works printed but not linked: 4
- Kawai M, 1992, Am J Pathol, 140, 947
- Pickford F, 2008, J Clin Invest, 118, 2190
- Kim S, 2015, Mol Psychiatry
- Schmidt SD, 2005, Methods Mol Biol, 299, 267
Cited by
Sorted by citations
Items 301–354 of 354
Mitochondrial response to axonal injury
Kedra, J. (2020) · TUScholarShare (Temple University)
Guha, S. K., Cheng, A., Carroll, T., King, D. P., Koren, S. A., Swords, S., Nehrke, K. W., & Johnson, G. V. W. (2021) · Research Square · doi:10.21203/rs.3.rs-1096882/v1
Chapman, E. R., & Vevea, J. (2018) · Faculty Opinions – Post-Publication Peer Review of the Biomedical Literature · doi:10.3410/f.733114368.793553076
Im, E., Jiang, Y., Stavrides, P. H., Darji, S., Erdjument‐Bromage, H., Thomas, N. A., Bordi, M., Choi, J. Y., Lee, J., & Nixon, R. A. (2022) · SSRN Electronic Journal · doi:10.2139/ssrn.4106838
Self-citationSundermeyer, J. (2022) · eDiss (Georg-August-Universität Göttingen) · doi:10.53846/goediss-9423
Nodweddu effaith signalu ghrelin-GHS-R ar awtoffagi niwronaidd
Roberts, L. D. (2022) · Cronfa (Swansea University) · doi:10.23889/suthesis.62285
Smit, C., de Wet, S., van Blerk, T. B., & Loos, B. (2023) · Biogerontology · doi:10.1007/s10522-022-10012-z
Baer, S. B., Dorn, A. D., & Osborne, D. M. (2023) · Research Square · doi:10.21203/rs.3.rs-2724928/v1
Alternative Hypotheses and Observations that Were Somehow Lost on the Way
Behl, C. (2023) · Springer eBooks · doi:10.1007/978-3-031-31570-1_17
The role of Banf1 in mechanisms of cellular ageing and cancer prognosis
Plowman, J. (2024) · Queensland University of Technology · doi:10.5204/thesis.eprints.247163
Lin, W., Zhao, L., Liang, G., Zhou, R., Zheng, X., Tao, R., Huo, Q., Su, C.-F., Li, M., Xu, N., et al. (2023) · Figshare · doi:10.6084/m9.figshare.22612913
Lysosomal pH Homeostasis and Parkinson’s Disease
温, 娜. (2024) · Advances in Clinical Medicine · doi:10.12677/acm.2024.1451672
Qi, W., Dong, N., Peiru, W. U., Fu, W., Liu, Q., Zhang, X., Wu, H., He, X., Wu, L., Ward, N., et al. (2024) · Research Square · doi:10.21203/rs.3.rs-4458094/v1
Ambareen, N., Gharami, K., & Biswas, S. C. (2024) · bioRxiv (Cold Spring Harbor Laboratory) · doi:10.1101/2024.08.06.606751
TFEB and TFE3 have cell-type specific expression in the brain and divergent roles in neuronsPreprint
McGuinness, W., Ryan, B. J., Guardado, C. L., Carling, P., Vallin, B., Caiazza, M. C., Heon‐Roberts, R., Kilfeather, P., Wantling, J., Hoffmann, J., et al. (2025) · bioRxiv (Cold Spring Harbor Laboratory) · doi:10.1101/2025.04.22.649949 · Cited by 3
Guvenir, A., & Osborne, D. M. (2025) · Journal of Emerging Investigators · doi:10.59720/23-206
Regulated cell death: Discovery, features, and implications for neurodegenerative diseases
Pandey, S. K., Nanda, A., Singh, S., & Singh, R. K. (2025) · Elsevier eBooks · doi:10.1016/b978-0-443-32852-7.00001-2
Bakkar, N. Z., Arida, R. E., Soliman, A. Y., & EL‐Yazbi, A. F. (2025) · Elsevier eBooks · doi:10.1016/b978-0-443-32852-7.00016-4
Impaired MAPT/tau-secretory lysosomes are linked to cognitive vulnerability in Alzheimer patients
Sharma, P., Pallavi, A., Chatterjee, A., Prasad, V. M., Gandasi, N. R., & Saroja, S. R. (2025) · Autophagy · doi:10.1080/15548627.2025.2552905
Ambareen, N., Gharami, K., Mondal, A., Sarkar, U. A., & Biswas, S. C. (2025) · Journal of Biological Chemistry · doi:10.1016/j.jbc.2025.110875
Salvany, S., Hernández, S., Garcia-Casanovas, A., Gras, S., Piedrafita, L., Bosch-Queralt, M., Schwab, M. H., Calderó, J., Esquerda, J. E., & Tarabal, O. (2025) · International Journal of Molecular Sciences · doi:10.3390/ijms262311421
Liu, Y., Zhang, C., Wang, X., Shao, Y., Cai, X., Liu, H., Zhu, H., Liu, X., Qian, Y., & Wang, X. (2025) · Biosensors and Bioelectronics · doi:10.1016/j.bios.2025.118284
Wu, Y., Mumford, P., Noy, S., Cleverley, K., Mrzyglod, A., Luo, D., van Dalen, F., Verdoes, M., Fisher, E., & Wiseman, F. K. (2023) · Figshare · doi:10.6084/m9.figshare.23949660
Baer, S. B., Dorn, A. D., & Osborne, D. M. (2024) · Figshare · doi:10.6084/m9.figshare.26658469
Baer, S. B., Dorn, A. D., & Osborne, D. M. (2024) · Figshare · doi:10.6084/m9.figshare.26658472
Baer, S. B., Dorn, A. D., & Osborne, D. M. (2024) · Figshare · doi:10.6084/m9.figshare.26658466
Lin, W., Li, Z., Liang, G., Zhou, R., Zheng, X., Tao, R., Huo, Q., Su, C., Li, M., Xu, N., et al. (2023) · Figshare · doi:10.6084/m9.figshare.22612910
Yang, H., Fu, R., DUAN, Y., Hua, Y., Wei, T., Li, G., Gu, X., Li, M., Yu, X., Li, L., et al. (2026) · Neurotoxicity Research · doi:10.1007/s12640-026-00791-5
Liu, W., Bai, Y., Qu, W., Zhang, X., Zhou, S., Luo, H., Zhu, M., Li, D., & Fang, X. (2026) · Frontiers in Aging Neuroscience · doi:10.3389/fnagi.2026.1752446
The role of MicroRNAs in Alzheimer’s disease: from pathogenesis to therapeutic potential
Zhou, Y., Li, S., & Xiang, J. (2026) · Molecular Biology Reports · doi:10.1007/s11033-026-11746-6
Drug Discovery for Alzheimer’s Disease: Current Status
Wolfe, M. S. (2026) · Topics in medicinal chemistry · doi:10.1007/7355_2026_186
Mécanismes de régulation de l’ecto-F1-ATPase par la mitophagie
Fried, S. (2018) · theses.fr (ABES) · doi:10.70675/f53f2ce5z6e85z479bz9bbbz68e1878cc5bc
Maladies neurodégénératives et stress oxydant
Lévy, E. (2020) · theses.fr (ABES) · doi:10.70675/75371581z194fz4cb4zb457z91bf72dc0320 · Cited by 4
Role of PTH and PTHrP in the central regulation of energy metabolism
Galerne, M. (2024) · theses.fr (ABES) · doi:10.70675/31092b82za087z48dczb698z1409347feb21
Behl, C. (2026) · Springer eBooks · doi:10.1007/978-3-662-72210-7_20
Alternative Hypothesen und Beobachtungen, die verloren gingen
Behl, C. (2026) · Springer eBooks · doi:10.1007/978-3-662-72210-7_17
Integrative genomic and functional analyses reveal NINL as a modulator of tau aggregation
Swift, S. K., Huang, G., Cochran, J. N., Albanus, R. D., Minaya, M., Castruita, P. A., Zhang, R., Miller, K. J., Starr, E., Galasso, G., et al. (2026) · Alzheimer s & Dementia · doi:10.1002/alz.71352 · Cited by 1
Lee, S., Kim, J. C., Song, J., Lee, Y., Kim, M., Chang, S.-H., Kim, J. S., Park, J.-S., Choi, M., & Lee, S. (2026) · Neuropharmacology · doi:10.1016/j.neuropharm.2026.110970 · Cited by 1
Yan, J., Feng, H., Xia, Q., Shen, D., Jin, H. K., Sun, R., Sun, J. F., Tang, W., Yu, X., Guo, F., et al. (2026) · Analytical Chemistry · doi:10.1021/acs.analchem.5c08045
The modifier matrix: emerging roles of ubiquitin-like proteins in Alzheimer’s disease
颜亭祥, Vaquer, J., Springer, W., & Fiesel, F. C. (2026) · Molecular Neurodegeneration Advances · doi:10.1186/s44477-026-00031-2
TFE3 Regulates Microglial Phagocytosis and Inflammation in MPTP-induced Parkinson’s Disease
Liu, Q., Xie, W., Tian, X., Su, Z., Wang, Z., Zhang, Y., Wang, H., Zuo, D., Du, H., Gao, J., et al. (2026) · Molecular Neurobiology · doi:10.1007/s12035-026-06012-6
Yang, F., & Zhao, Y. (2026) · Food and Chemical Toxicology · doi:10.1016/j.fct.2026.116276
Astrocytic lactate shuttle disruption and the energy-starved lysosome in Alzheimer's diseasePreprint
Kim¹, Y., Heo, W., Park, S. J., Kim, Y., & Cho², Y. E. (2026) · Research Square · doi:10.21203/rs.3.rs-10057949/v1
Endoplasmic Reticulum Stress Drives Copper-Induced Reticulophagy in Porcine Hepatocytes
Yang, S., Chen, W., Xi, H., Qiu, W., Huang, H., Wang, S., Liao, J., & Tang, Z. (2026) · Journal of Agricultural and Food Chemistry · doi:10.1021/acs.jafc.5c16689
Aβ-induced CaMKII hyperactivation is associated with impaired lysosomal maturation and mitophagy
Suh, E. C., Kim, Y. A., Lee, K. E., & Park, E. (2026) · Neurochemistry International · doi:10.1016/j.neuint.2026.106252
Corrales, N., Vallejo-Bedia, F., Olivares-Raya, I., Ávila, J., & García‐Escudero, V. (2026) · Applied Sciences · doi:10.3390/app16199488
Liu, Y., Li, X., Wang, M., Fan, X., Liu, W., Wang, Y., Li, W., Miao, Y., & Li, X. (2026) · Experimental Neurology · doi:10.1016/j.expneurol.2026.116092
Abd-Elraouf, K., Murphy, D. T., Cheong, L. Y. T., Zeng, J., & Lo, C. H. (2026) · Translational Neurodegeneration · doi:10.1186/s40035-026-00591-z
Metadata
- Authors
- Bordi, M., Berg, M. J., Mohan, P. S., Peterhoff, C. M., Alldred, M. J., Che, S., Ginsberg, S. D., & Nixon, R. A.
- Affiliations
- Nathan Kline Institute for Psychiatric Research (US)
- Corresponding author
- Nixon, Ralph A.
- Venue
- Autophagy
- Publisher
- Informa UK Limited
- Published
- 2016-11-04
- Volume
- 12
- Issue
- 12
- Pages
- 2467-2483
- ISSN
- 1554-8627 (ISSN-L)
- 1554-8635
- PMC
- PMC5173282
- OpenAlex
- W2547593615
- Cited by
- 353
- References
- 101
- Citations by year
- 2026: 23 · 2025: 37 · 2024: 41 · 2023: 38 · 2022: 37 · 2021: 42 · 2020: 48 · 2019: 34 · 2018: 30 · 2017: 22
- FWCI
- 26.84
- Type
- journal article
- Language
- en
- Open access
- hybrid
- doi.org
- Licence
- Locations
- Autophagy (publishedVersion, cc-by-nc)
- PubMed Central (publishedVersion, cc-by-nc)
- PubMed (publishedVersion)
- Funders
- Emory University
- National Institute on Aging (P01AG014449, R01AG043375, P50AG025688, P01AG017617)
- National Institute of Neurological Disorders and Stroke (P30NS055077)
- Topics
- Life Sciences › Biochemistry, Genetics and Molecular Biology › Cell Biology › Autophagy in Disease and Therapy
- Life Sciences › Neuroscience › Cellular and Molecular Neuroscience › Alzheimer's disease research and treatments
- Life Sciences › Biochemistry, Genetics and Molecular Biology › Physiology › Calcium signaling and nucleotide metabolism
- Keywords
- Alzheimer's disease, autophagic flux, CA1 pyramidal neurons, hippocampus, autophagosome formation, lysosomal biogenesis, TFE3, TFEB, p62, LC3-II, neuritic dystrophy, autophagosome-lysosome fusion
- MeSH terms
- Autophagosomes, Aged, Aged, 80 and over, Alzheimer Disease, Autophagy, Cathepsin D, Demography, Female, Gene Expression Regulation, Humans, Lysosomes, Male, Microtubule-Associated Proteins, Middle Aged, Neurites, Basic Helix-Loop-Helix Leucine Zipper Transcription Factors, CA1 Region, Hippocampal
About these checks
Registry, retraction, Cites and statistics results are computed, not judged, with one exception: a printed reference that no index lists is read once by a model before it counts as a citation error. Claims are extracted by a model and kept only when their quote appears verbatim in the text; each cited source is then checked, with a model’s help, for whether it says what the claim relies on. Those verdicts can be wrong — read the claim’s quote and the cited source before relying on one.
Statistics and arithmetic are recomputed, not judged.
Confidence bands are shown only for fields calibrated on our annotated test set. None is calibrated yet, so no band is shown.
What counts as a claim ›How we measure confidence ›How we check this ›
Are you an author, or do you see a problem with this page? Request a review
