Cited by 152

The DOI matches its Crossref record; 6 of the 6 references it cites were found in a registry or an index.

Mir223 restrains autophagy and promotes CNS inflammation by targeting ATG16L1

Li, Yan, Zhou, Dongmei, Ren, Yinghui, Zhang, Zimu, Guo, Xiangdong, Ma, MingKun, Xue, Zhenyi, Lv, Jienv, Liu, Hongkun, Xi, Qing, Jia, Long, Zhang, Lijuan, Liu, Ying, Zhang, Qi, Yan, Jun, Da, Yurong, Gao, Fei, Yue, Jianbo, Yao, Zhi, Zhang, Rongxin·2019·Autophagy

Overview

The claims and statistics of this paper haven’t been checked yet.

Run the check — free, no account needed. It reads the open-access text and checks the sources it cites.

A few free checks a day · papers already verified open instantly · results are public

Integrity signals

Registry

Crossref · 10.1080/15548627.2018.1522467

Cites

6 of 6 references verified0 citation errors · 0 not checkable

Statistics

Figures

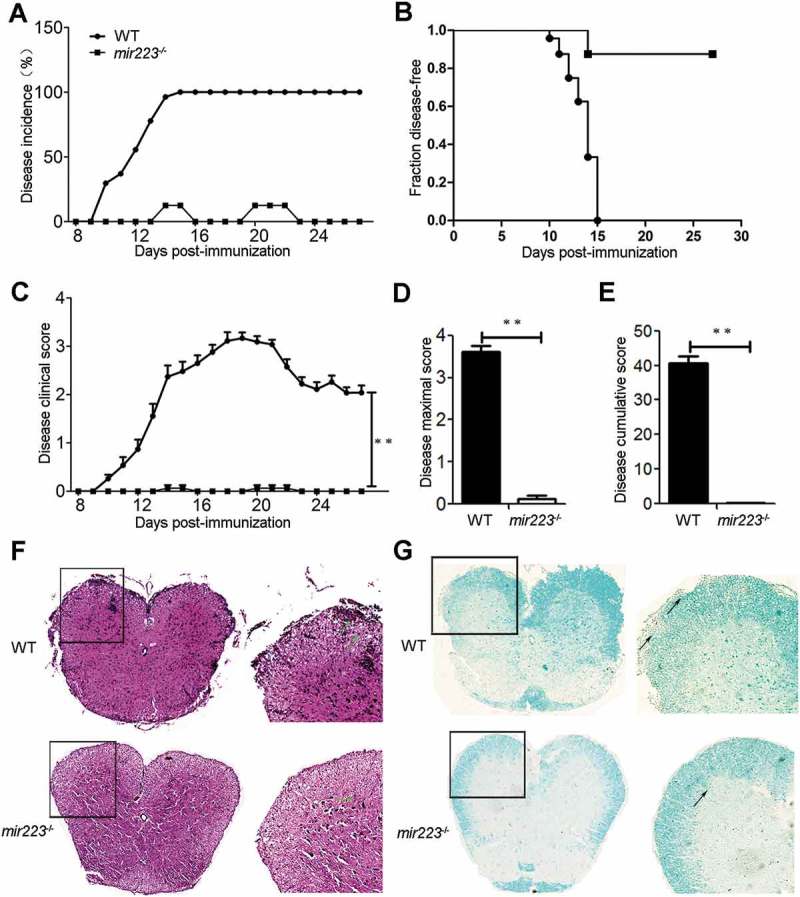
Figure 1. mir223−/- mice have alleviated EAE symptoms and decreased spinal cord inflammation and demyelination. EAE was induced with MOG[35–55] in female C57BL/6 mice (n = 12). The clinical scores of all of the EAE mice were assessed daily according to the same criteria for 28 continuous days. Incidence (A), disease onset (B), daily clinical scores (C), peak disease scores (D), and cumulative disease scores (E) were monitored. (A) The incidence of EAE (mice with clinical score ≥ 1 for 2 continuous days). The disease incidence is represented by the percentage of mice suffering from EAE. (B) Line graph depicts the EAE survival rate between WT and mir223−/- mice. (C) The clinical scores of all of the mice for 28 continuous days. (D) The mean maximum clinical scores. (E) The mean disease cumulative score. (F) H&E staining of representative spinal cord sections from mir223−/- mice and WT mice shows the infiltration of inflammatory cells in the white matter. (G) Luxol fast blue staining of intact myelin (blue) and demyelination (pink). The data are representative of at least 2 experiments with similar results.
Figure 1. mir223−/- mice have alleviated EAE symptoms and decreased spinal cord inflammation and demyelination. EAE was induced with MOG[35–55] in female C57BL/6 mice (n = 12). The clinical scores of all of the EAE mice were assessed daily according to the same criteria for 28 continuous days. Incidence (A), disease onset (B), daily clinical scores (C), peak disease scores (D), and cumulative disease scores (E) were monitored. (A) The incidence of EAE (mice with clinical score ≥ 1 for 2 continuous days). The disease incidence is represented by the percentage of mice suffering from EAE. (B) Line graph depicts the EAE survival rate between WT and mir223−/- mice. (C) The clinical scores of all of the mice for 28 continuous days. (D) The mean maximum clinical scores. (E) The mean disease cumulative score. (F) H&E staining of representative spinal cord sections from mir223−/- mice and WT mice shows the infiltration of inflammatory cells in the white matter. (G) Luxol fast blue staining of intact myelin (blue) and demyelination (pink). The data are representative of at least 2 experiments with similar results.CC BY-NC-ND · PubMed Central
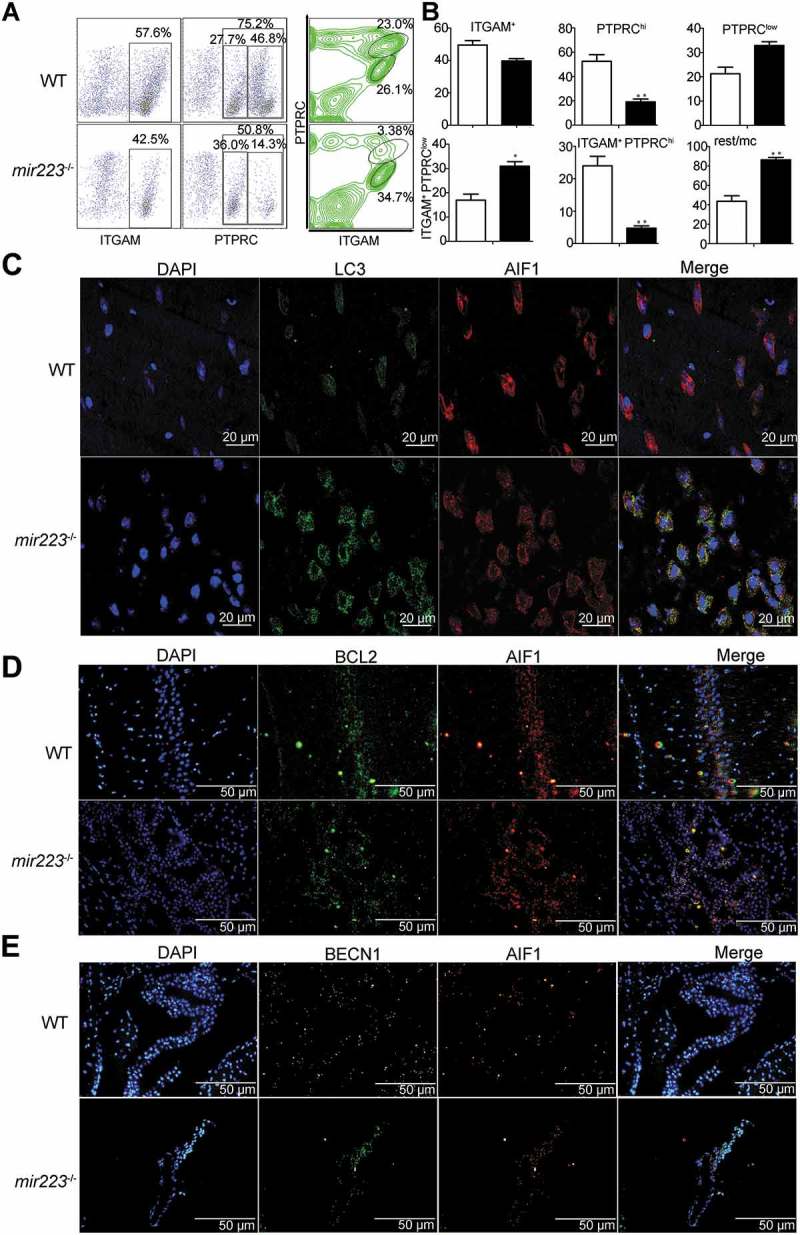
Figure 2. Mir223 deficiency increased autophagy and resting microglia in the brains of EAE mice. (A) Flow cytometric analysis of microglia, demonstrating PTPRC and ITGAM cells isolated from the CNS of EAE mice (n = 6 mice per group), detected on the 15th day after the induction of EAE. The data are shown in a representative plot. (B) The absolute numbers of the cell subpopulations are shown; the black column is for mir223−/- mice. Rest, ITGAM+ PTPRClow; mc, ITGAM+ PTPRChi and low. (C) Autophagy was measured in the brains of the mice. LC3 puncta were visualized by confocal imaging of microglia immunostained for LC3 and AIF1, followed by Alexa Fluor 488/555-conjugated secondary antibodies (green/red); nuclei were stained with DAPI. Representative images are shown. Scale bars: 20 µm. (D) and (E) BCL2 and BECN1 expression were visualized by fluorescence imaging of microglia. Scale bars: 50 µm.
Figure 2. Mir223 deficiency increased autophagy and resting microglia in the brains of EAE mice. (A) Flow cytometric analysis of microglia, demonstrating PTPRC and ITGAM cells isolated from the CNS of EAE mice (n = 6 mice per group), detected on the 15th day after the induction of EAE. The data are shown in a representative plot. (B) The absolute numbers of the cell subpopulations are shown; the black column is for mir223−/- mice. Rest, ITGAM+ PTPRClow; mc, ITGAM+ PTPRChi and low. (C) Autophagy was measured in the brains of the mice. LC3 puncta were visualized by confocal imaging of microglia immunostained for LC3 and AIF1, followed by Alexa Fluor 488/555-conjugated secondary antibodies (green/red); nuclei were stained with DAPI. Representative images are shown. Scale bars: 20 µm. (D) and (E) BCL2 and BECN1 expression were visualized by fluorescence imaging of microglia. Scale bars: 50 µm.CC BY-NC-ND · PubMed Central
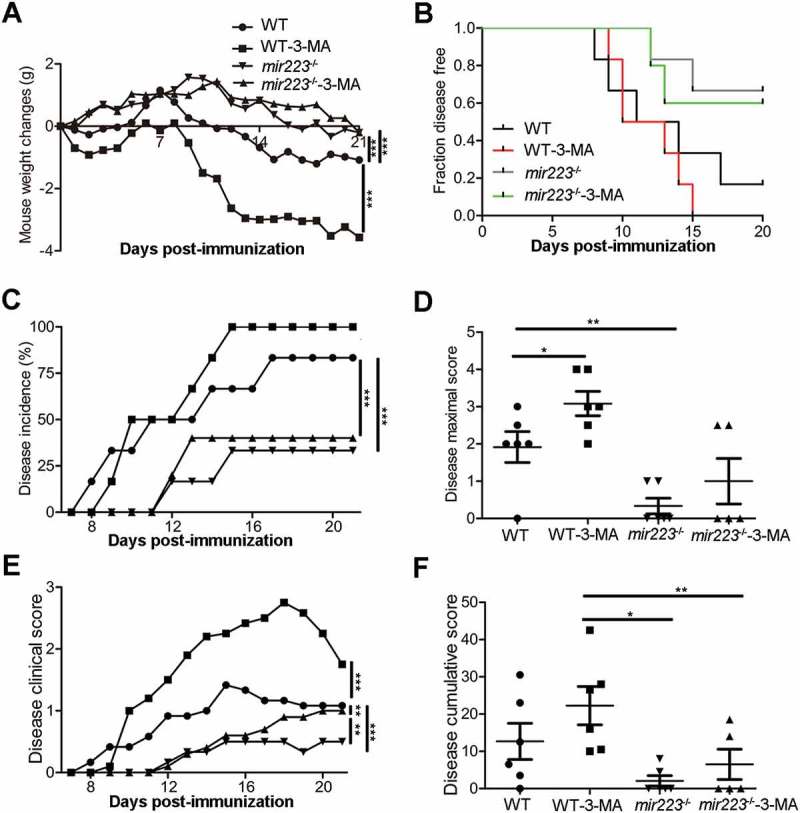
Figure 3. 3-MA-mediated blockade of autophagy attenuates the effects of Mir223 on EAE mice. EAE was induced with MOG[35–55] in female C57BL/6 mice (n = 12). Mice were injected with 3-MA every day after immunization. The body weight and clinical scores of all of the EAE mice were assessed daily according to the same criteria for 21 continuous days. Body weight (A), disease onset (B), incidence (C), peak disease scores (D), daily clinical scores (E), and cumulative disease scores (F) were monitored.
Figure 3. 3-MA-mediated blockade of autophagy attenuates the effects of Mir223 on EAE mice. EAE was induced with MOG[35–55] in female C57BL/6 mice (n = 12). Mice were injected with 3-MA every day after immunization. The body weight and clinical scores of all of the EAE mice were assessed daily according to the same criteria for 21 continuous days. Body weight (A), disease onset (B), incidence (C), peak disease scores (D), daily clinical scores (E), and cumulative disease scores (F) were monitored.CC BY-NC-ND · PubMed Central
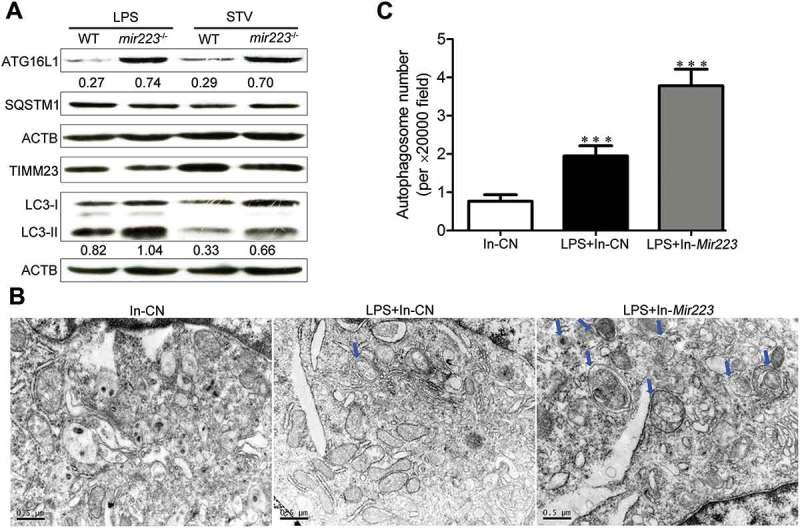
Figure 4. Mir223 deficiency increases autophagy in primary macrophages and BV2 cells. (A) Macrophages were separated from the bone marrow of WT mice and mir223−/- mice. The cells were stimulated with LPS or starvation. Immunoblot analysis was performed for ATG16L1, SQSTM1, TIMM23, LC3 and ACTB. ATG16L1:ACTB and LC3-II:ACTB ratios are shown below the blots. (B) Deficiency of Mir223 induces autophagic vacuoles in BV2 cells upon LPS stimulation. Scale bars: 0.5 µm. (C) Quantitative analysis of the number of autophagic vacuoles.
Figure 4. Mir223 deficiency increases autophagy in primary macrophages and BV2 cells. (A) Macrophages were separated from the bone marrow of WT mice and mir223−/- mice. The cells were stimulated with LPS or starvation. Immunoblot analysis was performed for ATG16L1, SQSTM1, TIMM23, LC3 and ACTB. ATG16L1:ACTB and LC3-II:ACTB ratios are shown below the blots. (B) Deficiency of Mir223 induces autophagic vacuoles in BV2 cells upon LPS stimulation. Scale bars: 0.5 µm. (C) Quantitative analysis of the number of autophagic vacuoles.CC BY-NC-ND · PubMed Central
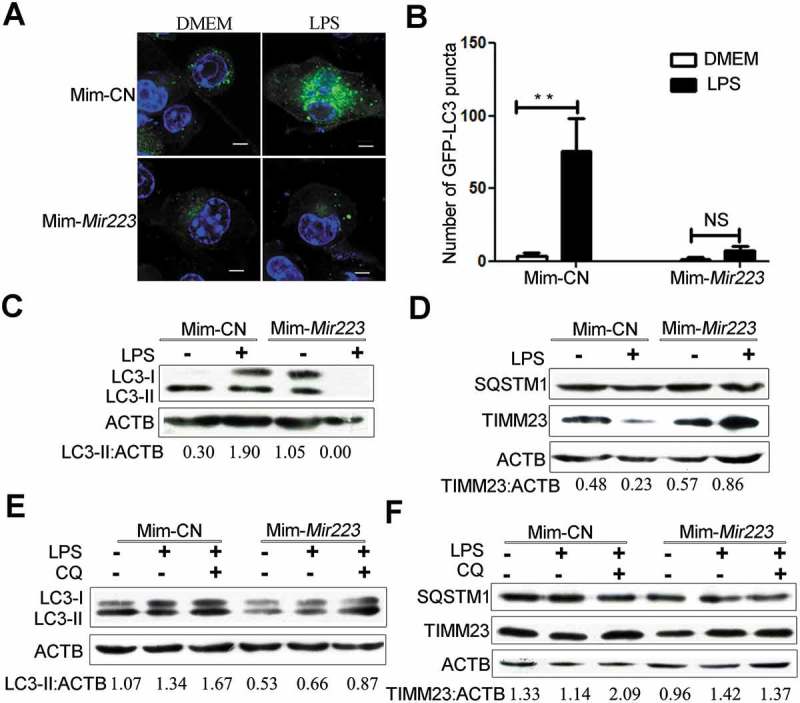
Figure 5. Overexpression of Mir223 blocks lipopolysaccharide-induced autophagy in BV2 cells. (A) Mir223 repressed the formation of starvation-induced GFP-LC3 puncta in BV2 cells. Stable GFP-LC3-expressing cells were cotransfected with mimics or Mim-CN, and autophagy was evaluated after LPS or control treatment for 4 h. Scale bar: 5 μm. (B) Quantitative analysis of the number of GFP-LC3 puncta per cell in (A). The data are presented as the mean± SEM; experiments were performed in triplicate (*p < 0.05, **p < 0.01; NS, not significant). (C) and (D) Western blot analysis of LC3, TIMM23, SQSTM1 and ACTB. (E and F) Autophagy was evaluated in the presence or absence of CQ with LPS or no LPS treatment for 4 h. Western blot analysis of LC3, TIMM23, SQSTM1 and ACTB. Densitometric ratios were quantified using ImageJ software. LC3-II:ACTB and TIMM23:ACTB ratios from immunoblots are shown from 3 independent experiments. ACTB was used as the loading control.
Figure 5. Overexpression of Mir223 blocks lipopolysaccharide-induced autophagy in BV2 cells. (A) Mir223 repressed the formation of starvation-induced GFP-LC3 puncta in BV2 cells. Stable GFP-LC3-expressing cells were cotransfected with mimics or Mim-CN, and autophagy was evaluated after LPS or control treatment for 4 h. Scale bar: 5 μm. (B) Quantitative analysis of the number of GFP-LC3 puncta per cell in (A). The data are presented as the mean± SEM; experiments were performed in triplicate (*p < 0.05, **p < 0.01; NS, not significant). (C) and (D) Western blot analysis of LC3, TIMM23, SQSTM1 and ACTB. (E and F) Autophagy was evaluated in the presence or absence of CQ with LPS or no LPS treatment for 4 h. Western blot analysis of LC3, TIMM23, SQSTM1 and ACTB. Densitometric ratios were quantified using ImageJ software. LC3-II:ACTB and TIMM23:ACTB ratios from immunoblots are shown from 3 independent experiments. ACTB was used as the loading control.CC BY-NC-ND · PubMed Central
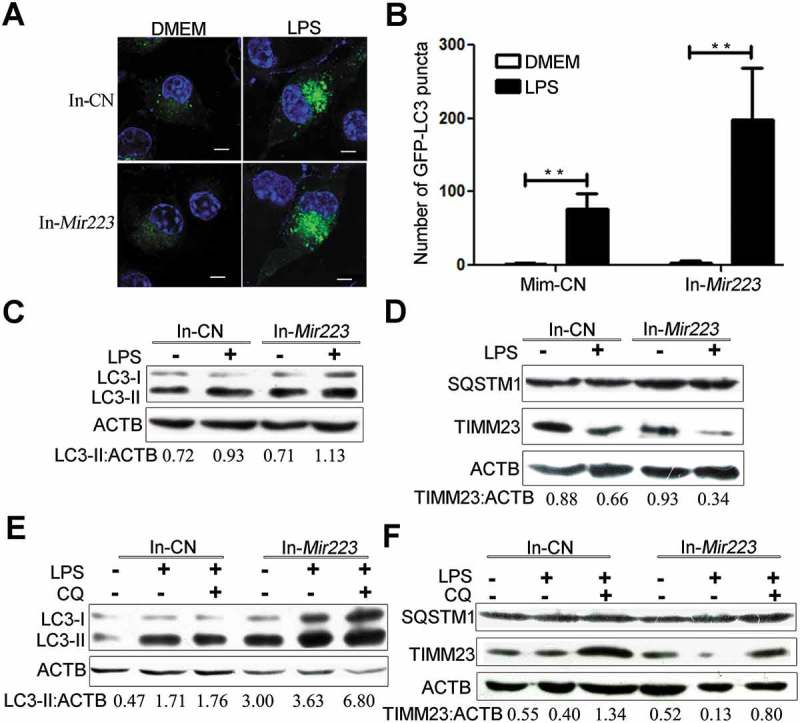
Figure 6. Inhibition of endogenous Mir223 increases autophagy upon LPS stimulation. (A) Mir223 repressed the formation of starvation-induced GFP-LC3 puncta in BV2 cells. Stable GFP-LC3-expressing cells were cotransfected with inhibitor (In-Mir223) or In-CN, and autophagy was tested after LPS or control treatment for 4 h. Scale bar: 5 μm. (B) Quantitative analysis of the number of GFP-LC3 puncta per cell in (A). The data are presented as the mean± SEM; experiments were performed in triplicate (*p < 0.05, **p < 0.01). (C and D) Western blot analysis of LC3, TIMM23, SQSTM1 and ACTB. (E and F) Autophagy was tested in the presence or absence of CQ with LPS or control treatment for 4 h. Western blot analysis of LC3, TIMM23, SQSTM1 and ACTB. Densitometric ratios were quantified using ImageJ software. LC3-II:ACTB and TIMM23:ACTB ratios from immunoblots are shown from 3 independent experiments. ACTB was used as the loading control.
Figure 6. Inhibition of endogenous Mir223 increases autophagy upon LPS stimulation. (A) Mir223 repressed the formation of starvation-induced GFP-LC3 puncta in BV2 cells. Stable GFP-LC3-expressing cells were cotransfected with inhibitor (In-Mir223) or In-CN, and autophagy was tested after LPS or control treatment for 4 h. Scale bar: 5 μm. (B) Quantitative analysis of the number of GFP-LC3 puncta per cell in (A). The data are presented as the mean± SEM; experiments were performed in triplicate (*p < 0.05, **p < 0.01). (C and D) Western blot analysis of LC3, TIMM23, SQSTM1 and ACTB. (E and F) Autophagy was tested in the presence or absence of CQ with LPS or control treatment for 4 h. Western blot analysis of LC3, TIMM23, SQSTM1 and ACTB. Densitometric ratios were quantified using ImageJ software. LC3-II:ACTB and TIMM23:ACTB ratios from immunoblots are shown from 3 independent experiments. ACTB was used as the loading control.CC BY-NC-ND · PubMed Central
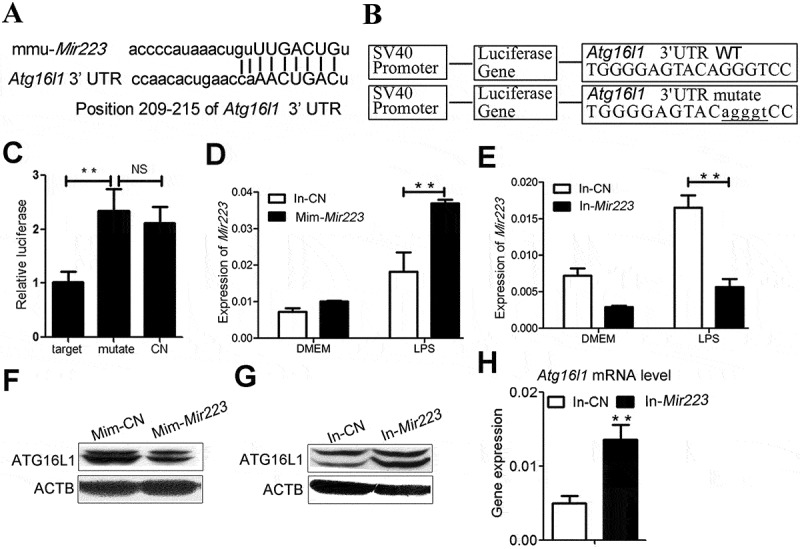
Figure 7. Atg16l1 as a direct target of Mir223. (A) The Mir223 target sequence in the 3’ UTR of Atg16l1 in mice. (B) A scheme representing the luciferase constructs with the wild-type (WT) or mutant 3’ UTR Mir223 MRE sequences of Atg16l1. Mutations are marked in lower-case letters and underlined. (C) Normalized luciferase activity in lysates from 293T cells co-transfected with wild-type or mutant Atg16l1-luciferase constructs and Mir223 mimics or Mim-CN (mean± SEM, n = 3, *p < 0.05, **p < 0.01). (D and E) BV2 cells were cotransfected with Mir223 Mim-CN, mimics, In-CN or inhibitor and starved for 4 h. Quantitative PCR (qPCR) analysis of Atg16l1 mRNA levels is shown. (F and G) BV2 cells were cotransfected with Mir223 Mim-CN, mimics, In-CN or inhibitor and starved for 4 h. The ATG16L1 protein level was tested by immunoblotting. ACTB was used as the loading control. (H) Quantitative PCR (qPCR) analysis of Atg16l1 mRNA levels in In-CN- or inhibitor-transfected BV2 cells. The data are expressed as the mean± SEM; experiments were performed in triplicate (*p < 0.05, **p < 0.01). The data were normalized to Gapdh mRNA.
Figure 7. Atg16l1 as a direct target of Mir223. (A) The Mir223 target sequence in the 3’ UTR of Atg16l1 in mice. (B) A scheme representing the luciferase constructs with the wild-type (WT) or mutant 3’ UTR Mir223 MRE sequences of Atg16l1. Mutations are marked in lower-case letters and underlined. (C) Normalized luciferase activity in lysates from 293T cells co-transfected with wild-type or mutant Atg16l1-luciferase constructs and Mir223 mimics or Mim-CN (mean± SEM, n = 3, *p < 0.05, **p < 0.01). (D and E) BV2 cells were cotransfected with Mir223 Mim-CN, mimics, In-CN or inhibitor and starved for 4 h. Quantitative PCR (qPCR) analysis of Atg16l1 mRNA levels is shown. (F and G) BV2 cells were cotransfected with Mir223 Mim-CN, mimics, In-CN or inhibitor and starved for 4 h. The ATG16L1 protein level was tested by immunoblotting. ACTB was used as the loading control. (H) Quantitative PCR (qPCR) analysis of Atg16l1 mRNA levels in In-CN- or inhibitor-transfected BV2 cells. The data are expressed as the mean± SEM; experiments were performed in triplicate (*p < 0.05, **p < 0.01). The data were normalized to Gapdh mRNA.CC BY-NC-ND · PubMed Central
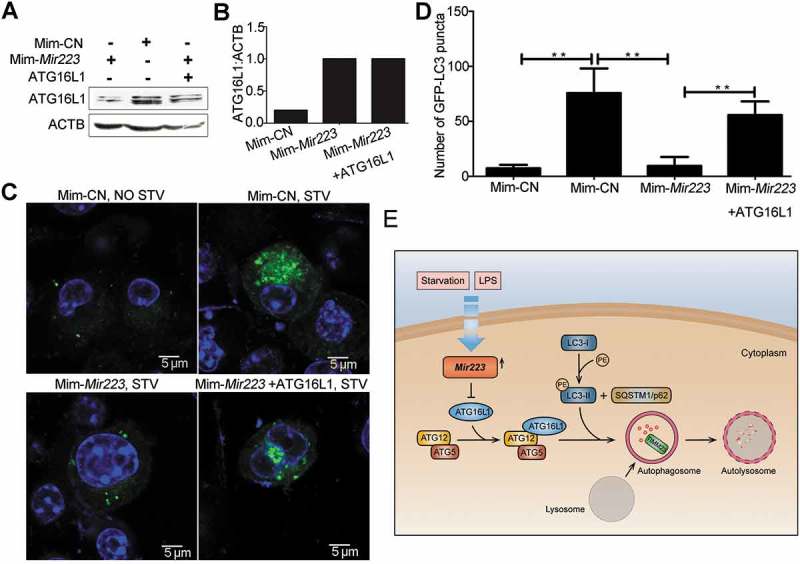
Figure 8. ATG16L1 protein overexpression abrogates Mir223-mediated autophagy suppression. BV2 cells were cotransfected with Mir223 mimics or Mim-CN and ATG16L1 expression plasmid lacking the Mir223 target region. (A) Cells were starved for 4 h. Immunoblot analysis of ATG16L1 and ACTB is shown. (B) ATG16L1:ACTB ratios. (C) Formation of GFP-LC3 puncta before or after starvation for 4 h. Scale bar: 5 μm. (D) Quantitative analysis of GFP-LC3 puncta (mean± SEM, n = 3, *p < 0.05, **p < 0.01). (E) Model of the effect of Mir223 regulation of autophagy through direct targeting of Atg16l1.
Figure 8. ATG16L1 protein overexpression abrogates Mir223-mediated autophagy suppression. BV2 cells were cotransfected with Mir223 mimics or Mim-CN and ATG16L1 expression plasmid lacking the Mir223 target region. (A) Cells were starved for 4 h. Immunoblot analysis of ATG16L1 and ACTB is shown. (B) ATG16L1:ACTB ratios. (C) Formation of GFP-LC3 puncta before or after starvation for 4 h. Scale bar: 5 μm. (D) Quantitative analysis of GFP-LC3 puncta (mean± SEM, n = 3, *p < 0.05, **p < 0.01). (E) Model of the effect of Mir223 regulation of autophagy through direct targeting of Atg16l1.CC BY-NC-ND · PubMed Central

Verification

Claims the paper makes

The claims and statistics of this paper haven’t been checked yet.

Run the check — free, no account needed. It reads the open-access text and checks the sources it cites.

A few free checks a day · papers already verified open instantly · results are public

Claims other papers make about this one

Each is checked against this paper’s own text: does it say what the citing paper says it does?

Self-check

Percentages, sums and reported differences re-computed from the paper’s own numbers.

The self-check needs the paper’s full text.

Citations

Cites

Show all 6 references

Research works printed but not linked: 50

  1. 10.1038/nrneurol.2012.168 · DOI · Paper page
  2. 10.1111/j.1476-5381.2012.01869.x · DOI
  3. 10.1155/2013/208093 · DOI
  4. 10.1016/S1474-4422(14)70101-2 · DOI
  5. 10.1007/s00401-013-1082-0 · DOI
  6. 10.1007/s12017-010-8112-z · DOI · Paper page
  7. 10.1007/s12264-015-1545-5 · DOI
  8. 10.1016/j.jneuroim.2015.01.012 · DOI
  9. Feng X, 2017, Bosnian J Med Sci, 17, 95
  10. 10.1111/jnc.14222 · DOI · Paper page
  11. 10.1016/j.bbrc.2011.06.117 · DOI
  12. 10.1101/gad.1599207 · DOI
  13. 10.1038/sj.onc.1207521 · DOI
  14. 10.1152/physrev.00030.2009 · DOI
  15. 10.1016/S1474-4422(07)70076-5 · DOI
  16. 10.1101/gad.17558811 · DOI
  17. 10.1016/j.cell.2011.07.030 · DOI · Paper page
  18. 10.1093/brain/awx005 · DOI
  19. 10.1111/cns.12024 · DOI
  20. 10.4049/jimmunol.1402277 · DOI · Paper page
  21. 10.1016/j.intimp.2015.04.018 · DOI
  22. 10.1038/cr.2010.82 · DOI
  23. Lemasters JJ, Rejuvenation Res. 2005 Spring, 8, 3
  24. 10.1083/jcb.151.2.263 · DOI
  25. 10.1074/jbc.M407016200 · DOI
  26. 10.1083/jcb.200507002 · DOI · Paper page
  27. 10.1016/j.biocel.2012.02.004 · DOI
  28. 10.4161/auto.19629 · DOI
  29. 10.1038/s41598-017-12067-2 · DOI
  30. 10.1016/j.jns.2017.11.014 · DOI
  31. 10.1007/s00401-016-1621-6 · DOI · Paper page
  32. 10.4161/auto.7.6.15448 · DOI
  33. 10.4062/biomolther.2012.089 · DOI
  34. 10.18632/oncotarget.9786 · DOI
  35. 10.1371/journal.pone.0055080 · DOI
  36. 10.1053/j.gastro.2013.09.006 · DOI
  37. 10.4161/auto.27553 · DOI
  38. 10.1016/j.lfs.2015.07.002 · DOI
  39. 10.1016/j.bone.2014.11.026 · DOI
  40. 10.3389/fcimb.2016.00134 · DOI
  41. 10.1016/j.cell.2011.10.026 · DOI
  42. 10.1146/annurev-immunol-020711-074948 · DOI
  43. 10.4161/auto.6.2.11137 · DOI · Paper page
  44. 10.4161/auto.8.2.18351 · DOI
  45. 10.1172/JCI67604 · DOI
  46. 10.1089/gtmb.2015.0090 · DOI
  47. 10.1111/cns.12349 · DOI
  48. 10.1080/15548627.2015.1052206 · DOI
  49. 10.1002/eji.201646375 · DOI
  50. 10.1038/nprot.2006.285 · DOI

Cited by

Sorted by citations

See all 152

Metadata

Authors
Li, Y., Zhou, D., Ren, Y., Zhang, Z., Guo, X., Ma, M., Xue, Z., Lv, J., Liu, H., Xi, Q., Jia, L., Zhang, L., Liu, Y., Zhang, Q., Yan, J., Da, Y., Gao, F., Yue, J., Yao, Z., & Zhang, R.
Affiliations
  • Laboratory of Immunology and Inflammation, Department of Immunology, Key Laboratory of Immune Microenvironment and Diseases of Educational Ministry of China, Tianjin Key Laboratory of Cellular and Molecular Immunology, Key Laboratory of Hormones and Development (Ministry of Health), Tianjin Medical University, Tianjin, China
  • Tianjin Key Laboratory of Lung Cancer Metastasis and Tumor Microenvironment, Tianjin Lung Cancer Institute, Tianjin Medical University General Hospital, Tianjin, China
  • Institute of Integrative Medicines for Acute Abdominal Diseases, Nankai Hospital, Tianjin, China
  • Tianjin Institute of Animal husbandry and veterinary, Tianjin, China
  • State Key Laboratory of Reproductive Biology, Institute of Zoology, Chinese Academy of Sciences, Beijing, China
  • Department of Biomedical Sciences, City University of Hong Kong, Hong Kong, China
Venue
Autophagy
Published
2018-09-22
Volume
15
Issue
3
Pages
478-492
ISSN
  • 1554-8627
  • 1554-8635
Cited by
152
References
6
Language
en
Funders
  • National Natural Science Foundation of China (31600730, 81602496, 81501036, 81301026, 81302568, 81541032)
  • Postdoctoral Foundation of China (2016M591396)
  • Science Foundation of Tianjin Medical University (2012KYQ11)
  • Natural Science Foundation of Tianjin (16JCYBJC24800, 16JCYBJC24600)

About these checks

Registry, retraction, Cites and statistics results are computed, not judged, with one exception: a printed reference that no index lists is read once by a model before it counts as a citation error. Claims are extracted by a model and kept only when their quote appears verbatim in the text; each cited source is then checked, with a model’s help, for whether it says what the claim relies on. Those verdicts can be wrong — read the claim’s quote and the cited source before relying on one.

Statistics and arithmetic are recomputed, not judged.

Confidence bands are shown only for fields calibrated on our annotated test set. None is calibrated yet, so no band is shown.

What counts as a claim ›How we measure confidence ›How we check this ›

Are you an author, or do you see a problem with this page? Request a review

How to cite

Cite CoChat for the checks on this page, and the paper for its own findings.

This page
CoChat. (2026). Citation check: Mir223 restrains autophagy and promotes CNS inflammation by targeting ATG16L1. https://app.cochat.ai/papers/10.1080/15548627.2018.1522467
The paper
Li, Y., Zhou, D., Ren, Y., Zhang, Z., Guo, X., Ma, M., Xue, Z., Lv, J., Liu, H., Xi, Q., Jia, L., Zhang, L., Liu, Y., Zhang, Q., Yan, J., Da, Y., Gao, F., Yue, J., Yao, Z., & Zhang, R. (2019). Mir223 restrains autophagy and promotes CNS inflammation by targeting ATG16L1. Autophagy. https://doi.org/10.1080/15548627.2018.1522467