

The DOI matches its Crossref record; 70 of the 70 references it cites were found in a registry or an index.
Gut Akkermansia muciniphila ameliorates metabolic dysfunction-associated fatty liver disease by regulating the metabolism of L-aspartate via gut-liver axis
Open accessAbstract
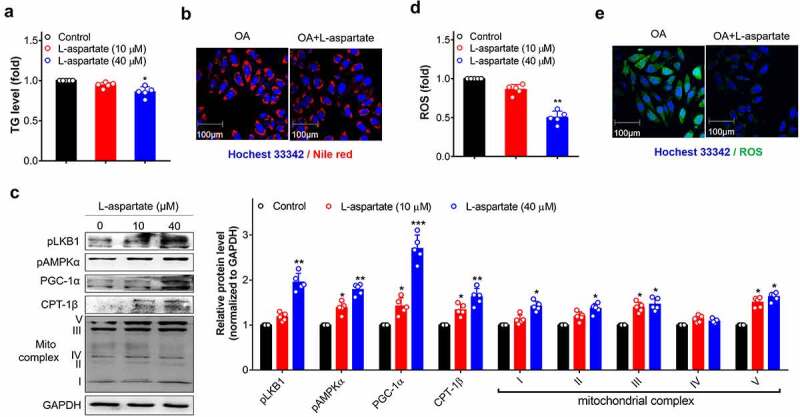
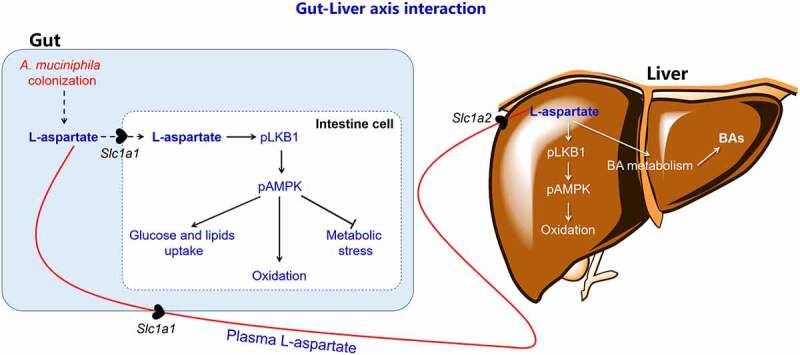
The gut bacterium Akkermansia muciniphila has been increasingly recognized for its therapeutic potential in treating metabolic disorders, including obesity, diabetes, and metabolicdysfunction-associated fatty liver disease (MAFLD). However, its underlying mechanism involved in its well-known metabolic actions needs further evaluation. The present study explored the therapeutic effect and mechanism of A. muciniphila in intervening MAFLD by using a high-fat and high-cholesterol (HFC) diet induced obese mice model. Mice treated with A. muciniphila efficiently reversed MAFLD in the liver, such as hepatic steatosis, inflammatory, and liver injury. These therapeutic effects persisted after long-term drug withdrawal and were slightly weakened in the antibiotics-treated obese mice. A. muciniphila treatment efficiently increased mitochondrial oxidation and bile acid metabolism in the gut-liver axis, ameliorated oxidative stress-induced cell apoptosis in gut, leading to the reshaping of the gut microbiota composition. These metabolic improvements occurred with increased L-aspartate levels in the liver that transported from the gut. The administration of L-aspartate in vitro or in mice displayed the similar beneficial metabolic effects mentioned above and efficiently ameliorated MAFLD. Together, these data indicate that the anti-MAFLD activity of A. muciniphila correlated with lipid oxidation and improved gut–liver interactions through regulating the metabolism of L-aspartate. A. muciniphila could be a potential agent for clinical intervention in MAFLD.
Overview
The claims and statistics of this paper haven’t been checked yet.
Run the check — free, no account needed. It reads the open-access text and checks the sources it cites.
Integrity signals
Registry
Cites
Statistics
Figures
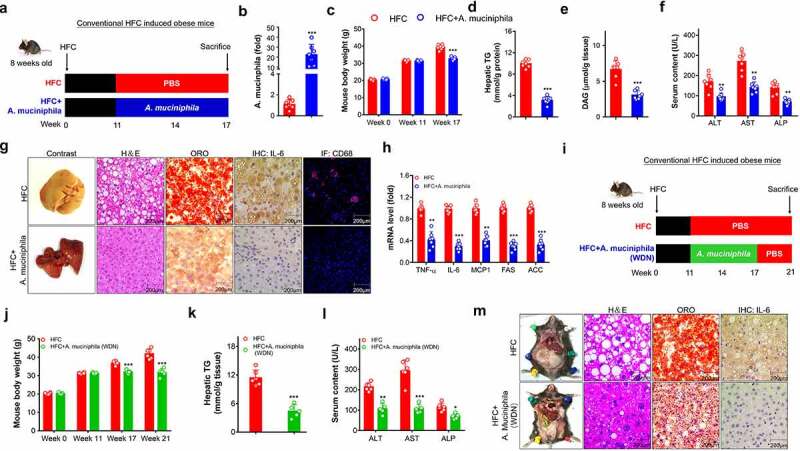
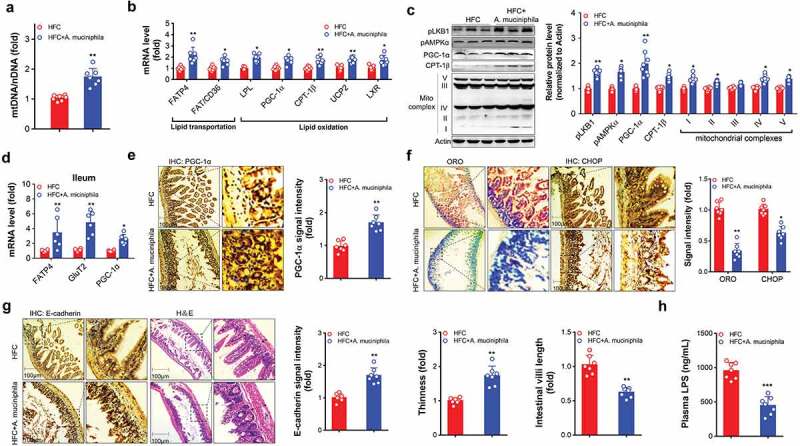
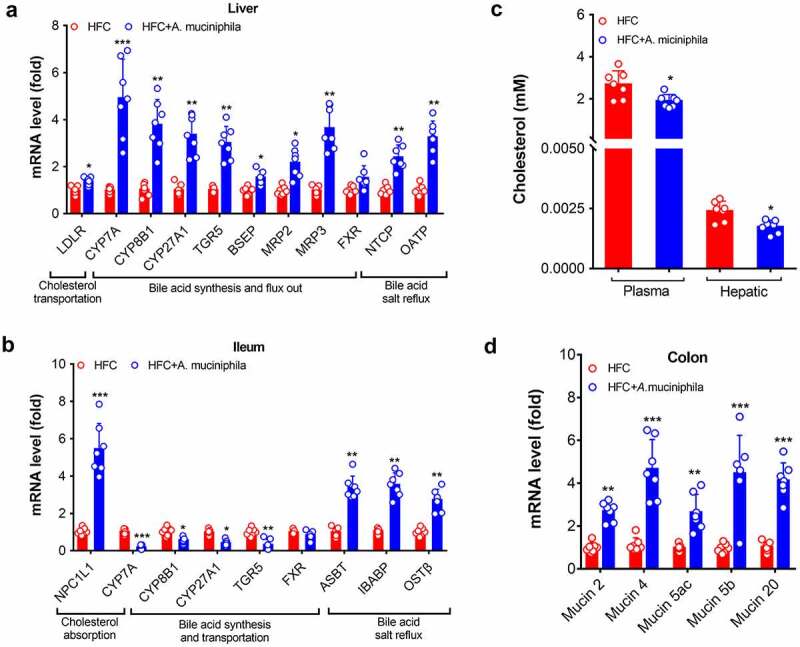
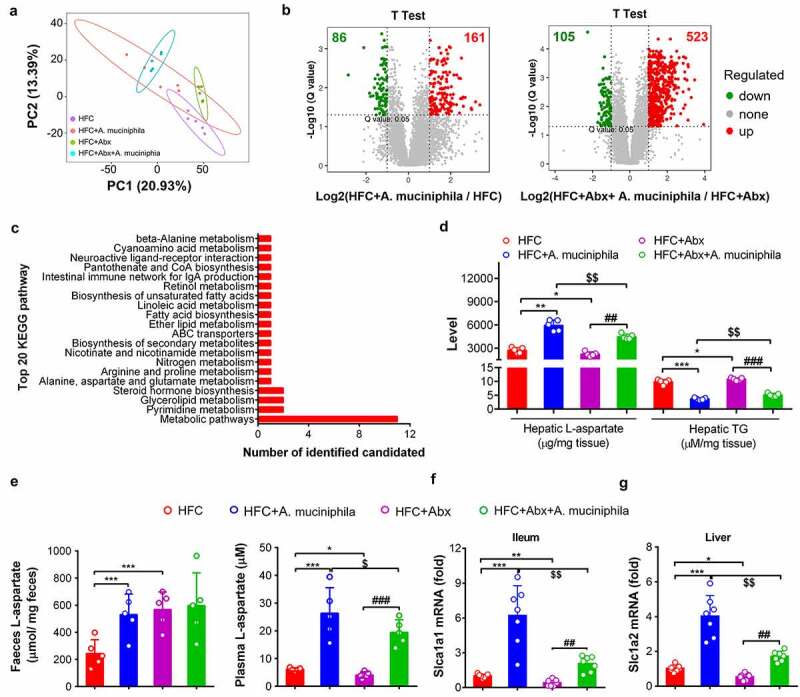
Verification
Claims the paper makes
The claims and statistics of this paper haven’t been checked yet.
Run the check — free, no account needed. It reads the open-access text and checks the sources it cites.
Claims other papers make about this one
Each is checked against this paper’s own text: does it say what the citing paper says it does?
The source backs part of the claim, not all of it — or backs it for a different population, condition or comparison.
In the citing paper
“Recent research found that A. muciniphila increases mitochondrial oxidation and bile acid metabolism in the gut–liver axis, leading to the reshaping of gut microbiota (Rao et al., 2021).”
From Akkermansia muciniphila alleviates high‐fat‐diet ‐related metabolic‐associated fatty liver disease by modulating gut microbiota and bile acids (2023) · cites this paper as Rao et al., 2021
Experimental — accuracy not yet measured
Self-check
Percentages, sums and reported differences re-computed from the paper’s own numbers.
The self-check needs the paper’s full text.
Citations
Cites
Trimmomatic: a flexible trimmer for Illumina sequence data
Bolger, A. M., Lohse, M., & Usadel, B. (2014) · Bioinformatics · doi:10.1093/bioinformatics/btu170 · Cited by 65,548
Cross-talk between Akkermansia muciniphila and intestinal epithelium controls diet-induced obesity
Everard, A., Belzer, C., Geurts, L., Ouwerkerk, J. P., Druart, C., Bindels, L. B., Guiot, Y., Derrien, M., Muccioli, G. G., Delzenne, N. M., et al. (2013) · Proceedings of the National Academy of Sciences · doi:10.1073/pnas.1219451110 · Cited by 4,511
Mechanisms of NAFLD development and therapeutic strategies
Friedman, S. L., Neuschwander-Tetri, B. A., Rinella, M., & Sanyal, A. J. (2018) · Nature Medicine · doi:10.1038/s41591-018-0104-9 · Cited by 4,354
Animal research: Reporting in vivo experiments: The ARRIVE guidelines
Kilkenny, C., Browne, W., Cuthill, I. C., Emerson, M., & Altman, D. G. (2010) · British Journal of Pharmacology · doi:10.1111/j.1476-5381.2010.00872.x · Cited by 3,625
Byrne, C. D., & Targher, G. (2015) · Journal of Hepatology · doi:10.1016/j.jhep.2014.12.012 · Cited by 3,162
Intestinal Crosstalk between Bile Acids and Microbiota and Its Impact on Host Metabolism
Wahlstrom, A. M., Sayin, S. I., Marschall, H., & Bäckhed, F. (2016) · Cell Metabolism · doi:10.1016/j.cmet.2016.05.005 · Cited by 2,969
Depommier, C., Everard, A., Druart, C., Plovier, H., Van Hul, M., Vieira-Silva, S., Falony, G., Raes, J., Maiter, D., Delzenne, N. M., et al. (2019) · Nature Medicine · doi:10.1038/s41591-019-0495-2 · Cited by 2,357
Plovier, H., Everard, A., Druart, C., Depommier, C., Van Hul, M., Geurts, L., Chilloux, J., Ottman, N., Duparc, T., Lichtenstein, L., et al. (2017) · Nature Medicine · doi:10.1038/nm.4236 · Cited by 2,204
The gut-liver axis in liver disease: Pathophysiological basis for therapy
Albillos, A., de Gottardi, A., & Rescigno, M. (2020) · Journal of Hepatology · doi:10.1016/j.jhep.2019.10.003 · Cited by 2,166
Animal Research: Reporting in vivo Experiments—The ARRIVE Guidelines
Kilkenny, C., Browne, W., Cuthill, I. C., Emerson, M., & Altman, D. G. (2011) · Journal of Cerebral Blood Flow & Metabolism · doi:10.1038/jcbfm.2010.220 · Cited by 2,012
Cited by
Sorted by citations
Gut symbionts alleviate MASH through a secondary bile acid biosynthetic pathway
Nie, Q., Luo, X., Wang, K., Ding, Y., Jia, S., Zhao, Q., Li, M., Zhang, J., Zhuo, Y., Lin, J., et al. (2024) · Cell · doi:10.1016/j.cell.2024.03.034 · Cited by 356
Jia, B., Zou, Y., Han, X., Bae, J., & Jeon, C. O. (2022) · Trends in Microbiology · doi:10.1016/j.tim.2022.08.003 · Cited by 220
The Role of Gut–Liver Axis in Gut Microbiome Dysbiosis Associated NAFLD and NAFLD-HCC
Song, Q., & Zhang, X. (2022) · Biomedicines · doi:10.3390/biomedicines10030524 · Cited by 154
Yan, J., Pan, Y., Shao, W., Wang, C., Wang, R., He, Y., Zhang, M., Wang, Y., Li, T., Wang, Z., et al. (2022) · Microbiome · doi:10.1186/s40168-022-01390-0 · Cited by 150
Wu, W., Kaicen, W., Bian, X., Yang, L., Ding, S., Li, Y., Li, S., Zhuge, A., & Li, L. (2023) · Microbial Biotechnology · doi:10.1111/1751-7915.14293 · Cited by 129
Revisiting the role of Akkermansia muciniphila as a therapeutic bacterium
Si, J., Kang, H., You, H. J., & Ko, G. (2022) · Gut Microbes · doi:10.1080/19490976.2022.2078619 · Cited by 130
Li, H., Huang, S., Zhou, D.-D., Xiong, R.-G., Luo, M., Saimaiti, A., Han, M.-K., Gan, R., Zhu, H., & Li, H. (2023) · Journal of Advanced Research · doi:10.1016/j.jare.2023.01.008 · Cited by 125
Yang, X., Zhang, M., Liu, Y., Wei, F., Li, X., Feng, Y., Jin, X., Liu, D., Guo, Y., & Hu, Y. (2023) · npj Biofilms and Microbiomes · doi:10.1038/s41522-023-00451-y · Cited by 112
Self-citationAkkermansia muciniphila plays critical roles in host health
Zhao, Q., Yu, J., Hao, Y., Zhou, H., Hu, Y., Zhang, C., Zheng, H., Wang, X., Zeng, F., Hu, J., et al. (2022) · Critical Reviews in Microbiology · doi:10.1080/1040841x.2022.2037506 · Cited by 102
Self-citationZhuge, A., Li, S., Lou, P., Wu, W., Wang, K., Yuan, Y., Xia, J., Li, B., & Li, L. (2022) · Microbiology Spectrum · doi:10.1128/spectrum.00047-22 · Cited by 100
Akkermansia muciniphila: A key player in gut microbiota-based disease modulation
Shaheen, N., Khursheed, W., Gurung, B., & Wang, S. (2025) · Microbiological Research · doi:10.1016/j.micres.2025.128317 · Cited by 104
Akkermansia muciniphila: a potential candidate for ameliorating metabolic diseases
Niu, H., Zhou, M., Zogona, D., Xing, Z., Wu, T., Chen, R., Cui, D., Liang, F., & Xu, X. (2024) · Frontiers in Immunology · doi:10.3389/fimmu.2024.1370658 · Cited by 112
Role of Akkermansia in Human Diseases: From Causation to Therapeutic Properties
Pellegrino, A., Coppola, G., Santopaolo, F., Gasbarrini, A., & Ponziani, F. R. (2023) · Nutrients · doi:10.3390/nu15081815 · Cited by 107
Gut microbiota and metabolic biomarkers in metabolic dysfunction–associated steatotic liver disease
Long, Q., Luo, F., Li, B., Li, Z., Guo, Z., Chen, Z., Wu, W., & Hu, M. (2024) · Hepatology Communications · doi:10.1097/hc9.0000000000000310 · Cited by 99
Zhuge, A., Li, S., Han, S., Yuan, Y., Shen, J., Wu, W., Wang, K., Xia, J., Wang, Q., Gu, Y., et al. (2024) · Acta Pharmaceutica Sinica B · doi:10.1016/j.apsb.2024.10.010 · Cited by 97
PGAM1 Inhibition Promotes HCC Ferroptosis and Synergizes with Anti‐PD‐1 Immunotherapy
Zheng, Y.-M., Wang, Y., Zhou, L., Wan, J., Jiang, L., Song, D., Wei, C., Gao, C., Shi, G., Zhou, J., et al. (2023) · Advanced Science · doi:10.1002/advs.202301928 · Cited by 92
A distinct microbiota signature precedes the clinical diagnosis of hepatocellular carcinoma
Yang, J., He, Q., Lü, F., Chen, K., Ni, Z., Wang, H., Zhou, C., Zhang, Y., Chen, B., Bo, Z., et al. (2023) · Gut Microbes · doi:10.1080/19490976.2023.2201159 · Cited by 96
Bile acids-gut microbiota crosstalk contributes to the improvement of type 2 diabetes mellitus
Gao, R., Meng, X., Xue, Y., Mao, M., Liu, Y., Tian, X., Sui, B., Li, X., & Zhang, P. (2022) · Frontiers in Pharmacology · doi:10.3389/fphar.2022.1027212 · Cited by 86
Mitochondrial Dysfunction in Metabolic Dysfunction Fatty Liver Disease (MAFLD)
Zhao, Y., Zhou, Y., Wang, D., Huang, Z., Xiao, X., Zheng, Q., Li, S., Long, D., & Feng, L. (2023) · International Journal of Molecular Sciences · doi:10.3390/ijms242417514 · Cited by 89
Self-citationLi, Y., Zhao, D., Qian, M., Liu, J., Pan, C., Zhang, X., Duan, X., Zhang, Y., Jia, W., & Wang, L. (2021) · British Journal of Pharmacology · doi:10.1111/bph.15768 · Cited by 82
Self-citationWang, C., Wei, S., Liu, B., Wang, F., Lu, Z., Jin, M., & Wang, Y. (2022) · Gut Microbes · doi:10.1080/19490976.2022.2057779 · Cited by 81
Zhang, L. R., Wang, Y., Wu, F., Wang, X., Feng, Y., & Wang, Y. (2021) · International Journal of Biological Macromolecules · doi:10.1016/j.ijbiomac.2021.12.036 · Cited by 73
Gut microbes in metabolic disturbances. Promising role for therapeutic manipulations?
Portincasa, P., Khalil, M., Graziani, A., Frühbeck, G., Baffy, G., Garruti, G., Ciaula, A. D., & Bonfrate, L. (2023) · European Journal of Internal Medicine · doi:10.1016/j.ejim.2023.10.002 · Cited by 78
Function of Akkermansia muciniphila in type 2 diabetes and related diseases
Li, J., Yang, G., Zhang, Q., Liu, Z., Jiang, X. M., & Xin, Y. (2023) · Frontiers in Microbiology · doi:10.3389/fmicb.2023.1172400 · Cited by 73
Navashenaq, J. G., Shabgah, A. G., Banach, M., Jamialahmadi, T., Penson, P. E., Johnston, T. P., & Sahebkar, A. (2021) · Seminars in Cancer Biology · doi:10.1016/j.semcancer.2021.09.014 · Cited by 67
Depommier, C., Everard, A., Druart, C., Maiter, D. M., Thissen, J., Loumaye, A., Hermans, M. P., Delzenne, N. M., de Vos, W. M., & Cani, P. D. (2021) · Gut Microbes · doi:10.1080/19490976.2021.1994270 · Cited by 59
Iqbal, M., Qian, Y., Tang, J., & Xiang, J. (2025) · Journal of Bacteriology · doi:10.1128/jb.00479-24 · Cited by 72
Native and Engineered Probiotics: Promising Agents against Related Systemic and Intestinal Diseases
Shen, H., Zhao, Z., Zhao, Z., Chen, Y., & Zhang, L. (2022) · International Journal of Molecular Sciences · doi:10.3390/ijms23020594 · Cited by 55
Depletion of Gut Microbiota Inhibits Hepatic Lipid Accumulation in High-Fat Diet-Fed Mice
Han, H. L., Wang, M., Zhong, R., Yi, B., Schroyen, M., & Zhang, H. (2022) · International Journal of Molecular Sciences · doi:10.3390/ijms23169350 · Cited by 52
Tingler, A. M., & Engevik, M. A. (2025) · Infection and Immunity · doi:10.1128/iai.00503-24 · Cited by 58
Nian, F., Wu, L., Xia, Q., Tian, P., Ding, C., & Lu, X. (2023) · Journal of Clinical and Translational Hepatology · doi:10.14218/jcth.2022.00415 · Cited by 49
Lian, W., Wang, F., Chen, Y., Tsai, M., Chao, H., Jahr, H., Wu, R., & Ko, J. (2022) · Biomedicines · doi:10.3390/biomedicines10040860 · Cited by 46
Hamamah, S., Iatcu, O. C., & Covașă, M. (2024) · Nutrients · doi:10.3390/nu17010143 · Cited by 52
Li, T., Lin, X., Shen, B., Zhang, W., Liu, Y., Liu, H., Wang, Y., Zheng, L., & Zhi, F. (2022) · Frontiers in Immunology · doi:10.3389/fimmu.2022.1047570 · Cited by 43
Health and Disease:Akkermansia muciniphila, the Shining Star of the Gut Flora
Xue, C., Li, G., Gu, X., Su, Y., Zheng, Q., Yuan, X. H., Bao, Z., Lu, J., & Li, L. (2023) · Research · doi:10.34133/research.0107 · Cited by 43
Zhang, L. R., Zheng, Z., Huang, H., Fu, Y., Chen, T., Liu, C., Yi, Q., Lin, C., Zeng, Y., Ou, Q., et al. (2024) · Gut Microbes · doi:10.1080/19490976.2024.2323236 · Cited by 43
Network mapping of root–microbe interactions in Arabidopsis thaliana
He, X., Zhang, Q., Li, B., Jin, Y., Jiang, L., & Wu, R. (2021) · npj Biofilms and Microbiomes · doi:10.1038/s41522-021-00241-4 · Cited by 45
Han, Y., Li, L., & Wang, B. (2022) · Frontiers of Medicine · doi:10.1007/s11684-022-0960-z · Cited by 43
Khalili, L., Nagpal, R., Park, G., & Salazar, G. (2024) · Microorganisms · doi:10.1016/j.cdnut.2024.102205 · Cited by 49
Gut microbiome and metabolome signatures in liver cirrhosis-related complications
Sharma, S. P., Gupta, H., Kwon, G.-H., Lee, S., Song, S. H., Kim, J. S., Park, J. H., Kim, M. J., Yang, D., Park, H., et al. (2024) · Clinical and Molecular Hepatology · doi:10.3350/cmh.2024.0349 · Cited by 42
Luo, X., Wang, K., & Jiang, C. (2025) · Cell Host & Microbe · doi:10.1016/j.chom.2025.04.020 · Cited by 41
The role of hypoxia-inducible factor 1α in hepatic lipid metabolism
Luo, M., Li, T., & Sang, H. (2023) · Journal of Molecular Medicine · doi:10.1007/s00109-023-02308-5 · Cited by 42
Groenewegen, B., Ruissen, M. M., Crossette, E. M., Menon, R., Prince, A., Norman, J. M., Ballieux, B. E. P. B., Lamb, H. J., Terveer, E. M., Keller, J. J., et al. (2025) · Gut Microbes · doi:10.1080/19490976.2025.2541035 · Cited by 42
Association of Gut Microbiota With Intestinal Ischemia/Reperfusion Injury
Chen, J., Wang, Y., Shi, Y., Liu, Y., Wu, C., & Luo, Y. (2022) · Frontiers in Cellular and Infection Microbiology · doi:10.3389/fcimb.2022.962782 · Cited by 37
Lin, H., Guo, Q., Ran, Y., Lin, L., Chen, P., He, J., Chen, Y., & Wen, J. (2021) · Frontiers in Microbiology · doi:10.3389/fmicb.2021.752102 · Cited by 37
Sun, L., Tan, X., Liang, X., Chen, H., Ou, Q., Wu, Q., Yu, X., Zhao, H., Huang, Q., Yi, Z., et al. (2023) · Nutrients · doi:10.3390/nu15020284 · Cited by 36
Gut microbiota-mediated modulation of host amino acid availability and metabolism
Han, Z., Zhao, L., Hu, Q., Hung, I., Liu, C., Liu, S., Mei, X., Zeng, X., Bin, P., & Wang, J. (2025) · Gut Microbes · doi:10.1080/19490976.2025.2552345 · Cited by 44
Pei, T., Hu, R., Wang, F., Yang, S., Feng, H., Li, Q., Zhang, J., Yan, S., Ju, L., He, Z., et al. (2022) · Microbial Pathogenesis · doi:10.1016/j.micpath.2022.105891 · Cited by 38
Xu, M.-Y., Guo, C.-C., Li, M., Lou, Y.-H., Chen, Z., Liu, B., & Lan, L. (2022) · Frontiers in Cellular and Infection Microbiology · doi:10.3389/fcimb.2022.1040749 · Cited by 35
Tong, A., Wu, W., Chen, Z., Wen, J., Jia, R., Liu, B., Cao, H., & Zhao, C. (2022) · Current Research in Food Science · doi:10.1016/j.crfs.2022.100427 · Cited by 35
Unraveling the Gut–Liver–Brain Axis: Microbiome, Inflammation, and Emerging Therapeutic Approaches
Aghara, H., Patel, M., Chadha, P., Parwani, K., Chaturvedi, R., & Mandal, P. (2025) · Mediators of Inflammation · doi:10.1155/mi/6733477 · Cited by 39
Ge, Z., Chen, C., Chen, J., Zhou, J., Chen, L., Wei, Y., Chen, H., He, L., Zou, Y., Long, X., et al. (2024) · Advanced Science · doi:10.1002/advs.202306217 · Cited by 38
Self-citationCrucial functions of gut microbiota on gut–liver repair
Wang, Y., Yan, H., Zheng, Q., & Sun, X. (2025) · hLife · doi:10.1016/j.hlife.2025.01.001 · Cited by 39
The role of Akkermansia muciniphila in maintaining health: a bibliometric study
Gao, F., Cheng, C., Li, R., Chen, Z., Tang, K., & Du, G. (2025) · Frontiers in Medicine · doi:10.3389/fmed.2025.1484656 · Cited by 38
Bacterial extracellular vesicles for gut microbiome–host communication and drug development
Qian, D., Xu, P., Wang, X., Du, C., Zhao, X., & Xu, J. (2025) · Acta Pharmaceutica Sinica B · doi:10.1016/j.apsb.2025.03.008 · Cited by 36
Wang, Y., Wang, X., Chen, Z., Zheng, J., Liu, X., Zheng, Y., Zheng, Z., Xu, Z., Zhang, Y., Chen, K., et al. (2025) · The ISME Journal · doi:10.1093/ismejo/wraf084 · Cited by 34
Self-citationMolecular Aspects of MAFLD—New Insights on Pathogenesis and Treatment
Filipović, B. F., Marjanovic-Haljilji, M., Mijac, D. D., Lukić, S., Kapor, S., Kapor, S., Starčević, A., Popovic, D. D., & Djoković, A. (2023) · Current Issues in Molecular Biology · doi:10.3390/cimb45110573 · Cited by 34
Zhang, Y., Li, M., Pu, Z., Chi, X., & Yang, J. (2023) · Ecotoxicology and Environmental Safety · doi:10.1016/j.ecoenv.2023.115182 · Cited by 32
Zhang, C., Bao, F., Wang, F., Xue, Z., & Lin, D. (2024) · The Science of The Total Environment · doi:10.1016/j.scitotenv.2024.170011 · Cited by 36
Pei, T., Zhu, D., Yang, S., Hu, R., Wang, F., Zhang, J., Yan, S., Ju, L., He, Z., Han, Z., et al. (2022) · Journal of Cellular and Molecular Medicine · doi:10.1111/jcmm.17626 · Cited by 35
Pectin in Metabolic Liver Disease
Hu, W., Cassard, A., & Ciocan, D. M. (2022) · Nutrients · doi:10.3390/nu15010157 · Cited by 34
Liu, S., Yin, R., Yang, Z., Wei, F., & Hu, J. (2022) · Frontiers in Immunology · doi:10.3389/fimmu.2022.971409 · Cited by 33
Gut microbiota, immunity, and bile acid metabolism: decoding metabolic disease interactions
Zhao, Q., Wu, J., Ding, Y., Pang, Y., & Jiang, C. (2023) · Life Metabolism · doi:10.1093/lifemeta/load032 · Cited by 31
Zhang, F.-L., Yang, Y., Zhang, Z., Yao, Y., Xia, R., Gao, C., Du, D., Hu, J., Ran, C., Liu, Z., et al. (2021) · Frontiers in Nutrition · doi:10.3389/fnut.2021.726108 · Cited by 32
Therapeutic modulation of the liver immune microenvironment
Tilg, H., Adolph, T. E., & Tacke, F. (2023) · Hepatology · doi:10.1097/hep.0000000000000386 · Cited by 32
Gu, C., Zhou, Z., Yu, Z., He, M., He, L., Luo, Z., Xiao, W., Yang, Q., Zhao, F., Li, W., et al. (2022) · Frontiers in Cellular and Infection Microbiology · doi:10.3389/fcimb.2022.870785 · Cited by 31
The role of microbiomes in gastrointestinal cancers: new insights
Yarahmadi, A., & Afkhami, H. (2024) · Frontiers in Oncology · doi:10.3389/fonc.2023.1344328 · Cited by 30
Role of Akkermansia muciniphila in insulin resistance
Zeng, Z., Chen, M., Liu, Y., Zhou, Y., Liu, H., Wang, S., & Ji, Y. (2024) · Journal of Gastroenterology and Hepatology · doi:10.1111/jgh.16747 · Cited by 30
Li, D., Qian, H., Yang, H., Du, Y., Yu, K., Yang, J., Tong, X., Guo, Y., Xu, J., & Qin, L. (2021) · Molecular Nutrition & Food Research · doi:10.1002/mnfr.202100253 · Cited by 29
Chen, Q., Zhao, L., Mei, L., Zhao, X., Han, P., Liu, J., Meng, C., Li, R., Zhong, R., Wang, K., et al. (2023) · Frontiers in Pharmacology · doi:10.3389/fphar.2023.1163694 · Cited by 29
Keane, J. M., Heras, V. L., Pinheiro, J. C., FitzGerald, J. A., Núñez‐Sánchez, M. Á., Hueston, C. M., O’Mahony, L., Cotter, P. D., Hill, C., Melgar, S., et al. (2023) · Gut Microbes · doi:10.1080/19490976.2023.2229948 · Cited by 29
Gut microbiota: Candidates for a novel strategy for ameliorating sleep disorders
Li, L., Liang, T., Jiang, T., Li, Y., Yang, L., Wu, L., Yang, J., Ding, Y., Wang, J., Chen, M., et al. (2023) · Critical Reviews in Food Science and Nutrition · doi:10.1080/10408398.2023.2228409 · Cited by 31
Jiang, T., Li, Y., Li, L., Liang, T., Du, M., Yang, L., Yang, J., Yang, R., Zhao, H., Chen, M., et al. (2022) · Nutrients · doi:10.3390/nu14194050 · Cited by 30
Akkermansia muciniphila: The state of the art, 18 years after its first discovery
Iwaza, R., Wasfy, R. M., Dubourg, G., Raoult, D., & Lagier, J. (2022) · Frontiers in Gastroenterology · doi:10.3389/fgstr.2022.1024393 · Cited by 32
Utility of Human Relevant Preclinical Animal Models in Navigating NAFLD to MAFLD Paradigm
Chua, D., Low, Z. S., Cheam, G. X., Ng, A. S., & Tan, N. S. (2022) · International Journal of Molecular Sciences · doi:10.3390/ijms232314762 · Cited by 30
Xiao, L., Xiong, H., Deng, Z., Peng, X. X., Cheng, K., Zhang, H., Jiang, L., & Sun, Y. (2022) · Food & Function · doi:10.1039/d2fo03028d · Cited by 28
Wei, S., Wen, R., Liu, T., Zhou, L., Wang, G., Dai, X., & Shi, L. S. (2023) · The Journal of Nutritional Biochemistry · doi:10.1016/j.jnutbio.2023.109553 · Cited by 28
The gut-liver axis in fatty liver disease: role played by natural products
Ming, Z., Ruishi, X., Linyi, X., Yonggang, Y., Haoming, L., & Lan, X. (2024) · Frontiers in Pharmacology · doi:10.3389/fphar.2024.1365294 · Cited by 27
Luo, Z., Huang, Y., Yong, K., Wu, D., Zheng, L., Yao, X., Shen, L., Yu, S., Wang, B., & Cao, S. (2025) · Gut Microbes · doi:10.1080/19490976.2025.2496437 · Cited by 28
Yin, X.-Q., An, Y.-X., Yu, C.-G., Ke, J., Zhao, D., & Yu, K. (2022) · Diabetes Metabolic Syndrome and Obesity · doi:10.2147/dmso.s338113 · Cited by 27
Self-citationWang, J., Xiang, Q., Gu, S., Gu, Y., Yao, M., Huang, W., Wang, G., & Tang, L. (2022) · Infection and Drug Resistance · doi:10.2147/idr.s388687 · Cited by 29
Li, M., Cheng, D., Peng, C., Huang, Y., Geng, J., Huang, G., Wang, T., & Xu, A. (2023) · Chinese Medicine · doi:10.1186/s13020-023-00752-6 · Cited by 28
Wang, S., Xiong, L., Ruan, Z., Gong, X., Luo, Y., Wu, C., Wang, Y., Shang, H. F., & Chen, J. (2023) · Molecular Medicine · doi:10.1186/s10020-023-00658-x · Cited by 27
Monti, E., Vianello, C., Leoni, I., Galvani, G., Lippolis, A., D’Amico, F., Roggiani, S., Stefanelli, C., Turroni, S., & Fornari, F. (2025) · Cells · doi:10.3390/cells14020084 · Cited by 28
Reconsidering Meat Intake and Human Health: A Review of Current Research
Xie, Y., Ma, Y., Cai, L., Jiang, S., & Li, C. (2022) · Molecular Nutrition & Food Research · doi:10.1002/mnfr.202101066 · Cited by 26
Self-citationGut Microbiome and Serum Metabolome Profiles of Capsaicin with Cognitive Benefits in APP/PS1 Mice
Li, J., Liao, X., Yin, X., Deng, Z., Hu, G., Zhang, W., Jiang, F., & Zhao, L. (2022) · Nutrients · doi:10.3390/nu15010118 · Cited by 26
Niu, C., Tu, Y., Jin, Q., Chen, Z., Yuan, K., Wang, M., Zhang, P., Luo, J., Li, H., Yang, Y., et al. (2023) · Frontiers in Cellular and Infection Microbiology · doi:10.3389/fcimb.2023.1157368 · Cited by 26
Self-citationWu, Y., Yin, W., Hao, P., Chen, Y., Yu, L., Yu, X., Wu, Y., Li, X., Wang, W., Zhou, H., et al. (2024) · International Journal of Biological Macromolecules · doi:10.1016/j.ijbiomac.2024.129430 · Cited by 26
Self-citationShen, D., Cai, X., Hu, J., Song, S., Zhu, Q., Ma, H., Zhang, Y., Ma, R., Zhou, P., Yang, W., et al. (2025) · Journal of Inflammation Research · doi:10.2147/jir.s503648 · Cited by 27
Novel microbially transformed bile acids: Biosynthesis, structure, and function
Zhao, Q., Duan, Z., Lai, R., & Ma, P. (2025) · Pharmacological Research · doi:10.1016/j.phrs.2025.107775 · Cited by 26
Leveraging host-genetics and gut microbiota to determine immunocompetence in pigs
Ramayo‐Caldas, Y., Zingaretti, L. M., Pérez-Pascual, D., Alexandre, P. A., Reverter, A., Dalmau, A., Quintanilla, R., & Ballester, M. (2021) · Animal Microbiome · doi:10.1186/s42523-021-00138-9 · Cited by 25
The gut microbiota: an emerging modulator of drug resistance in hepatocellular carcinoma
Yao, J., Ning, B., & Ding, J. (2025) · Gut Microbes · doi:10.1080/19490976.2025.2473504 · Cited by 26
Wu, X., Yu, D., Ma, Y., Fang, X., & Sun, P. (2025) · International Journal of Biological Macromolecules · doi:10.1016/j.ijbiomac.2025.142442 · Cited by 30
Li, C., Xu, Y., Hu, Y., Zhou, X., Huang, Z., Ye, J., & Rao, Y. (2022) · Pharmacological Research · doi:10.1016/j.phrs.2022.106136 · Cited by 24
Self-citationQin, J., Luo, Z., Wang, Q., Tang, C., Meng, M., Huang, Z., Guo, B., He, Y., Feng, L., Nong, Y., et al. (2023) · Journal of Ethnopharmacology · doi:10.1016/j.jep.2023.116666 · Cited by 24
Self-citationSpecial correlation between diet and MASLD: positive or negative?
Liu, J., Li, C., Yang, Y., Li, J., Sun, X., Zhang, Y., Liu, R., Chen, F., & Li, X. (2025) · Cell & Bioscience · doi:10.1186/s13578-025-01382-1 · Cited by 29
Self-citationChua, H., Chen, Y., Wu, L., Yang, H., Lin, C.-R., Chen, H., Wu, J., Chang, M., Chen, P., & Ni, Y. (2023) · Cellular and Molecular Gastroenterology and Hepatology · doi:10.1016/j.jcmgh.2023.12.003 · Cited by 23
Dai, S., Guo, X., Liu, S., Tu, L., Hu, X., Cui, J. W., Ruan, Q., Tan, X., Lü, H., Jiang, T., et al. (2024) · Heliyon · doi:10.1016/j.heliyon.2024.e29269 · Cited by 22
Li, Y., Tao, Y., Xu, J., He, Y.-H., Zhang, W., Jiang, Z.-G., He, Y., Liu, H., Chen, M., Zhang, W., et al. (2021) · Frontiers in Medicine · doi:10.3389/fmed.2021.732039 · Cited by 22
Self-citationMultiomics reveals microbial metabolites as key actors in intestinal fibrosis in Crohn’s disease
Li, X.-H., Hu, S., Shen, X.-D., Zhang, R.-N., Liu, C.-G., Xiao, L., Lin, J.-J., Huang, L., He, W.-T., Wang, X., et al. (2024) · EMBO Molecular Medicine · doi:10.1038/s44321-024-00129-8 · Cited by 22
Metadata
- Authors
- Rao, Y., Kuang, Z., Li, C., Guo, S., Xu, Y., Zhao, D., Hu, Y., Song, B., Jiang, Z., Ge, Z., Liu, X., Li, C., Chen, S., Ye, J., Huang, Z., & Lu, Y.
- Affiliations
- Sun Yat-sen University (CN)
- Sun Yat-sen University
- RMIT University
- Corresponding author
- Rao, Yong
- Lu, Yongjun
- ORCID
- Venue
- Gut Microbes
- Publisher
- Informa UK Limited
- Published
- 2021-01-01
- Volume
- 13
- Issue
- 1
- Pages
- 1-19
- ISSN
- 1949-0976 (ISSN-L)
- 1949-0984
- PMC
- PMC8158032
- OpenAlex
- W3165210923
- Cited by
- 356
- References
- 70
- Citations by year
- 2026: 65 · 2025: 112 · 2024: 67 · 2023: 51 · 2022: 46 · 2021: 14
- FWCI
- 13.97
- Type
- journal article
- Language
- en
- Open access
- gold
- doi.org
- Licence
- Locations
- Gut Microbes (publishedVersion, cc-by)
- PubMed Central (publishedVersion, cc-by)
- PubMed (publishedVersion)
- RMIT Research Repository (RMIT University Library) (submittedVersion)
- DOAJ (DOAJ: Directory of Open Access Journals) (submittedVersion, cc-by-sa)
- Figshare (submittedVersion)
- Funders
- National Natural Science Foundation of China (81930098 to ZSH, 21672265 and 81872732 to ZSH, 81703336 to YR)
- Science and Technology Program of Guangzhou (201704020104 to ZSH)
- Science and Technology Development in Guangdong Province (2016A020217004 to ZSH)
- Natural Science Foundation of Guangdong Province (2017A030308003 to ZSH)
- Guang Dong Cheung Kong Philanthropy Foundation to YJL
- Fundamental Research Funds for the Central Universities
- Guang Dong Cheung Kong Philanthropy Foundation
- Outstanding Talents of Guangdong Special Plan (2019JC05Y456)
- the Science and Technology Program of Guangzhou (201704020104)
- Special Fund for Science and Technology Development in Guangdong Province (2016A020217004)
- the Natural Science Foundation of Guangdong Province (2017A030308003)
- Guangdong key areas R & D projects (2018B020205002)
- Key projects of National Natural Science Foundation of China (81930098)
- Topics
- Life Sciences › Biochemistry, Genetics and Molecular Biology › Molecular Biology › Gut microbiota and health
- Health Sciences › Medicine › Hepatology › Liver Disease Diagnosis and Treatment
- Health Sciences › Medicine › Endocrinology, Diabetes and Metabolism › Diet, Metabolism, and Disease
- Keywords
- Akkermansia muciniphila, non-alcoholic fatty liver disease, L-aspartic acid, gut-liver axis, bile acid metabolism, hepatic steatosis, oxidative stress, apoptosis, gut microbiota, high-fat high-cholesterol diet, obesity, mitochondrial oxidation, antibiotic-treated mice
- MeSH terms
- Gastrointestinal Microbiome, Akkermansia, Animals, Aspartic Acid, Bacteria, Fatty Liver, Humans, Liver, Male, Mice, Inbred C57BL, Gastrointestinal Tract, Mice, Diet, High-Fat
About these checks
Registry, retraction, Cites and statistics results are computed, not judged, with one exception: a printed reference that no index lists is read once by a model before it counts as a citation error. Claims are extracted by a model and kept only when their quote appears verbatim in the text; each cited source is then checked, with a model’s help, for whether it says what the claim relies on. Those verdicts can be wrong — read the claim’s quote and the cited source before relying on one.
Statistics and arithmetic are recomputed, not judged.
Confidence bands are shown only for fields calibrated on our annotated test set. None is calibrated yet, so no band is shown.
What counts as a claim ›How we measure confidence ›How we check this ›
Are you an author, or do you see a problem with this page? Request a review
