

The DOI matches its Crossref record; 47 of the 47 references it cites were found in a registry or an index.
Activated human astrocyte‐derived extracellular vesicles modulate neuronal uptake, differentiation and firing
Open accessAbstract
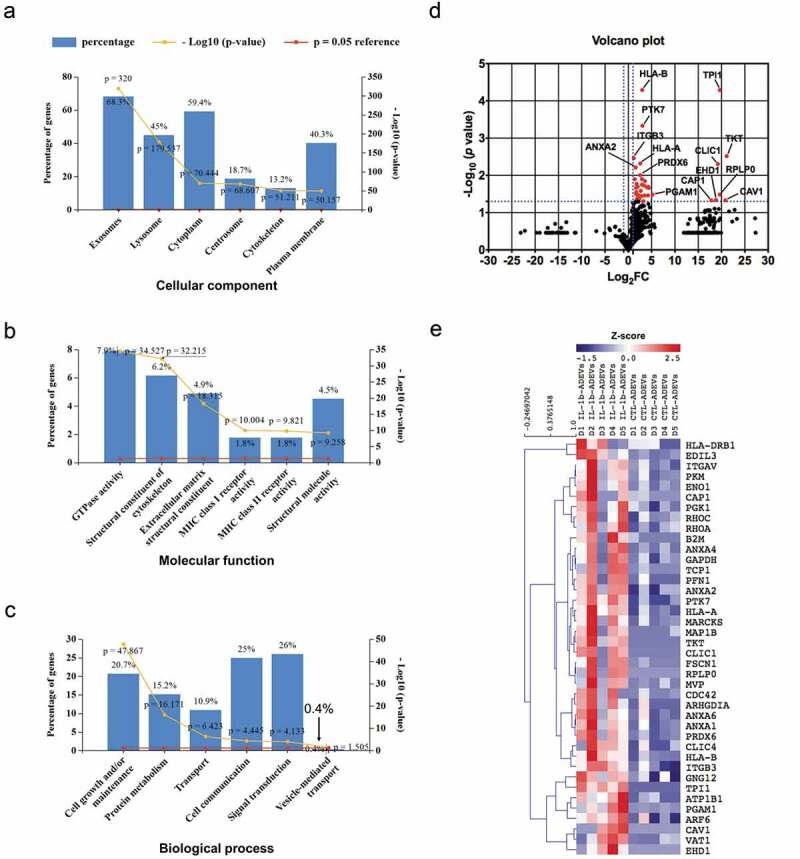
Astrocytes in the central nervous system (CNS) provide supportive neural functions and mediate inflammatory responses from microglia. Increasing evidence supports their critical roles in regulating brain homoeostasis in response to pro‐inflammatory factors such as cytokines and pathogen/damage‐associated molecular pattern molecules in infectious and neurodegenerative diseases. However, the underlying mechanisms of the trans‐cellular communication are still unclear. Extracellular vesicles (EVs) can transfer a large diversity of molecules such as lipids, nucleic acids and proteins for cellular communications. The purpose of this study is to characterize the EVs cargo proteins derived from human primary astrocytes (ADEVs) under both physiological and pathophysiological conditions. ADEVs were isolated from human primary astrocytes after vehicle (CTL) or interleukin‐1β (IL‐1β) pre‐treatment. Label‐free quantitative proteomic profiling revealed a notable up‐regulation of proteins including actin‐associated molecules, integrins and major histocompatibility complex in IL‐1β‐ADEVs compared to CTL‐ADEVs, which were involved in cellular metabolism and organization, cellular communication and inflammatory response. When fluorescently labelled ADEVs were added into primary cultured mouse cortical neurons, we found a significantly increased neuronal uptake of IL‐1β‐ADEVs compared to CTL‐ADEVs. We further confirmed it is likely due to the enrichment of surface proteins in IL‐1β‐ADEVs, as IL‐1β‐ADEVs uptake by neurons was partially suppressed by a specific integrin inhibitor. Additionally, treatment of neurons with IL‐1β‐ADEVs also reduced neurite outgrowth, branching and neuronal firing. These findings provide insight for the molecular mechanism of the ADEVs’ effects on neural uptake, neural differentiation and maturation, and its alteration in inflammatory conditions.
Overview
The claims and statistics of this paper haven’t been checked yet.
Free: it reads the open-access text and checks the first 5 claims that cite a source we can check. Create a free account to check every claim.
Integrity signals
Registry
Cites
Statistics
Figures




Verification
Claims the paper makes
The claims and statistics of this paper haven’t been checked yet.
Free: it reads the open-access text and checks the first 5 claims that cite a source we can check. Create a free account to check every claim.
Claims other papers make about this one
Each is checked against this paper’s own text: does it say what the citing paper says it does?
The source backs part of the claim, not all of it — or backs it for a different population, condition or comparison.
In the citing paper
“The release of EVs by reactive astrocytes serves as a means of communication with other glial cells, neurons, and even cells of the immune system [193, 196].”
From Extracellular vesicles as nanotheranostic platforms for targeted neurological disorder interventions (2024) · cites this paper as [193]
Experimental — accuracy not yet measuredThe source backs part of the claim, not all of it — or backs it for a different population, condition or comparison.
In the citing paper
“EVs have functional roles in neuron–glia and CNS–periphery communication following neurotrauma by regulating neuronal function, axonal regeneration and remyelination, metabolic activity, and the inflammatory milieu [192, 193].”
From Extracellular vesicles as nanotheranostic platforms for targeted neurological disorder interventions (2024) · cites this paper as [193]
Experimental — accuracy not yet measuredThe source backs part of the claim, not all of it — or backs it for a different population, condition or comparison.
In the citing paper
“A recent study that characterized sEV cargo proteins derived from human primary astrocytes showed that MVP was present in two of the five control sEVs and in all the same samples after the cells were treated with IL-1β [69].”
From Differential RNA packaging into small extracellular vesicles by neurons and astrocytes (2021) · cites this paper as [69]
Experimental — accuracy not yet measuredThe check wasn’t confident either way, so it gives no verdict — never disputed.
In the citing paper
“For the downregulated genes, hnRNPH1 protein was detected only in one control sample and both AGO proteins were absent [69].”
From Differential RNA packaging into small extracellular vesicles by neurons and astrocytes (2021) · cites this paper as [69]
Experimental — accuracy not yet measuredThe check wasn’t confident either way, so it gives no verdict — never disputed.
In the citing paper
“ANXA2 was detected in all the samples.”
From Differential RNA packaging into small extracellular vesicles by neurons and astrocytes (2021) · cites this paper as [69]
Experimental — accuracy not yet measured
Self-check
Percentages, sums and reported differences re-computed from the paper’s own numbers.
The self-check needs the paper’s full text.
Citations
Cites
Théry, C., Witwer, K. W., Aikawa, E., Alcaraz, M. J., Anderson, J. D., Andriantsitohaina, R., Antoniou, A., Arab, T., Archer, F., Atkin‐Smith, G. K., et al. (2018) · Journal of Extracellular Vesicles · doi:10.1080/20013078.2018.1535750 · Cited by 11,099
Self-citationTumour exosome integrins determine organotropic metastasis
Hoshino, A., Costa-Silva, B., Shen, T.-L., Rodrigues, G., Hashimoto, A., Tesic Mark, M., Molina, H., Kohsaka, S., Di Giannatale, A., Ceder, S., et al. (2015) · Nature · doi:10.1038/nature15756 · Cited by 5,101 · cited 1×
“silencing integrin αvβ5 reduced exosome uptake by liver cells [38].”
BackgroundKowal, J., Arras, G., Colombo, M., Jouve, M., Morath, J. P., Primdal-Bengtson, B., Dingli, F., Loew, D., Tkach, M., & Théry, C. (2016) · Proceedings of the National Academy of Sciences · doi:10.1073/pnas.1521230113 · Cited by 3,426 · cited 1×
“It has been shown that different exosome types might have specific expression pattern of tetraspanins, which includes CD63 CD81 CD9 EVs, CD63 – CD81 – CD9 EVs, CD63 – CD81 – CD9 – EVs and EVs enriched in other factors [33].”
BackgroundRoutes and mechanisms of extracellular vesicle uptake
Mulcahy, L. A., Pink, R. C., & Carter, D. R. F. (2014) · Journal of Extracellular Vesicles · doi:10.3402/jev.v3.24641 · Cited by 2,832 · cited 2×
“Accumulating evidence suggest that integrins are involved in EV uptake by recipient cells for internalization [30].”
BackgroundCurrent knowledge on exosome biogenesis and release
Hessvik, N. P., & Llorente, A. (2018) · Cellular and Molecular Life Sciences · doi:10.1007/s00018-017-2595-9 · Cited by 2,362 · cited 1×
“Prior to 30 min before collecting the conditioned medium, 5 mM adenosine triphosphate (ATP)was added into both control and IL-1β stimulated astrocytes to ensure the complete EV release [19].”
MethodAstrocyte barriers to neurotoxic inflammation
Sofroniew, M. V. (2015) · Nature Reviews Neuroscience · doi:10.1038/nrn3898 · Cited by 1,202 · cited 2×
“In addition, astrocytes are major immune reactive cells in the CNS and mediate inflammatory response to brain injury and infection [3].”
BackgroundEndocytosis, intracellular sorting, and processing of exosomes by dendritic cells
Morelli, A. E., Larregina, A. T., Shufesky, W. J., Sullivan, M. L. G., Stolz, D. B., Papworth, G. D., Zahorchak, A. F., Logar, A. J., Wang, Z., Watkins, S. C., et al. (2004) · Blood · doi:10.1182/blood-2004-03-0824 · Cited by 1,073 · cited 2×
“Blocking of ITGAV (CD51) and ITGB3 (CD61), which were significantly upregulated in IL-1β-ADEVs in our study, can reduce the uptake of EVs by dendritic cells [31].”
BackgroundMultiple control of interleukin-8 gene expression
Hoffmann, E., Dittrich-Breiholz, O., Holtmann, H., & Kracht, M. (2002) · Journal of Leukocyte Biology · doi:10.1189/jlb.72.5.847 · Cited by 1,058 · cited 1×
“In addition, the up-regulation of small GTPases in IL-1β-ADEVs also indicated a role of IL-1β-ADEVs in immune response, as they might contribute to increased CXCL8/IL-8 signalling, a well-known pathway in response to inflammatory signals of astrocytes [37].”
BackgroundAstrocytes: Key Regulators of Neuroinflammation
Colombo, E., & Farina, C. (2016) · Trends in Immunology · doi:10.1016/j.it.2016.06.006 · Cited by 904 · cited 1×
“Astrocytes are one of the most abundant cell types in the central nervous system (CNS) and are essential for brain homoeostasis [1].”
BackgroundHypothalamic programming of systemic ageing involving IKK-β, NF-κB and GnRH
Zhang, G., Li, J., Purkayastha, S., Tang, Y., Zhang, H., Yin, Y., Li, B., Liu, G., & Cai, D. (2013) · Nature · doi:10.1038/nature12143 · Cited by 834
Cited by
Alzheimer’s disease brain-derived extracellular vesicles spread tau pathology in interneurons
Ruan, Z., Pathak, D., Venkatesan Kalavai, S., Yoshii-Kitahara, A., Muraoka, S., Bhatt, N., Takamatsu-Yukawa, K., Hu, J., Wang, Y., Hersh, S., et al. (2021) · Brain · doi:10.1093/brain/awaa376 · Cited by 283
“125%, Invitrogen), triturated with polished pipettes, strained into single neurons using a 40-lm pore-size Falcon cell strainer (Thermo Fisher Scientific), and finally plated onto sterilized 12-mm high precision thickness coverslips (Bioscience Tools) at 375 000 cells per coverslip in 24-well plates, as previously des…”
BackgroundMethodInfluentialSelf-citationXu, X.-H., Yuan, T.-J., Dad, H. A., Shi, M.-Y., Huang, Y.-Y., Jiang, Z.-H., & Peng, L.-H. (2021) · Nano Letters · doi:10.1021/acs.nanolett.1c02530 · Cited by 233
Extracellular Vesicles as Signaling Mediators and Disease Biomarkers across Biological Barriers
Simeone, P., Bologna, G., Lanuti, P., Pierdomenico, L., Guagnano, M. T., Pieragostino, D., Del Boccio, P., Vergara, D., Marchisio, M., Miscia, S., et al. (2020) · International Journal of Molecular Sciences · doi:10.3390/ijms21072514 · Cited by 214
Insight into Extracellular Vesicle-Cell Communication: From Cell Recognition to Intracellular Fate
Ginini, L., Billan, S., Fridman, E., & Gil, Z. (2022) · Cells · doi:10.3390/cells11091375 · Cited by 176
“Similarly, pre-treatment of the exosomes of human primary astrocytes with RGD peptides (an integrin ligand) significantly prevented exosomal uptake by neurons, thus demonstrating the significant contribution of integrins [95].”
BackgroundMicroglia and Astrocyte Function and Communication: What Do We Know in Humans?
Garland, E. F., Hartnell, I. J., & Boche, D. (2022) · Frontiers in Neuroscience · doi:10.3389/fnins.2022.824888 · Cited by 165
Metadata
- Authors
- You, Y., Borgmann, K., Edara, V. V., Stacy, S., Ghorpade, A., & Ikezu, T.
- Affiliations
- Boston University (US)
- University of North Texas Health Science Center (US)
- Corresponding author
- Ikezu, Tsuneya
- Venue
- Journal of Extracellular Vesicles
- Publisher
- Wiley
- Published
- 2019-12-26
- Volume
- 9
- Issue
- 1
- Pages
- 1706801-1706801
- ISSN
- 2001-3078 (ISSN-L)
- PMC
- PMC6968484
- OpenAlex
- W2996950260
- Cited by
- 176
- References
- 47
- Citations by year
- 2026: 18 · 2025: 18 · 2024: 24 · 2023: 32 · 2022: 40 · 2021: 33 · 2020: 11
- FWCI
- 7.28
- Type
- journal article
- Language
- en
- Open access
- gold
- doi.org
- Licence
- cc-by-nc
- creativecommons.org/licenses/by-nc/4.0/ (vor)
- doi.wiley.com/10.1002/tdm_license_1.1 (tdm)
- creativecommons.org/licenses/by-nc/4.0/ (unspecified, 282 d)
- Locations
- Journal of Extracellular Vesicles (publishedVersion, cc-by-nc)
- PubMed Central (publishedVersion, cc-by-nc)
- PubMed (publishedVersion)
- DOAJ (DOAJ: Directory of Open Access Journals) (submittedVersion, cc-by-sa)
- Funders
- Cure Alzheimer's Fund (N/A)
- National Institutes of Health (R24 HD0008836, R21 NS104609, R56AG057469, R01AG054672, RF1AG054199)
- BrightFocus Foundation (A2016551S)
- Cure Alzheimer’s Fund (N/A)
- NIH (R21 NS104609, R56AG057469, R01AG054672, RF1AG054199)
- Topics
- Life Sciences › Biochemistry, Genetics and Molecular Biology › Molecular Biology › Extracellular vesicles in disease
- Life Sciences › Neuroscience › Neurology › Neuroinflammation and Neurodegeneration Mechanisms
- Life Sciences › Neuroscience › Cellular and Molecular Neuroscience › Neuroscience and Neuropharmacology Research
- Keywords
- astrocyte-neuron communication, IL-1β, neuroinflammation, integrins, major histocompatibility complex, actin-associated proteins, neurite outgrowth, neuronal differentiation, neuronal firing, cortical neurons, label-free quantitative proteomics
About these checks
Registry, retraction, Cites and statistics results are computed, not judged, with one exception: a printed reference that no index lists is read once by a model before it counts as a citation error. Claims are extracted by a model and kept only when their quote appears verbatim in the text; each cited source is then checked, with a model’s help, for whether it says what the claim relies on. Those verdicts can be wrong — read the claim’s quote and the cited source before relying on one.
Statistics and arithmetic are recomputed, not judged.
Confidence bands are shown only for fields calibrated on our annotated test set. None is calibrated yet, so no band is shown.
What counts as a claim ›How we measure confidence ›How we check this ›
Are you an author, or do you see a problem with this page? Request a review
How to cite
Cite CoChat for the checks on this page, and the paper for its own findings.
- This page
- CoChat. (2026). Citation check: Activated human astrocyte‐derived extracellular vesicles modulate neuronal uptake, differentiation and firing. https://app.cochat.ai/papers/10.1080/20013078.2019.1706801
- The paper
- You, Y., Borgmann, K., Edara, V. V., Stacy, S., Ghorpade, A., & Ikezu, T. (2020). Activated human astrocyte‐derived extracellular vesicles modulate neuronal uptake, differentiation and firing. Journal of Extracellular Vesicles. https://doi.org/10.1080/20013078.2019.1706801
Data sources
Bibliographic data: Semantic Scholar, OpenAlex, Crossref.
Contains information from the Semantic Scholar Academic Graph Datasets, made available under the ODC Attribution License (ODC-BY 1.0).
Semantic Scholar’s data is described in: Kinney, R., et al. (2023). The Semantic Scholar Open Data Platform. arXiv:2301.10140.
