

The DOI matches its Crossref record; 69 of the 69 references it cites were found in a registry or an index.
D-2-hydroxyglutarate interferes with HIF-1α stability skewing T-cell metabolism towards oxidative phosphorylation and impairing Th17 polarization
Open accessAbstract
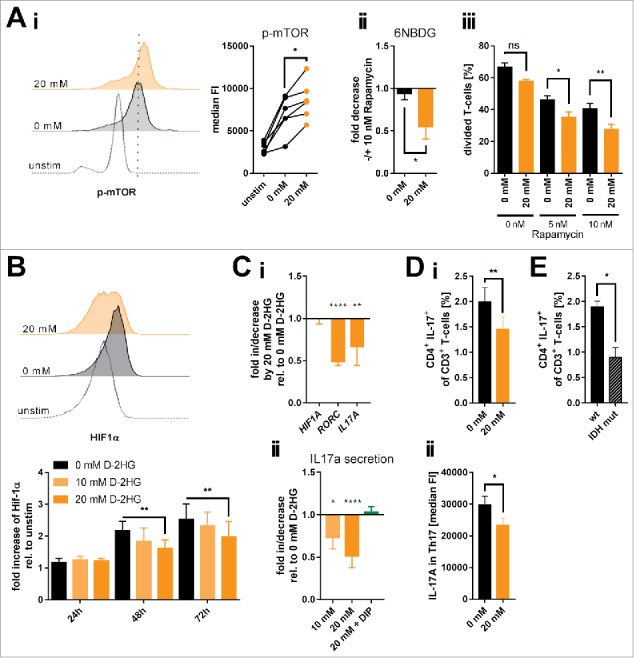
D-2-hydroxyglutarate (D-2HG) is released by various types of malignant cells including acute myeloid leukemia (AML) blasts carrying isocitrate dehydrogenase (IDH) gain-of-function mutations. D-2HG acting as an oncometabolite promotes proliferation, anoikis, and differentiation block of hematopoietic cells in an autocrine fashion. However, prognostic impact of IDH mutations and high D-2HG levels remains controversial and might depend on the overall mutational context. An increasing number of studies focus on the permissive environment created by AML blasts to promote immune evasion. Impact of D-2HG on immune cells remains incompletely understood. Here, we sought out to investigate the effects of D-2HG on T-cells as key mediators of anti-AML immunity. D-2HG was efficiently taken up by T-cells in vitro, which is in line with high 2-HG levels measured in T-cells isolated from AML patients carrying IDH mutations. T-cell activation was slightly impacted by D-2HG. However, D-2HG triggered HIF-1a protein destabilization resulting in metabolic skewing towards oxidative phosphorylation, increased regulatory T-cell (Treg) frequency, and reduced T helper 17 (Th17) polarization. Our data suggest for the first time that D-2HG might contribute to fine tuning of immune responses.
Overview
The claims and statistics of this paper haven’t been checked yet.
Run the check — free, no account needed. It reads the open-access text and checks the sources it cites.
Integrity signals
Registry
Cites
Statistics
Figures
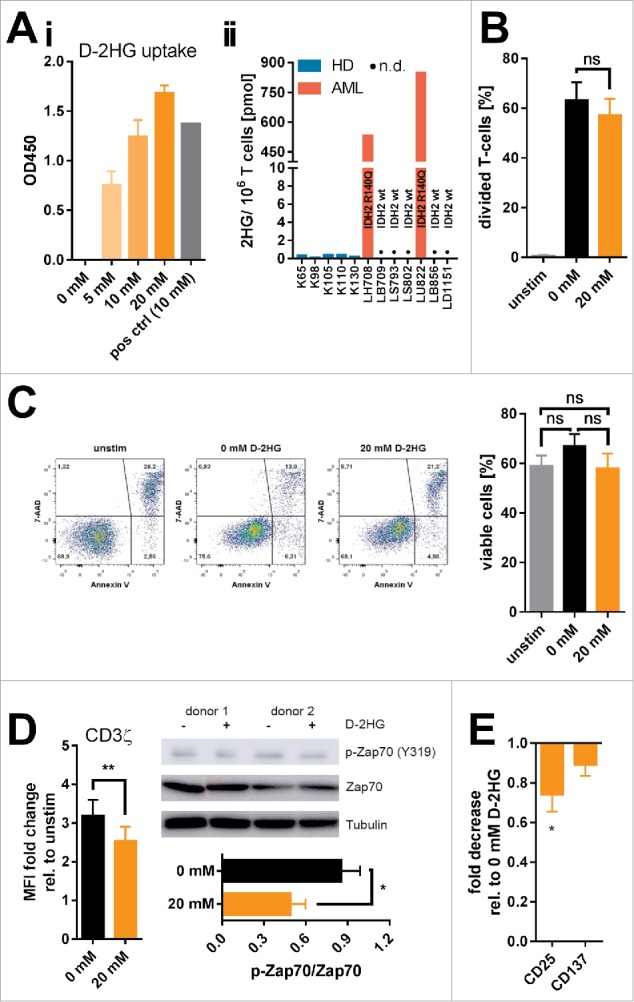
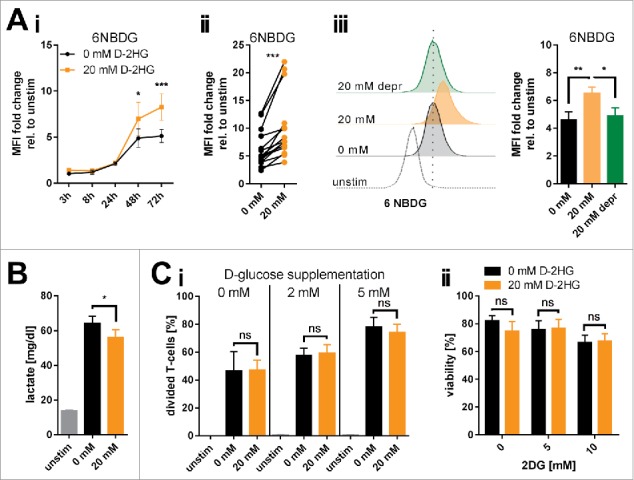
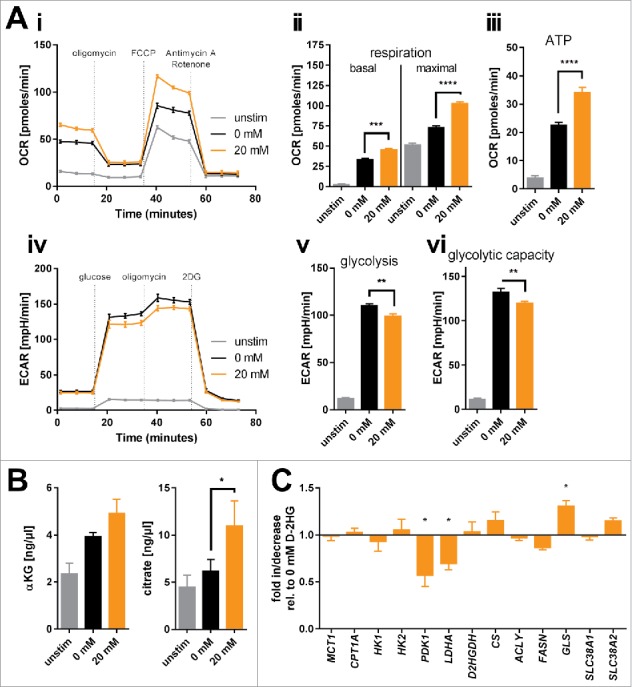
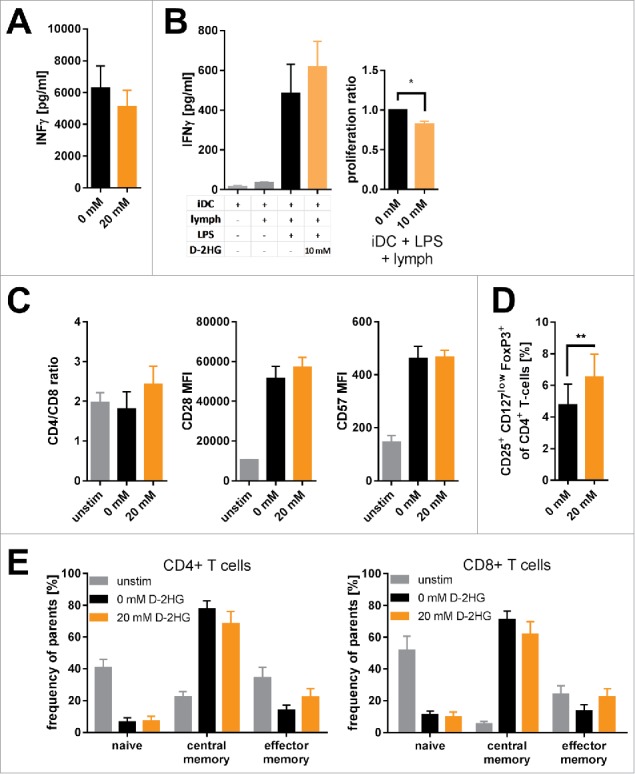
Verification
Claims the paper makes
The claims and statistics of this paper haven’t been checked yet.
Run the check — free, no account needed. It reads the open-access text and checks the sources it cites.
Claims other papers make about this one
Each is checked against this paper’s own text: does it say what the citing paper says it does?
The source backs part of the claim, not all of it — or backs it for a different population, condition or comparison.
In the citing paper
“The different enantiomeric forms of 2-HG may thus induce different responses to hypoxia, including a HIF-independent one and an altogether different tumour phenotype.”
From HIF-1-Independent Mechanisms Regulating Metabolic Adaptation in Hypoxic Cancer Cells (2021) · cites this paper as [156]
Experimental — accuracy not yet measured
Self-check
Percentages, sums and reported differences re-computed from the paper’s own numbers.
The self-check needs the paper’s full text.
Citations
Cites
An Integrated Genomic Analysis of Human Glioblastoma Multiforme
Parsons, D. W., Jones, S., Zhang, X., Lin, J. C.-H., Leary, R. J., Angenendt, P., Mankoo, P., Carter, H., Siu, I.-M., Gallia, G. L., et al. (2008) · Science · doi:10.1126/science.1164382 · Cited by 5,857
IDH1 and IDH2 Mutations in Gliomas
Yan, H., Parsons, D. W., Jin, G., McLendon, R., Rasheed, B. A., Yuan, W., Kos, I., Batinic-Haberle, I., Jones, S., Riggins, G. J., et al. (2009) · New England Journal of Medicine · doi:10.1056/nejmoa0808710 · Cited by 5,847
Cancer-associated IDH1 mutations produce 2-hydroxyglutarate
Dang, L., White, D. W., Gross, S., Bennett, B. D., Bittinger, M. A., Driggers, E. M., Fantin, V. R., Jang, H. G., Jin, S., Keenan, M. C., et al. (2009) · Nature · doi:10.1038/nature08617 · Cited by 4,154
Xu, W., Yang, H., Liu, Y., Yang, Y., Wang, P., Kim, S.-H., Ito, S., Yang, C., Wang, P., Xiao, M.-T., et al. (2011) · Cancer Cell · doi:10.1016/j.ccr.2010.12.014 · Cited by 2,875
Figueroa, M. E., Abdel-Wahab, O., Lu, C., Ward, P. S., Patel, J., Shih, A., Li, Y., Bhagwat, N., Vasanthakumar, A., Fernandez, H. F., et al. (2010) · Cancer Cell · doi:10.1016/j.ccr.2010.11.015 · Cited by 2,766
HIF-1 mediates adaptation to hypoxia by actively downregulating mitochondrial oxygen consumption
Papandreou, I., Cairns, R. A., Fontana, L., Lim, A. L., & Denko, N. C. (2006) · Cell Metabolism · doi:10.1016/j.cmet.2006.01.012 · Cited by 2,267
Recurring mutations found by sequencing an acute myeloid leukemia genome
Mardis, E. R., Ding, L., Dooling, D. J., Larson, D. E., McLellan, M. D., Chen, K., Koboldt, D. C., Fulton, R. S., Delehaunty, K. D., McGrath, S. D., et al. (2009) · New England Journal of Medicine · doi:10.1056/nejmoa0903840 · Cited by 2,219
Michalek, R. D., Gerriets, V. A., Jacobs, S. R., Macintyre, A. N., MacIver, N. J., Mason, E. F., Sullivan, S. A., Nichols, A. G., & Rathmell, J. C. (2011) · The Journal of Immunology · doi:10.4049/jimmunol.1003613 · Cited by 2,091
LDHA-Associated Lactic Acid Production Blunts Tumor Immunosurveillance by T and NK Cells
Brand, A., Singer, K., Koehl, G. E., Kolitzus, M., Schoenhammer, G., Thiel, A., Matos, C., Bruss, C., Klobuch, S., Peter, K., et al. (2016) · Cell Metabolism · doi:10.1016/j.cmet.2016.08.011 · Cited by 2,039
Self-citationWard, P. S., Patel, J., Wise, D. R., Abdel-Wahab, O., Bennett, B. D., Coller, H. A., Cross, J. R., Fantin, V. R., Hedvat, C. V., Perl, A. E., et al. (2010) · Cancer Cell · doi:10.1016/j.ccr.2010.01.020 · Cited by 2,020
Research works printed but not linked: 3
- Jozwiak P, 2014, Front Endocrinol., 5, 145
- 10.1084/jem.20110278 · DOI · Paper page
- He G, 2014, Asia Pacific Jclin Nutrition., 23, 174
Cited by
Sorted by citations
Glycolysis – a key player in the inflammatory response
Soto‐Heredero, G., Heras, M. M. G. D. L., Gabandé‐Rodríguez, E., Oller, J., & Mittelbrunn, M. (2020) · FEBS Journal · doi:10.1111/febs.15327 · Cited by 660
The functional roles of TCA cycle metabolites in cancer
Eniafe, J., & Jiang, S. (2021) · Oncogene · doi:10.1038/s41388-020-01639-8 · Cited by 289
Friščić, J., Böttcher, M., Reinwald, C., Bruns, H., Wirth, B., Popp, S.-J., Walker, K., Ackermann, J. A., Chen, X., Turner, J. D., et al. (2021) · Immunity · doi:10.1016/j.immuni.2021.03.003 · Cited by 257
Self-citation2-Oxoglutarate-dependent dioxygenases in cancer
Losman, J.-A., Koivunen, P., & Kaelin, W. G. (2020) · Nature reviews. Cancer · doi:10.1038/s41568-020-00303-3 · Cited by 241
Yan, Y., Huang, L., Liu, Y., Yi, M., Chu, Q., Jiao, D., & Wu, K. (2022) · Journal of Hematology & Oncology · doi:10.1186/s13045-022-01322-3 · Cited by 226
HIF-1-Independent Mechanisms Regulating Metabolic Adaptation in Hypoxic Cancer Cells
Lee, S.-H., Golinska, M., & Griffiths, J. R. (2021) · Cells · doi:10.3390/cells10092371 · Cited by 169
The Roles of 2-Hydroxyglutarate
Du, X., & Hu, H. (2021) · Frontiers in Cell and Developmental Biology · doi:10.3389/fcell.2021.651317 · Cited by 160
T Cell Metabolism in Infection
Wik, J. A., & Skålhegg, B. S. (2022) · Frontiers in Immunology · doi:10.3389/fimmu.2022.840610 · Cited by 158
2-Hydroxyglutarate in Cancer Cells
Ježek, P. (2020) · Antioxidants & Redox Signaling · doi:10.1089/ars.2019.7902 · Cited by 130
Siska, P. J., Singer, K., Evert, K., Renner, K., & Kreutz, M. P. (2020) · Immunological Reviews · doi:10.1111/imr.12846 · Cited by 125
Self-citationImmunometabolic rewiring in tumorigenesis and anti-tumor immunotherapy
Lian, X., Yang, K., Li, R., Li, M., Zuo, J., Zheng, B., Wang, W., Wang, P., & Zhou, S. (2022) · Molecular Cancer · doi:10.1186/s12943-021-01486-5 · Cited by 120
Kuo, P., Weng, W., Scofield, B. A., Paraiso, H. C., Brown, D. A., Wang, P., Yu, I.-C. I., & Yen, J.-H. J. (2020) · Journal of Neuroinflammation · doi:10.1186/s12974-020-01768-7 · Cited by 113
Mortazavi, A., Fayed, I., Bachani, M., Dowdy, T., Jahanipour, J., Khan, A. U., Owotade, J., Walbridge, S., Inati, S. K., Steiner, J. P., et al. (2022) · Neuro-Oncology · doi:10.1093/neuonc/noac003 · Cited by 98
The oncometabolite 2-hydroxyglutarate inhibits microglial activation via the AMPK/mTOR/NF-κB pathway
Han, C., Zheng, J., Sun, L., Yang, H., Cao, Z., Zhang, X., Zheng, L. T., & Zhen, X.-C. (2019) · Acta Pharmacologica Sinica · doi:10.1038/s41401-019-0225-9 · Cited by 75
Metabolic regulation of TH17 cells
Shen, H., & Shi, L. Z. (2019) · Molecular Immunology · doi:10.1016/j.molimm.2019.03.005 · Cited by 72
Effects of lactate on metabolism and differentiation of CD4+T cells
Zhang, Y., Xing, M.-L., Fang, H.-H., Li, W., Wu, L., & Chen, Z. (2023) · Molecular Immunology · doi:10.1016/j.molimm.2022.12.015 · Cited by 69
Miller, J. J. (2022) · Neurotherapeutics · doi:10.1007/s13311-022-01238-3 · Cited by 70
Impact of epigenetic reprogramming on antitumor immune responses in glioma
McClellan, B. L., Haase, S., Núñez, F. J., Alghamri, M. S., Dabaja, A. A., Lowenstein, P. R., & Castro, M. G. (2023) · Journal of Clinical Investigation · doi:10.1172/jci163450 · Cited by 68
The effects of 2-hydroxyglutarate on the tumorigenesis of gliomas
Reiter–Brennan, C., Semmler, L., & Klein, A. (2018) · Współczesna Onkologia · doi:10.5114/wo.2018.82642 · Cited by 57
Williams, N. C., Ryan, D. G., Costa, A. S. H., Mills, E. L., Jedrychowski, M. P., Cloonan, S. M., Frezza, C., & O'Neill, L. A. J. (2021) · Journal of Biological Chemistry · doi:10.1016/j.jbc.2021.101501 · Cited by 57
Mitochondrial Genetic and Epigenetic Regulations in Cancer: Therapeutic Potential
Wagner, A., Kosnacova, H., Chovanec, M., & Jurkovičová, D. (2022) · International Journal of Molecular Sciences · doi:10.3390/ijms23147897 · Cited by 54
Wang, X., Luo, X., Xiao, R., Liu, X., Zhou, F., Jiang, D., Bai, J., Cui, M., You, L., & Yupei, Z. (2026) · Signal Transduction and Targeted Therapy · doi:10.1038/s41392-025-02334-4 · Cited by 59
IDH-mutant gliomas harbor fewer regulatory T cells in humans and mice
Richardson, L. G., Nieman, L. T., Stemmer-Rachamimov, A. O., Zheng, X. S., Stafford, K., Nagashima, H., Miller, J. J., Kiyokawa, J., Ting, D. T., Wakimoto, H., et al. (2020) · OncoImmunology · doi:10.1080/2162402x.2020.1806662 · Cited by 52
Shaping of Dendritic Cell Function by the Metabolic Micro-Environment
Brombacher, E. C., & Everts, B. (2020) · Frontiers in Endocrinology · doi:10.3389/fendo.2020.00555 · Cited by 45
Haug, T., Aigner, M., Peuser, M., Strobl, C. D., Hildner, K. M., Mougiakakos, D., Bruns, H., Mackensen, A., & Völkl, S. (2019) · Frontiers in Immunology · doi:10.3389/fimmu.2019.00883 · Cited by 46
Self-citationMendez, L., Posey, R. R., & Pandolfi, P. P. (2019) · Frontiers in Oncology · doi:10.3389/fonc.2019.01162 · Cited by 46
Systemic and local immunosuppression in glioblastoma and its prognostic significance
Stepanenko, A. A., Sosnovtseva, A. O., Valikhov, M. P., Chernysheva, A. A., Abramova, O. V., Ka, P., & Chekhonin, V. P. (2024) · Frontiers in Immunology · doi:10.3389/fimmu.2024.1326753 · Cited by 48
IDH Mutations in Glioma: Molecular, Cellular, Diagnostic, and Clinical Implications
Choate, K. A., Pratt, E. P. S., Jennings, M. J., Winn, R. J., & Mann, P. B. (2024) · Biology · doi:10.3390/biology13110885 · Cited by 49
Tumor-related molecular determinants of neurocognitive deficits in patients with diffuse glioma
van Kessel, E., Berendsen, S., Baumfalk, A. E., Venugopal, H., Krijnen, E. A., Spliet, W. G. M., Hecke, W. V., Giuliani, F., Seute, T., van Zandvoort, M. J. E., et al. (2022) · Neuro-Oncology · doi:10.1093/neuonc/noac036 · Cited by 40
Immunometabolism of regulatory T cells in cancer
Saravia, J., & Chi, H. (2025) · Oncogene · doi:10.1038/s41388-025-03458-1 · Cited by 45
Oncometabolite Fingerprinting Using Fluorescent Single‐Walled Carbon Nanotubes
Amir, D., Hendler‐Neumark, A., Wulf, V., Ehrlich, R., & Bisker, G. (2021) · Advanced Materials Interfaces · doi:10.1002/admi.202101591 · Cited by 37
Mostafavi, S., Zalpoor, H., & Hassan, Z. M. (2022) · Cellular & Molecular Biology Letters · doi:10.1186/s11658-022-00356-2 · Cited by 41
Strobl, C. D., Schaffer, S., Haug, T., Völkl, S., Peter, K., Singer, K., Böttcher, M., Mougiakakos, D., Mackensen, A., & Aigner, M. (2019) · Molecular Cancer Therapeutics · doi:10.1158/1535-7163.mct-19-0189 · Cited by 35
Self-citationLu, J., Böttcher, M., Walther, T., Mougiakakos, D., Zenz, T., & Huber, W. K. (2019) · Haematologica · doi:10.3324/haematol.2018.203067 · Cited by 31
Self-citationEpigenetic Reprogramming for Targeting IDH-Mutant Malignant Gliomas
Park, J., & Turcan, Ş. (2019) · Cancers · doi:10.3390/cancers11101616 · Cited by 33
Harnessing oxidative stress for anti-glioma therapy
Ostrowski, R. P., & Pucko, E. B. (2022) · Neurochemistry International · doi:10.1016/j.neuint.2022.105281 · Cited by 30
2-Hydroxyglutarate in Acute Myeloid Leukemia: A Journey from Pathogenesis to Therapies
Raimondi, V., Ciotti, G., Gottardi, M., & Ciccarese, F. (2022) · Biomedicines · doi:10.3390/biomedicines10061359 · Cited by 35
Tawfik, H. O., Mousa, M. H. A., Zaky, M. Y., El‐Dessouki, A. M., Sharaky, M. M., Abdullah, O., El‐Hamamsy, M. H., & Al-Karmalawy, A. A. (2024) · Bioorganic Chemistry · doi:10.1016/j.bioorg.2024.107483 · Cited by 28
Ugele, I., Cárdenas-Conejo, Z. E., Hammon, K., Wehrstein, M., Bruß, C., Peter, K., Singer, K., Gottfried, E., Boesch, J., Oefner, P. J., et al. (2019) · International Journal of Molecular Sciences · doi:10.3390/ijms20030742 · Cited by 32
Self-citationTargeting the Metabolic Paradigms in Cancer and Diabetes
Bosso, M., Haddad, D., Madhoun, A. S. A., & Al‐Mulla, F. (2024) · Biomedicines · doi:10.3390/biomedicines12010211 · Cited by 26
Emerging targets for anticancer vaccination: IDH
Platten, M., Bunse, L., & Wick, W. (2021) · ESMO Open · doi:10.1016/j.esmoop.2021.100214 · Cited by 26
Advances in Immune Microenvironment and Immunotherapy of Isocitrate Dehydrogenase Mutated Glioma
Yan, D., Li, W., Liu, Q., & Yang, K. (2022) · Frontiers in Immunology · doi:10.3389/fimmu.2022.914618 · Cited by 28
Oncometabolite 2-hydroxyglutarate regulates anti-tumor immunity
Cai, M., Zhao, J., Ding, Q., & Wei, J. (2024) · Heliyon · doi:10.1016/j.heliyon.2024.e24454 · Cited by 30
Immunometabolism: A ‘Hot’ Switch for ‘Cold’ Pediatric Solid Tumors
Xiao, L., Yeung, H., Haber, M., Norris, M. D., & Somers, K. (2021) · Trends in cancer · doi:10.1016/j.trecan.2021.05.002 · Cited by 24
Bandi, D. S. R., Sarvesh, S., Farran, B., Nagaraju, G. P., & El‐Rayes, B. F. (2023) · Cytokine & Growth Factor Reviews · doi:10.1016/j.cytogfr.2023.06.006 · Cited by 26
Potent immunosuppressive effects of the oncometaboliteR-2-hydroxyglutarate
Galluzzi, L., & Kroemer, G. (2018) · OncoImmunology · doi:10.1080/2162402x.2018.1528815 · Cited by 25
Illuminating the cross-talk between tumor metabolism and immunity in IDH-mutated cancers
Leca, J., Fortin, J., & Mak, T. W. (2020) · Current Opinion in Biotechnology · doi:10.1016/j.copbio.2020.11.013 · Cited by 23
Cellular metabolism dictates T cell effector function in health and disease
Kolan, S. S., Li, G., Wik, J. A., Malachin, G., Guo, S., Kolan, P., & Skålhegg, B. S. (2020) · Scandinavian Journal of Immunology · doi:10.1111/sji.12956 · Cited by 24
GEM-IL: A highly responsive fluorescent lactate indicator
Bekdash, R., Quejada, J. R., Ueno, S., Kawano, F., Morikawa, K., Klein, A. D., Matsumoto, K., Lee, T. C., Nakanishi, K., Chalan, A., et al. (2021) · Cell Reports Methods · doi:10.1016/j.crmeth.2021.100092 · Cited by 24
Regulation of immune cell metabolism in health and disease: Special focus on T and B cell subsets
Chakraborty, S., Khamaru, P., & Bhattacharyya, A. (2022) · Cell Biology International · doi:10.1002/cbin.11867 · Cited by 24
Kimura, K., Jackson, T. L. B., & Huang, R. C. C. (2023) · Current Issues in Molecular Biology · doi:10.3390/cimb45110580 · Cited by 27
Jacobs, B., Schlögl, S., Strobl, C. D., Völkl, S., Stoll, A., Mougiakakos, D., Malmberg, K., Mackensen, A., & Aigner, M. (2020) · Frontiers in Immunology · doi:10.3389/fimmu.2020.02128 · Cited by 25
Self-citationChen, X., Cai, Y., Hu, X., Ding, C., He, L., Zhang, X., Chen, F., & Yan, J. (2022) · Science Advances · doi:10.1126/sciadv.abm9120 · Cited by 23
Böttcher, M., Loschinski, R., Kahlfuß, S., Aigner, M., Gießl, A., Mackensen, A., Schlötzer-Schrehardt, U. M., Tüting, T., Bruns, H., & Mougiakakos, D. (2022) · Cells · doi:10.3390/cells11142176 · Cited by 22
Self-citationThe Roles of IDH1 in Tumor Metabolism and Immunity
Ni, Y., Shen, P., Wang, X. T., Liu, H., Luo, H., & Han, X. (2022) · Future Oncology · doi:10.2217/fon-2022-0583 · Cited by 23
Amino Acid and Glucose Fermentation Maintain ATP Content in Mouse and Human Malignant Glioma Cells
Lee, D. C., Ta, N. L., Mukherjee, P., Duraj, T., Domin, M. A., Greenwood, B. P., Karmacharya, S., Narain, N. R., Kiebish, M. A., Chinopoulos, C., et al. (2024) · ASN NEURO · doi:10.1080/17590914.2024.2422268 · Cited by 21
Perspectives of immunotherapy in isocitrate dehydrogenase-mutant gliomas
Friedrich, M., Bunse, L., Wick, W., & Platten, M. (2018) · Current Opinion in Oncology · doi:10.1097/cco.0000000000000478 · Cited by 21
Metabolic regulation of innate and adaptive lymphocyte effector responses
Joseph, A. M., Monticelli, L. A., & Sonnenberg, G. F. (2018) · Immunological Reviews · doi:10.1111/imr.12703 · Cited by 21
Zhao, C., Li, X., Yang, Y., Li, Z., Li, M., Tan, Q., Liang, W. H., & Liu, Z. (2019) · PubMed Central · Cited by 21
Zha, C., Yang, X., Yang, J., Zhang, Y., & Huang, R. (2024) · Annals of Hematology · doi:10.1007/s00277-024-06117-9 · Cited by 23
New insights into the Immune TME of adult-type diffuse gliomas
Richard, Q., Laurenge, A., Mallat, M., Sanson, M., & Castro‐Vega, L. J. (2022) · Current Opinion in Neurology · doi:10.1097/wco.0000000000001112 · Cited by 23
Hypoxic Transformation of Immune Cell Metabolism Within the Microenvironment of Oral Cancers
Chaudhary, A., Bag, S., Arora, N., Radhakrishnan, V. S., Mishra, D. K., & Mukherjee, G. (2020) · Frontiers in Oral Health · doi:10.3389/froh.2020.585710 · Cited by 19
Metabolic Rewiring in Radiation Oncology Toward Improving the Therapeutic Ratio
van Gisbergen, M. W., Zwilling, E., & Dubois, L. J. (2021) · Frontiers in Oncology · doi:10.3389/fonc.2021.653621 · Cited by 20
The two enantiomers of 2-hydroxyglutarate differentially regulate cytotoxic T cell function
Foskolou, I. P., Cunha, P. P., Sánchez‐López, E., Minogue, E., Nicolet, B. P., Guislain, A., Jorgensen, C., Kostidis, S., Zandhuis, N. D., Barbieri, L., et al. (2023) · Cell Reports · doi:10.1016/j.celrep.2023.113013 · Cited by 19
Wang, Y., Liu, B., Li, F., Zhang, Y., Gao, X., Wang, Y., & Zhou, H. (2023) · Frontiers in Endocrinology · doi:10.3389/fendo.2023.1274239 · Cited by 18
The Role and Applied Value of Mitochondria in Glioma‐Related Research
Chen, L., Zhang, H., Shang, C., & Hong, Y. (2024) · CNS Neuroscience & Therapeutics · doi:10.1111/cns.70121 · Cited by 18
Mougiakakos, D. (2019) · Frontiers in Oncology · doi:10.3389/fonc.2019.01166 · Cited by 21
Self-citationComont, T., Nicolau-Travers, M.-L., Bertoli, S., Récher, C., Vergez, F., & Treiner, E. (2021) · Cancer Immunology Immunotherapy · doi:10.1007/s00262-021-03037-9 · Cited by 17
Checkpoint Inhibitors in Acute Myeloid Leukemia
Damiani, D., & Tiribelli, M. (2023) · Biomedicines · doi:10.3390/biomedicines11061724 · Cited by 16
Isocitrate Dehydrogenase Mutations in Cancer: Mechanisms of Transformation and Metabolic LiabilityPreprint
Gunn, K., & Losman, J.-A. (2024) · Cold Spring Harbor Perspectives in Medicine · doi:10.1101/cshperspect.a041537 · Cited by 16
Deciphering the multifaceted roles and clinical implications of 2-hydroxyglutarate in cancer
Hao, J., Huang, Z., Zhang, S., Song, K., Wang, J., Gao, C., Fang, Z., & Zhang, N. (2024) · Pharmacological Research · doi:10.1016/j.phrs.2024.107437 · Cited by 15
2-hydroxyglutarate rides the cancer-immunity cycle
Foskolou, I. P., Bunse, L., & den Bossche, J. V. (2023) · Current Opinion in Biotechnology · doi:10.1016/j.copbio.2023.102976 · Cited by 17
D-Mannose Suppresses γδ T Cells and Alleviates Murine Psoriasis
Li, M., Cheng, H., Tian, D., Yang, L., Du, X., Pan, Y., Zhang, D., & Mei, X. (2022) · Frontiers in Immunology · doi:10.3389/fimmu.2022.840755 · Cited by 15
A preventative role of nitrate for hypoxia-induced intestinal injury
Xu, Y., Sa, Y., Zhang, C., Wang, J., Shao, Q., Liu, J., Wang, S., & Zhou, J. W. (2024) · Free Radical Biology and Medicine · doi:10.1016/j.freeradbiomed.2024.01.030 · Cited by 14
Degradation of D-2-hydroxyglutarate in the presence of isocitrate dehydrogenase mutations
Berger, R. S., Ellmann, L., Reinders, J., Kreutz, M. P., Stempfl, T., Oefner, P. J., & Dettmer, K. (2019) · Scientific Reports · doi:10.1038/s41598-019-43891-3 · Cited by 14
Self-citation2-Hydroxyglutarate Metabolism Is Altered in an in vivo Model of LPS Induced Endotoxemia
Fitzpatrick, S. F., Lambden, S., Macías, D., Puthucheary, Z., Pietsch, S., Mendil, L., McPhail, M. J. W., & Johnson, R. S. (2020) · Frontiers in Physiology · doi:10.3389/fphys.2020.00147 · Cited by 14
Hammon, K., Renner, K., Althammer, M., Voll, F., Babl, N., Decking, S.-M., Siska, P. J., Matos, C., Cárdenas-Conejo, Z. E., Mendes, K., et al. (2024) · Haematologica · doi:10.3324/haematol.2023.283597 · Cited by 16
Self-citationCrosstalk of Epigenetic and Metabolic Signaling Underpinning Glioblastoma Pathogenesis
Markouli, M., Strepkos, D., Papavassiliou, K. A., Papavassiliou, A. G., & Piperi, C. (2022) · Cancers · doi:10.3390/cancers14112655 · Cited by 12
Gregorio, E. D., Miolo, G., Saorin, A., Steffan, A., & Corona, G. (2021) · International Journal of Molecular Sciences · doi:10.3390/ijms22115574 · Cited by 11
Liu, S., Zhou, Y., Chen, Y., Qiao, Y., Bai, L., Zhang, S., Men, D., Zhang, H., Pan, F., Gao, Y., et al. (2024) · International Immunopharmacology · doi:10.1016/j.intimp.2024.112828 · Cited by 10
Álvarez-González, E., & Sierra, L. M. (2024) · International Journal of Molecular Sciences · doi:10.3390/ijms25169054 · Cited by 10
Zhang, C., Xiao, J., Fa, L., Jiang, F., Jiang, H., Zhou, L., & Xu, Z. (2023) · BMC Ophthalmology · doi:10.1186/s12886-023-03098-7 · Cited by 9
Liu, S.-L., Zhou, Y., Tang, D.-B., Zhou, N., Zheng, W., Tang, Z.-H., Duan, C., & Chen, J. (2019) · Biochemical and Biophysical Research Communications · doi:10.1016/j.bbrc.2019.08.034 · Cited by 9
Lactonization of the Oncometabolite D-2-Hydroxyglutarate Produces a Novel Endogenous Metabolite
Berger, R. S., Wachsmuth, C. J., Waldhier, M. C., Renner, K., Thomas, S., Chaturvedi, A., Niller, H.-H., Bumes, E., Hau, P., Proescholdt, M. A., et al. (2021) · Cancers · doi:10.3390/cancers13081756 · Cited by 9
Self-citationHäselbarth, L., Karow, A., Mentz, K., Böttcher, M., Roche-Lancaster, O., Krumbholz, M., Jitschin, R., Mougiakakos, D., & Metzler, M. (2023) · Cancer Immunology Immunotherapy · doi:10.1007/s00262-022-03361-8 · Cited by 9
Self-citationVlahopoulos, S. (2024) · International Journal of Molecular Sciences · doi:10.3390/ijms25168621 · Cited by 9
Microenvironmental Metabolites in the Intestine: Messengers between Health and Disease
Zaurito, A. E., & Tschurtschenthaler, M. (2022) · Metabolites · doi:10.3390/metabo12010046 · Cited by 8
Häselbarth, L., Gamali, S., Saul, D., Krumbholz, M., Loschinski, R., Böttcher, M., Zou, D., Metzler, M., Karow, A., & Mougiakakos, D. (2023) · BMC Cancer · doi:10.1186/s12885-023-11623-6 · Cited by 8
Self-citationGlycolysis and Autoimmune Diseases: A Growing Relationship
Rezaei, R., Tahmasebi, S., Atashzar, M. R., & Amani, D. (2020) · Biochemistry (Moscow) Supplement Series A Membrane and Cell Biology · doi:10.1134/s1990747820020154 · Cited by 7
Can the New and Old Drugs Exert an Immunomodulatory Effect in Acute Myeloid Leukemia?
Tarantini, F., Cumbo, C., Anelli, L., Zagaria, A., Specchia, G., Musto, P., & Albano, F. (2021) · Cancers · doi:10.3390/cancers13164121 · Cited by 7
idh-1 neomorphic mutation confers sensitivity to vitamin B12 in Caenorhabditis elegans
Ponomarova, O., Starbard, A. N., Belfi, A. C., Anderson, A. V., Sundaram, M. V., & Walhout, A. J. M. (2024) · Life Science Alliance · doi:10.26508/lsa.202402924 · Cited by 6
Regulation of CD4 + T cell differentiation and function by glucose metabolism
Liu, Y., Zhou, Y., Zhang, J., Li, J., & Zou, L. (2025) · Genes and Immunity · doi:10.1038/s41435-025-00340-8 · Cited by 8
Exploitable metabolic dependencies in MLL-ENL–induced leukemia
García-Cuéllar, M.-P., Lawlor, J., Böttcher, M., Mougiakakos, D., Metzler, M., & Slany, R. K. (2020) · Blood Advances · doi:10.1182/bloodadvances.2020001710 · Cited by 6
Self-citationCancer-specific metabolism: Promising approaches for colorectal cancer treatment
Jeong, K. (2019) · World Journal of Gastrointestinal Oncology · doi:10.4251/wjgo.v11.i10.768 · Cited by 6
Agarwal, P., Beale, O., Zhang, X., Sandlesh, P., Jaman, E., & Amankulor, N. (2022) · World Neurosurgery · doi:10.1016/j.wneu.2022.03.123 · Cited by 6
Metabolism and therapeutic response in acute myeloid leukemia with IDH1/2 mutations
Gabellier, L., Bosetta, E., Heiblig, M., & Sarry, J. (2025) · Trends in cancer · doi:10.1016/j.trecan.2025.01.011 · Cited by 6
Oxidation of α-hydroxy acids by D-2-hydroxyglutarate dehydrogenase enzymes
Quaye, J. A., Moni, B. M., Kugblenu, J. E., & Gadda, G. (2025) · Archives of Biochemistry and Biophysics · doi:10.1016/j.abb.2025.110355 · Cited by 4
Metabolic Reprogramming in Response to Freund’s Adjuvants: Insights from Serum Metabolomics
Mone, K., Garcia, E. J. T., Abdullatif, F., Rasquinha, M. T., Sur, M., Hanafy, M., Zinniel, D. K., Singh, S., Thomas, R., Barletta, R. G., et al. (2025) · Microorganisms · doi:10.3390/microorganisms13030492 · Cited by 4
Immunometabolic Regulation of Anti-Tumor T-Cell Responses by the Oncometabolite D-2-Hydroxyglutarate
Böttcher, M., & Mougiakakos, D. (2019) · Immunometabolism · doi:10.20900/immunometab20190007 · Cited by 4
Self-citationTargeting CD4+ T Cell Glucose Metabolism: A Novel Immunotherapeutic Approach for Type 1 Diabetes
Niu, Y., Wang, N., Qiao, L., Huang, Z., Jing, G., Fu, S., & Tang, X. (2025) · Biomolecules · doi:10.3390/biom15060770 · Cited by 3
Metadata
- Authors
- Böttcher, M., Renner, K., Berger, R., Mentz, K., Thomas, S., Cardenas-Conejo, Z. E., Dettmer, K., Oefner, P. J., Mackensen, A., Kreutz, M., & Mougiakakos, D.
- Affiliations
- Friedrich-Alexander-Universität Erlangen-Nürnberg (DE)
- University Hospital Regensburg (DE)
- University of Regensburg (DE)
- Internal Medicine III, Hematology and Oncology, University Hospital Regensburg, Regensburg, Germany
- Department of Internal Medicine 5, Hematology and Oncology, University of Erlangen-Nuremberg, Erlangen, Germany
- Corresponding author
- Böttcher, Martin
- ORCID
- Venue
- OncoImmunology
- Publisher
- Informa UK Limited
- Published
- 2018-03-26
- Volume
- 7
- Issue
- 7
- Pages
- e1445454
- ISSN
- 2162-4011 (ISSN-L)
- 2162-402X
- PMC
- PMC5993507
- OpenAlex
- W2790027255
- Cited by
- 124
- References
- 69
- Citations by year
- 2026: 8 · 2025: 9 · 2024: 23 · 2023: 12 · 2022: 20 · 2021: 15 · 2020: 16 · 2019: 16 · 2018: 5
- FWCI
- 3.93
- Type
- journal article
- Language
- en
- Open access
- gold
- doi.org
- Licence
- cc-by-nc-nd
- Locations
- OncoImmunology (publishedVersion, cc-by-nc-nd)
- Europe PMC (PubMed Central) (publishedVersion, cc-by-nc-nd)
- PubMed Central (publishedVersion, cc-by-nc-nd)
- PubMed (publishedVersion)
- University of Regensburg Publication Server (University of Regensburg) (acceptedVersion)
- DOAJ (DOAJ: Directory of Open Access Journals) (submittedVersion, cc-by-sa)
- University of Regensburg Publication Server (University of Regensburg)
- Funders
- IZKF Erlangen (Project D27)
- CDC/TR221 (DFG) (Project A06)
- Topics
- Life Sciences › Biochemistry, Genetics and Molecular Biology › Cancer Research › Cancer, Hypoxia, and Metabolism
- Health Sciences › Medicine › Hematology › Acute Myeloid Leukemia Research
- Life Sciences › Immunology and Microbiology › Immunology › Immune cells in cancer
- Keywords
- D-2-hydroxyglutarate, IDH mutation, acute myeloid leukemia, oncometabolites, T cell metabolism, oxidative phosphorylation, Th17 polarization, regulatory T cells, T cell activation, immune evasion
About these checks
Registry, retraction, Cites and statistics results are computed, not judged, with one exception: a printed reference that no index lists is read once by a model before it counts as a citation error. Claims are extracted by a model and kept only when their quote appears verbatim in the text; each cited source is then checked, with a model’s help, for whether it says what the claim relies on. Those verdicts can be wrong — read the claim’s quote and the cited source before relying on one.
Statistics and arithmetic are recomputed, not judged.
Confidence bands are shown only for fields calibrated on our annotated test set. None is calibrated yet, so no band is shown.
What counts as a claim ›How we measure confidence ›How we check this ›
Are you an author, or do you see a problem with this page? Request a review
