

The DOI matches its Crossref record; 71 of the 71 references it cites were found in a registry or an index.
Involvement of ZO-1 in Cadherin-based Cell Adhesion through Its Direct Binding to α Catenin and Actin Filaments
Open accessAbstract
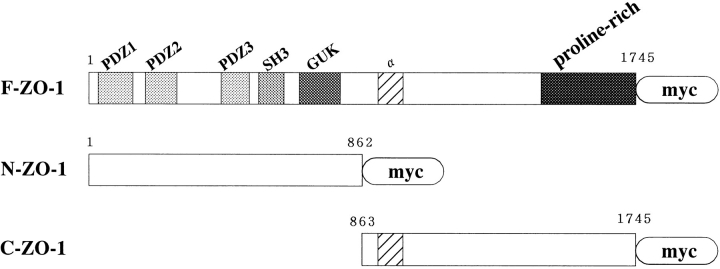
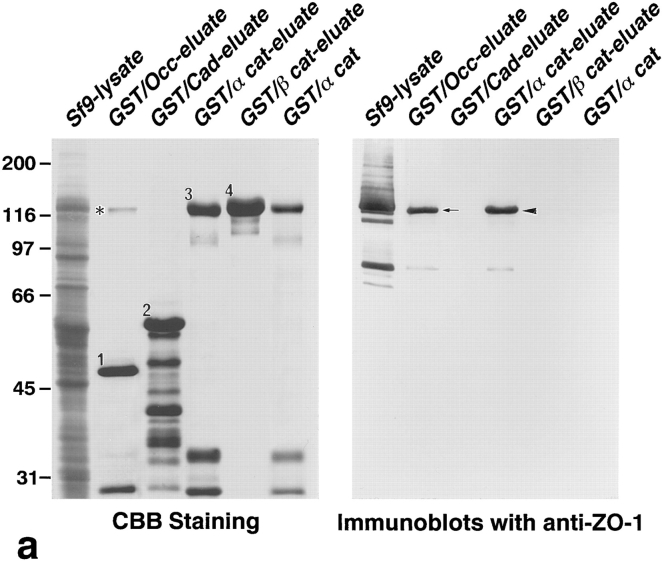
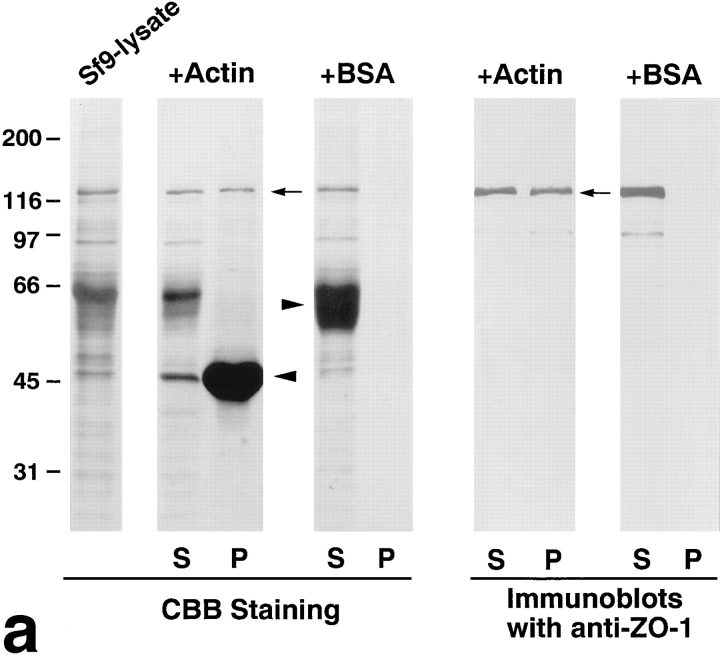
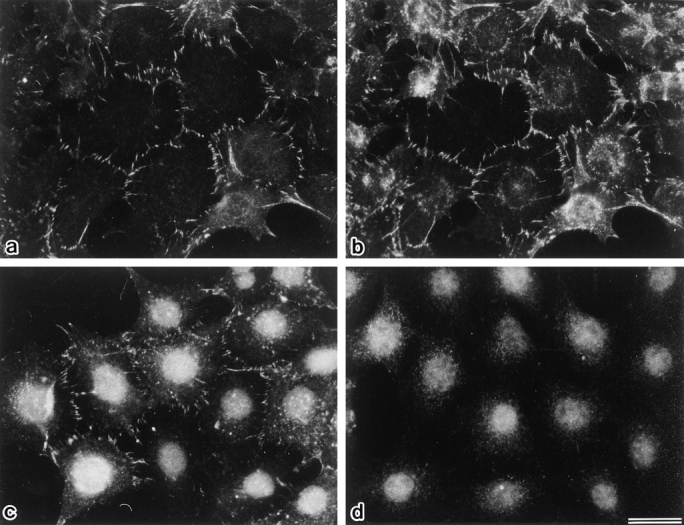
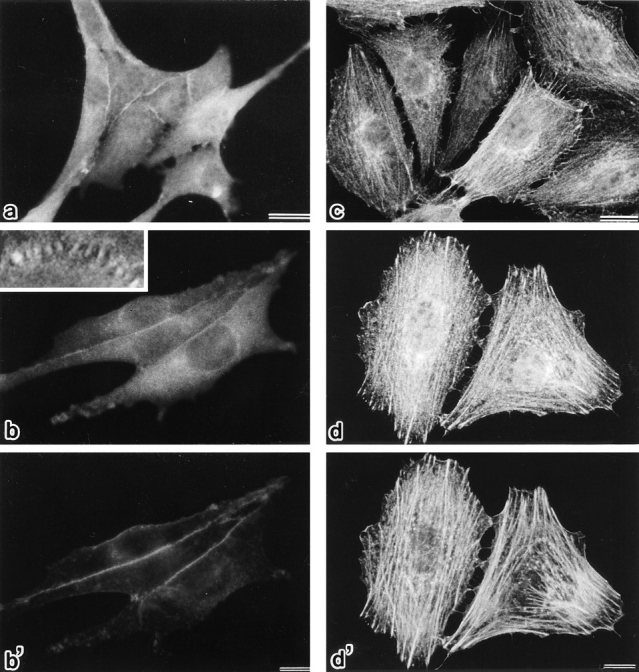
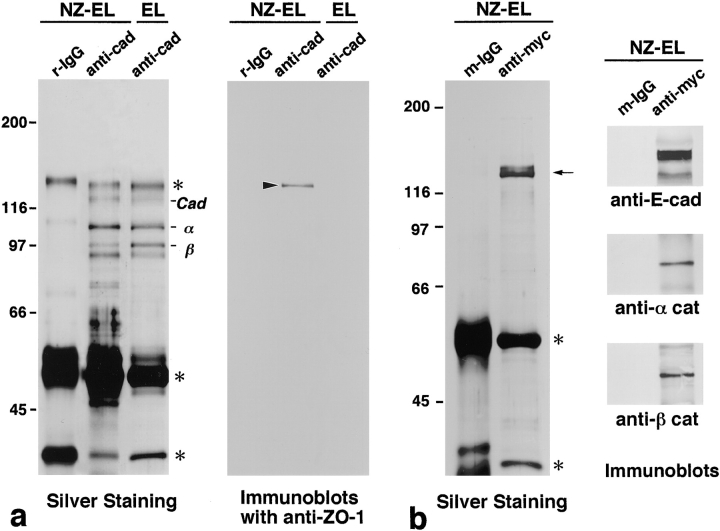
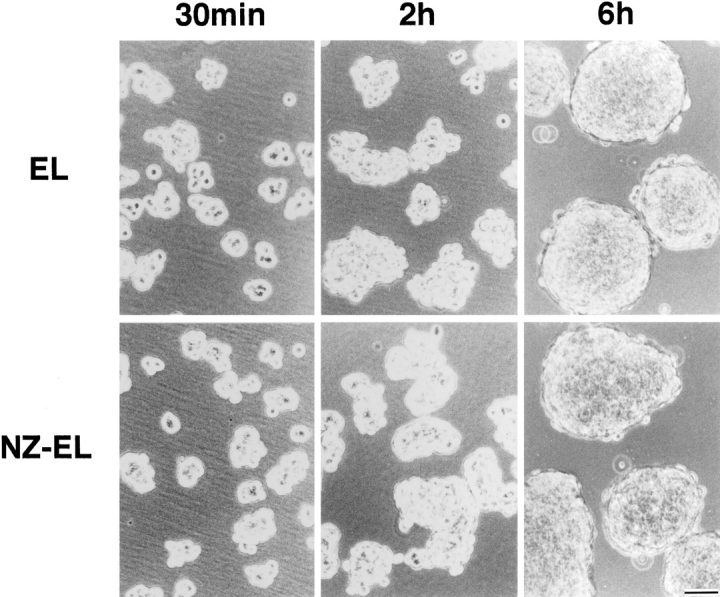
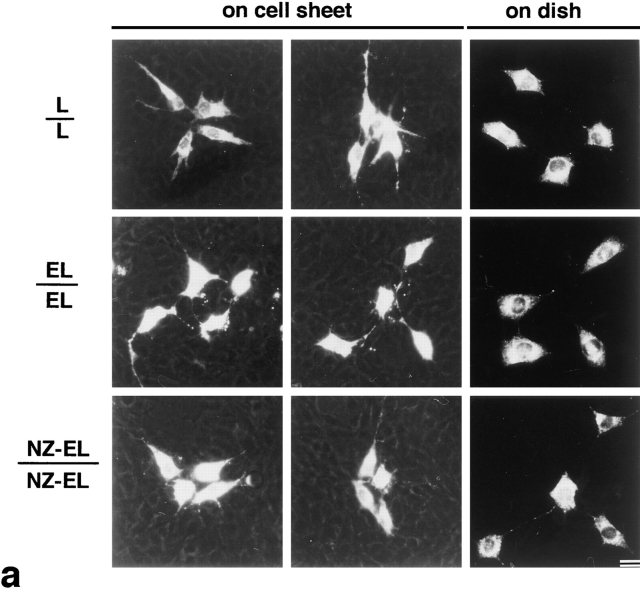
ZO-1, a 220-kD peripheral membrane protein consisting of an amino-terminal half discs large (dlg)-like domain and a carboxyl-terminal half domain, is concentrated at the cadherin-based cell adhesion sites in non-epithelial cells. We introduced cDNAs encoding the full-length ZO-1, its amino-terminal half (N-ZO-1), and carboxyl-terminal half (C-ZO-1) into mouse L fibroblasts expressing exogenous E-cadherin (EL cells). The full-length ZO-1 as well as N-ZO-1 were concentrated at cadherin-based cell–cell adhesion sites. In good agreement with these observations, N-ZO-1 was specifically coimmunoprecipitated from EL transfectants expressing N-ZO-1 (NZ-EL cells) with the E-cadherin/α, β catenin complex. In contrast, C-ZO-1 was localized along actin stress fibers. To examine the molecular basis of the behavior of these truncated ZO-1 molecules, N-ZO-1 and C-ZO-1 were produced in insect Sf9 cells by recombinant baculovirus infection, and their direct binding ability to the cadherin/catenin complex and the actin-based cytoskeleton, respectively, were examined in vitro. Recombinant N-ZO-1 bound directly to the glutathione-S-transferase fusion protein with α catenin, but not to that with β catenin or the cytoplasmic domain of E-cadherin. The dissociation constant between N-ZO-1 and α catenin was ∼0.5 nM. On the other hand, recombinant C-ZO-1 was specifically cosedimented with actin filaments in vitro with a dissociation constant of ∼10 nM. Finally, we compared the cadherin-based cell adhesion activity of NZ-EL cells with that of parent EL cells. Cell aggregation assay revealed no significant differences among these cells, but the cadherin-dependent intercellular motility, i.e., the cell movement in a confluent monolayer, was significantly suppressed in NZ-EL cells. We conclude that in nonepithelial cells, ZO-1 works as a cross-linker between cadherin/catenin complex and the actin-based cytoskeleton through direct interaction with α catenin and actin filaments at its amino- and carboxyl-terminal halves, respectively, and that ZO-1 is a functional component in the cadherin-based cell adhesion system.
Overview
The claims and statistics of this paper haven’t been checked yet.
Run the check — free, no account needed. It reads the open-access text and checks the sources it cites.
Integrity signals
Registry
Cites
Statistics
Figures
Verification
Claims the paper makes
The claims and statistics of this paper haven’t been checked yet.
Run the check — free, no account needed. It reads the open-access text and checks the sources it cites.
Claims other papers make about this one
Each is checked against this paper’s own text: does it say what the citing paper says it does?
The cited source says what the claim attributes to it.
In the citing paper
“For example, the tight junctional marker ZO-1 binds directly to a-catenin and this is considered an intermediate step in the formation of tight junctions (Itoh et al, 1997).”
From E‐cadherin is essential for in vivo epidermal barrier function by regulating tight junctions (2005) · cites this paper as Itoh et al, 1997
Self-check
Percentages, sums and reported differences re-computed from the paper’s own numbers.
The self-check needs the paper’s full text.
Citations
Cites
Cleavage of Structural Proteins during the Assembly of the Head of Bacteriophage T4
LAEMMLI, U. K. (1970) · Nature · doi:10.1038/227680a0 · Cited by 249,961
Raza, H., John, A., & Nemmar, A. (2013) · Cellular Physiology and Biochemistry · doi:10.1159/000350087 · Cited by 47,311
JUNCTIONAL COMPLEXES IN VARIOUS EPITHELIA
Farquhar, M. G., & Palade, G. E. (1963) · The Journal of Cell Biology · doi:10.1083/jcb.17.2.375 · Cited by 3,637
Cadherin Cell Adhesion Receptors as a Morphogenetic Regulator
Takeichi, M. (1991) · Science · doi:10.1126/science.2006419 · Cited by 3,283
Functional interaction of β-catenin with the transcription factor LEF-1
Behrens, J., von Kries, J. P., Kühl, M., Bruhn, L., Wedlich, D., Grosschedl, R., & Birchmeier, W. (1996) · Nature · doi:10.1038/382638a0 · Cited by 2,912
Occludin: a novel integral membrane protein localizing at tight junctions.
Furuse, M., Hirase, T., Itoh, M., Nagafuchi, A., Yonemura, S., Tsukita, S., & Tsukita, S. (1993) · The Journal of cell biology · doi:10.1083/jcb.123.6.1777 · Cited by 2,580
Self-citationDomain Interaction Between NMDA Receptor Subunits and the Postsynaptic Density Protein PSD-95
Kornau, H., Schenker, L. T., Kennedy, M. B., & Seeburg, P. H. (1995) · Science · doi:10.1126/science.7569905 · Cited by 1,916
Stevenson, B. R., Siliciano, J. D., Mooseker, M. S., & Goodenough, D. A. (1986) · The Journal of Cell Biology · doi:10.1083/jcb.103.3.755 · Cited by 1,640
The cadherins: cell-cell adhesion molecules controlling animal morphogenesis
Takeichi, M. (1988) · Development · doi:10.1242/dev.102.4.639 · Cited by 1,615
Ozawa, M., Baribault, H., & Kemler, R. (1989) · The EMBO Journal · doi:10.1002/j.1460-2075.1989.tb03563.x · Cited by 1,396
Morphogenesis of the Polarized Epithelial Cell Phenotype
Rodriguez-Boulan, E. J., & Nelson, W. J. (1989) · Science · doi:10.1126/science.2672330 · Cited by 1,085
Kim, E., Niethammer, M., Rothschild, A., Jan, Y. N., & Sheng, M. (1995) · Nature · doi:10.1038/378085a0 · Cited by 1,003
Furuse, M., Itoh, M., Hirase, T., Nagafuchi, A., Yonemura, S., Tsukita, S., & Tsukita, S. (1994) · The Journal of Cell Biology · doi:10.1083/jcb.127.6.1617 · Cited by 965
Self-citationNuclear localization of β-catenin by interaction with transcription factor LEF-1
Huber, O., Korn, R., McLaughlin, J., Ohsugi, M., Herrmann, B. G., & Kemler, R. (1996) · Mechanisms of Development · doi:10.1016/0925-4773(96)00597-7 · Cited by 855
Cell binding function of E‐cadherin is regulated by the cytoplasmic domain.
Nagafuchi, A., & Takeichi, M. (1988) · The EMBO Journal · doi:10.1002/j.1460-2075.1988.tb03249.x · Cited by 805
Self-citationGumbiner, B., Stevenson, B., & Grimaldi, A. (1988) · The Journal of cell biology · doi:10.1083/jcb.107.4.1575 · Cited by 799
Honig, M. G., & Hume, R. I. (1986) · The Journal of Cell Biology · doi:10.1083/jcb.103.1.171 · Cited by 796
Niethammer, M., Kim, E., & Sheng, M. (1996) · The Journal of Neuroscience · doi:10.1523/jneurosci.16-07-02157.1996 · Cited by 750
Transformation of cell adhesion properties by exogenously introduced E-cadherin cDNA
Nagafuchi, A., Shirayoshi, Y., Okazaki, K., Yasuda, K., & Takeichi, M. (1987) · Nature · doi:10.1038/329341a0 · Cited by 747
Self-citationOzawa, M., Ringwald, M., & Kemler, R. (1990) · Proceedings of the National Academy of Sciences · doi:10.1073/pnas.87.11.4246 · Cited by 747
Rimm, D. L., Koslov, E. R., Kebriaei, P., Cianci, C. D., & Morrow, J. S. (1995) · Proceedings of the National Academy of Sciences · doi:10.1073/pnas.92.19.8813 · Cited by 735
Expressed recombinant cadherins mediate cell sorting in model systems
Nose, A., Nagafuchi, A., & Takeichi, M. (1988) · Cell · doi:10.1016/0092-8674(88)90114-6 · Cited by 672
Self-citationSignal transduction through beta-catenin and specification of cell fate during embryogenesis.
Miller, J. R., & Moon, R. T. (1996) · Genes & Development · doi:10.1101/gad.10.20.2527 · Cited by 656
Interaction of alpha-actinin with the cadherin/catenin cell-cell adhesion complex via alpha-catenin.
Knudsen, K. A., Soler, A. P., Johnson, K. R., & Wheelock, M. J. (1995) · The Journal of Cell Biology · doi:10.1083/jcb.130.1.67 · Cited by 650
Hinck, L., Näthke, I. S., Papkoff, J. S., & Nelson, W. J. (1994) · The Journal of Cell Biology · doi:10.1083/jcb.125.6.1327 · Cited by 628
Functional correlation between cell adhesive properties and some cell surface proteins.
Takeichi, M. (1977) · The Journal of Cell Biology · doi:10.1083/jcb.75.2.464 · Cited by 626
A Homolog of the armadillo Protein in Drosophila (Plakoglobin) Associated with E-Cadherin
McCrea, P. D., Turck, C. W., & Gumbiner, B. M. (1991) · Science · doi:10.1126/science.1962194 · Cited by 624
Hirao, M., Sato, N., Kondo, T., Yonemura, S., Monden, M., Sasaki, T., Takai, Y., Tsukita, S., & Tsukita, S. (1996) · The Journal of Cell Biology · doi:10.1083/jcb.135.1.37 · Cited by 592
Self-citationItoh, M., Nagafuchi, A., Yonemura, S., Kitani-Yasuda, T., Tsukita, S., & Tsukita, S. (1993) · The Journal of Cell Biology · doi:10.1083/jcb.121.3.491 · Cited by 576
Self-citationAssembly of the cadherin-catenin complex in vitro with recombinant proteins
Aberle, H., Butz, S., Stappert, J., Weissig, H., Kemler, R., & Hoschuetzky, H. (1994) · Journal of Cell Science · doi:10.1242/jcs.107.12.3655 · Cited by 551
Funayama, N., Fagotto, F., McCrea, P. D., & Gumbiner, B. M. (1995) · The Journal of Cell Biology · doi:10.1083/jcb.128.5.959 · Cited by 545
Structure, biochemistry, and assembly of epithelial tight junctions
Gumbiner, B. (1987) · American Journal of Physiology-Cell Physiology · doi:10.1152/ajpcell.1987.253.6.c749 · Cited by 531
Identification of a 160-kDa polypeptide that binds to the tight junction protein ZO-1.
Gumbiner, B., Lowenkopf, T., & Apatira, D. (1991) · Proceedings of the National Academy of Sciences · doi:10.1073/pnas.88.8.3460 · Cited by 523
Structure, function, and regulation of cellular tight junctions
Schneeberger, E. E., & Lynch, R. D. (1992) · American Journal of Physiology-Lung Cellular and Molecular Physiology · doi:10.1152/ajplung.1992.262.6.l647 · Cited by 518
Cingulin, a new peripheral component of tight junctions
Citi, S., Sabanay, H., Jakes, R., Geiger, B., & Kendrick‐Jones, J. (1988) · Nature · doi:10.1038/333272a0 · Cited by 515
Nagafuchi, A., Takeichi, M., & Tsukita, S. (1991) · Cell · doi:10.1016/0092-8674(91)90392-c · Cited by 494
Self-citationWillott, E., Balda, M. S., Fanning, A. S., Jameson, B., Itallie, C. M. V., & Anderson, J. M. (1993) · Proceedings of the National Academy of Sciences · doi:10.1073/pnas.90.16.7834 · Cited by 469
Jesaitis, L. A., & Goodenough, D. A. (1994) · The Journal of Cell Biology · doi:10.1083/jcb.124.6.949 · Cited by 458
Nagafuchi, A., & Takeichi, M. (1989) · Cell Regulation · doi:10.1091/mbc.1.1.37 · Cited by 434
Self-citationHirano, S., Nose, A., Hatta, K., Kawakami, A., & Takeichi, M. (1987) · The Journal of Cell Biology · doi:10.1083/jcb.105.6.2501 · Cited by 426
Böller, K., Vestweber, D., & Kemler, R. (1985) · The Journal of Cell Biology · doi:10.1083/jcb.100.1.327 · Cited by 422
Yonemura, S., Itoh, M., Nagafuchi, A., & Tsukita, S. (1995) · Journal of Cell Science · doi:10.1242/jcs.108.1.127 · Cited by 402
Self-citationSignal transduction by β-catenin
Gumbiner, B. M. (1995) · Current Opinion in Cell Biology · doi:10.1016/0955-0674(95)80104-9 · Cited by 394
Nagafuchi, A., Ishihara, S., & Tsukita, S. (1994) · The Journal of Cell Biology · doi:10.1083/jcb.127.1.235 · Cited by 386
Self-citationBreaking through the tight junction barrier.
Gumbiner, B. M. (1993) · The Journal of Cell Biology · doi:10.1083/jcb.123.6.1631 · Cited by 386
Molecular organization of the uvomorulin-catenin complex.
Ozawa, M., & Kemler, R. (1992) · The Journal of Cell Biology · doi:10.1083/jcb.116.4.989 · Cited by 371
Anderson, J. M., Stevenson, B. R., Jesaitis, L. A., Goodenough, D. A., & Mooseker, M. S. (1988) · The Journal of Cell Biology · doi:10.1083/jcb.106.4.1141 · Cited by 368
Gottardi, C. J., Arpin, M., Fanning, A. S., & Louvard, D. (1996) · Proceedings of the National Academy of Sciences · doi:10.1073/pnas.93.20.10779 · Cited by 367
The uvomorulin-anchorage protein alpha catenin is a vinculin homologue.
Herrenknecht, K., Ozawa, M., Eckerskorn, C., Lottspeich, F., Lenter, M., & Kemler, R. (1991) · Proceedings of the National Academy of Sciences · doi:10.1073/pnas.88.20.9156 · Cited by 359
Molecular linkage between cadherins and actin filaments in cell—cell adherens junctions
Tsukita, S., Tsukita, S., Nagafuchi, A., & Yonemura, S. (1992) · Current Opinion in Cell Biology · doi:10.1016/0955-0674(92)90108-o · Cited by 349
Self-citationRajasekaran, A., Hojo, M., Huima, T., & Rodriguez-Boulan, E. J. (1996) · The Journal of Cell Biology · doi:10.1083/jcb.132.3.451 · Cited by 340
Genetic and biochemical dissection of protein linkages in the cadherin-catenin complex.
Jou, T., Stewart, D. B., Stappert, J., Nelson, W. J., & Marrs, J. A. (1995) · Proceedings of the National Academy of Sciences · doi:10.1073/pnas.92.11.5067 · Cited by 334
Ando‐Akatsuka, Y., Saitou, M., Hirase, T., Kishi, M., Sakakibara, A., Itoh, M., Yonemura, S., Furuse, M., & Tsukita, S. (1996) · The Journal of Cell Biology · doi:10.1083/jcb.133.1.43 · Cited by 332
Self-citationNäthke, I. S., Hinck, L., Swedlow, J. R., Papkoff, J. S., & Nelson, W. J. (1994) · The Journal of Cell Biology · doi:10.1083/jcb.125.6.1341 · Cited by 321
Symplekin, a novel type of tight junction plaque protein.
Keon, B. H., Schäfer, S. C., Kuhn, C., Gründ, C., & Franke, W. W. (1996) · The Journal of Cell Biology · doi:10.1083/jcb.134.4.1003 · Cited by 285
Oyama, T., Kanai, Y., Ochiai, A., Akimoto, S., Oda, T., Yanagihara, K., Nagafuchi, A., Tsukita, S., Shibamoto, S., & Ito, F. (1994) · PubMed · Cited by 282
Self-citationZhong, Y., Saitoh, T., Minase, T., Sawada, N., Enomoto, K., & Mori, M. (1993) · The Journal of Cell Biology · doi:10.1083/jcb.120.2.477 · Cited by 266
Itoh, M., Yonemura, S., Nagafuchi, A., Tsukita, S., & Tsukita, S. (1991) · The Journal of Cell Biology · doi:10.1083/jcb.115.5.1449 · Cited by 235
Self-citationA 135‐kd membrane protein of intercellular adherens junctions.
Volk, T., & Geiger, B. (1984) · The EMBO Journal · doi:10.1002/j.1460-2075.1984.tb02123.x · Cited by 230
Kemler, R. (1992) · Seminars in Cell Biology · doi:10.1016/s1043-4682(10)80011-x · Cited by 227
ZO-1, DlgA and PSD-95/SAP90: homologous proteins in tight, septate and synaptic cell junctions
Woods, D. F., & Bryant, P. J. (1993) · Mechanisms of Development · doi:10.1016/0925-4773(93)90059-7 · Cited by 217
Early contacts between fibroblasts
Heaysman, J. E. M., & Pegrum, S. M. (1973) · Experimental Cell Research · doi:10.1016/0014-4827(73)90039-6 · Cited by 197
Submembranous junctional plaque proteins include potential tumor suppressor molecules.
Tsukita, S., Itoh, M., Nagafuchi, A., Yonemura, S., & Tsukita, S. (1993) · The Journal of Cell Biology · doi:10.1083/jcb.123.5.1049 · Cited by 179
Self-citationE‐cadherin as a tumor (invasion) suppressor gene
Birchmeier, W. (1995) · BioEssays · doi:10.1002/bies.950170203 · Cited by 177
Localization and differential expression of two isoforms of the tight junction protein ZO-1
Willott, E., Balda, M. S., Heintzelman, M. B., Jameson, B., & Anderson, J. M. (1992) · American Journal of Physiology-Cell Physiology · doi:10.1152/ajpcell.1992.262.5.c1119 · Cited by 174
Mechanism of K+-induced actin assembly.
Pardee, J. D., & Spudich, J. A. (1982) · The Journal of Cell Biology · doi:10.1083/jcb.93.3.648 · Cited by 133
Isolation of cell-to-cell adherens junctions from rat liver.
Tsukita, S., & Tsukita, S. (1989) · The Journal of Cell Biology · doi:10.1083/jcb.108.1.31 · Cited by 119
Self-citationTight junctions, membrane-associated guanylate kinases and cell signaling
Kim, S. (1995) · Current Opinion in Cell Biology · doi:10.1016/0955-0674(95)80105-7 · Cited by 113
Anderson, J. M., Fanning, A. S., Lapierre, L. A., & Itallie, C. M. V. (1995) · Biochemical Society Transactions · doi:10.1042/bst0230470 · Cited by 91
Nagafuchi, A., & Tsukita, S. (1994) · Development Growth & Differentiation · doi:10.1111/j.1440-169x.1994.00059.x · Cited by 68
Self-citationHirao, M. (1996) · OUKA (Osaka University Knowledge Archive) (Osaka University) · doi:10.11501/3119666 · Cited by 13
Cited by
Sorted by citations
Multifunctional strands in tight junctions
Tsukita, S., Furuse, M., & Itoh, M. (2001) · Nature reviews. Molecular cell biology · doi:10.1038/35067088 · Cited by 2,578
Self-citationAdherens and tight junctions: Structure, function and connections to the actin cytoskeleton
Hartsock, A., & Nelson, W. J. (2007) · Biochimica et Biophysica Acta (BBA) - Biomembranes · doi:10.1016/j.bbamem.2007.07.012 · Cited by 1,637
Regulation of cadherin-mediated adhesion in morphogenesis
Gumbiner, B. M. (2005) · Nature Reviews Molecular Cell Biology · doi:10.1038/nrm1699 · Cited by 1,523
Fanning, A. S., Jameson, B. J., Jesaitis, L. A., & Anderson, J. M. (1998) · Journal of Biological Chemistry · doi:10.1074/jbc.273.45.29745 · Cited by 1,432
The tight junction: a multifunctional complex.
Schneeberger, E., & Lynch, R. D. (2004) · American Journal of Physiology - Cell Physiology · doi:10.1152/ajpcell.00558.2003 · Cited by 1,450
Metadata
- Authors
- Itoh, M., Nagafuchi, A., Moroi, S., & Tsukita, S.
- Affiliations
- Kyoto University (JP)
- *Department of Cell Biology, Faculty of Medicine, Kyoto University, Kyoto 606, Japan; and ‡Department of Urology, Faculty of Medicine, Kyoto University, Kyoto 606, Japan
- Venue
- The Journal of Cell Biology
- Publisher
- Rockefeller University Press
- Published
- 1997-07-14
- Volume
- 138
- Issue
- 1
- Pages
- 181-192
- ISSN
- 0021-9525 (ISSN-L)
- 1540-8140
- PMC
- PMC2139940
- OpenAlex
- W2102090879
- Cited by
- 677
- References
- 71
- Citations by year
- 2026: 10 · 2025: 13 · 2024: 15 · 2023: 14 · 2022: 20 · 2021: 18 · 2020: 21 · 2019: 17 · 2018: 21 · 2017: 21 · 2016: 13 · 2015: 9 · 2014: 15 · 2013: 30 · 2012: 22
- FWCI
- 14.93
- Type
- journal article
- Language
- en
- Open access
- bronze
- doi.org
- Locations
- The Journal of Cell Biology (publishedVersion)
- PubMed Central (publishedVersion, cc-by-nc-sa)
- PubMed (publishedVersion)
- Topics
- Health Sciences › Medicine › Immunology and Allergy › Cell Adhesion Molecules Research
- Life Sciences › Biochemistry, Genetics and Molecular Biology › Cell Biology › Skin and Cellular Biology Research
- Life Sciences › Neuroscience › Neurology › Barrier Structure and Function Studies
- Keywords
- ZO-1, E-cadherin, alpha-catenin, F-actin, cell-cell adhesion, stress fibers, cell aggregation, protein-protein interaction, L fibroblasts
- MeSH terms
- Actins, Animals, Cell Adhesion, Cell Line, Cytoskeletal Proteins, L Cells, Membrane Proteins, Phosphoproteins, Recombinant Fusion Proteins, Trans-Activators, Cadherins, Spodoptera, beta Catenin, alpha Catenin, Mice, Rats, Zonula Occludens-1 Protein
About these checks
Registry, retraction, Cites and statistics results are computed, not judged, with one exception: a printed reference that no index lists is read once by a model before it counts as a citation error. Claims are extracted by a model and kept only when their quote appears verbatim in the text; each cited source is then checked, with a model’s help, for whether it says what the claim relies on. Those verdicts can be wrong — read the claim’s quote and the cited source before relying on one.
Statistics and arithmetic are recomputed, not judged.
Confidence bands are shown only for fields calibrated on our annotated test set. None is calibrated yet, so no band is shown.
What counts as a claim ›How we measure confidence ›How we check this ›
Are you an author, or do you see a problem with this page? Request a review
