

The DOI matches its Crossref record; 58 of the 58 references it cites were found in a registry or an index.
Early aging–associated phenotypes in Bub3/Rae1 haploinsufficient mice
Open accessAbstract
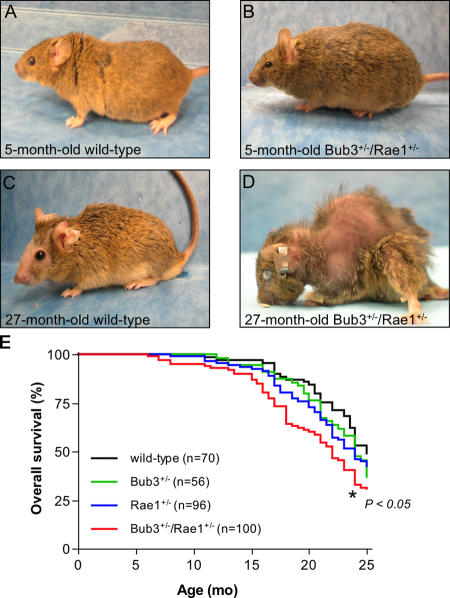
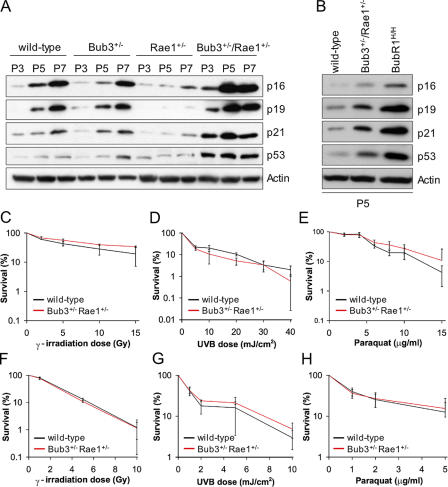
Aging is a highly complex biological process that is believed to involve multiple mechanisms. Mice that have small amounts of the mitotic checkpoint protein BubR1 age much faster than normal mice, but whether other mitotic checkpoint genes function to prevent the early onset of aging is unknown. In this study, we show that several aging-associated phenotypes appear early in mice that are double haploinsufficient for the mitotic checkpoint genes Bub3 and Rae1 but not in mice that are single haploinsufficient for these genes. Mouse embryonic fibroblasts (MEFs) from Bub3/Rae1 haploinsufficient mice undergo premature senescence and accumulate high levels of p19, p53, p21, and p16, whereas MEFs from single haploinsufficient mice do not. Furthermore, although BubR1 hypomorphic mice have less aneuploidy than Bub3/Rae1 haploinsufficient mice, they age much faster. Our findings suggest that early onset of aging-associated phenotypes in mice with mitotic checkpoint gene defects is linked to cellular senescence and activation of the p53 and p16 pathways rather than to aneuploidy.
Overview
The claims and statistics of this paper haven’t been checked yet.
Run the check — free, no account needed. It reads the open-access text and checks the sources it cites.
Integrity signals
Registry
Cites
Statistics
Figures
Verification
Claims the paper makes
The claims and statistics of this paper haven’t been checked yet.
Run the check — free, no account needed. It reads the open-access text and checks the sources it cites.
Claims other papers make about this one
Each is checked against this paper’s own text: does it say what the citing paper says it does?
In the citing paper
“reducing the level of various mitotic checkpoint genes leads to chromosomal instability, augmented aneuploidy and the phenotypic appearance of progeroid mice 36, 37”
From The common biology of cancer and ageing (2007) · cites this paper as [37]
Self-check
Percentages, sums and reported differences re-computed from the paper’s own numbers.
The self-check needs the paper’s full text.
Citations
Cites
Genetic instabilities in human cancers
Lengauer, C., Kinzler, K. W., & Vogelstein, B. (1998) · Nature · doi:10.1038/25292 · Cited by 4,168 · cited 1×
“Because aneuploidy occurs with such high frequency, it has been suggested that an euploidy is an essential step in the process of tumorigenesis (Lengauer et al., 1998).”
BackgroundSenescent cells, tumor suppression, and organismal aging: good citizens, bad neighbors
Campisi, J. (2005) · Cell · doi:10.1016/j.cell.2005.02.003 · Cited by 2,379 · cited 1×
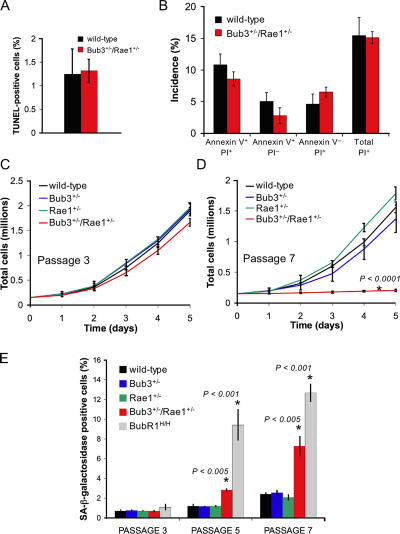
“Combined haploinsuffi ciency of Bub3 and Rae1 results in premature senescence We next investigated whether combined haploinsuffi ciency of Bub3 and Rae1 triggers cell death or cellular senescence, which are two processes that have been linked to aging (Campisi, 2005; Lombard et al., 2005).”
BackgroundThe p53 pathway: positive and negative feedback loops
Harris, S. L., & Levine, A. J. (2005) · Oncogene · doi:10.1038/sj.onc.1208615 · Cited by 1,967
p53 mutant mice that display early ageing-associated phenotypes
Tyner, S. D., Venkatachalam, S., Choi, J., Jones, S., Ghebranious, N., Igelmann, H., Lu, X., Soron, G., Cooper, B., Brayton, C., et al. (2002) · Nature · doi:10.1038/415045a · Cited by 1,459 · cited 1×
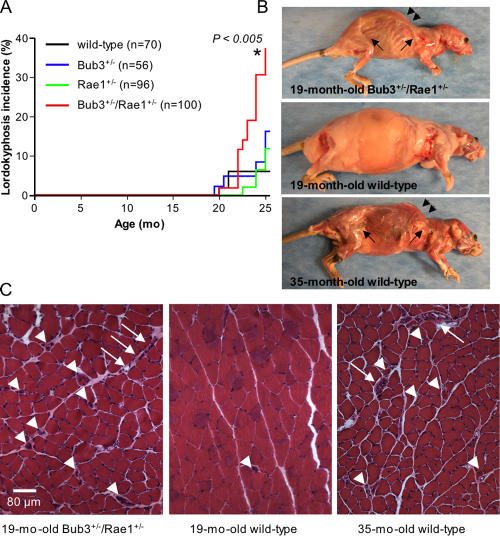
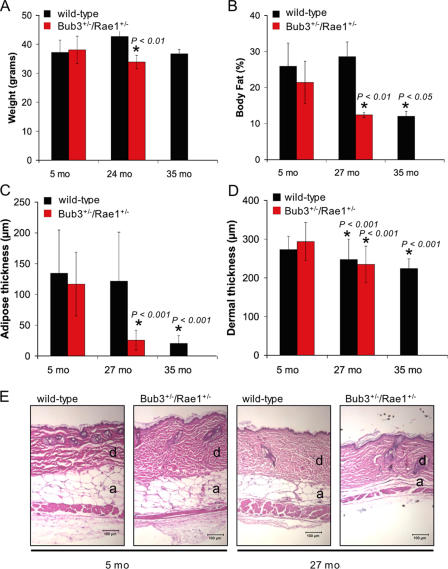
“Reduced dermal thickness and subdermal adipose are characteristics of aged mice (de Boer et al., 2002; Tyner et al., 2002).”
BackgroundOn the road to cancer: aneuploidy and the mitotic checkpoint
Kops, G. J. P. L., Weaver, B. A. A., & Cleveland, D. W. (2005) · Nature reviews. Cancer · doi:10.1038/nrc1714 · Cited by 1,201
The signals and pathways activating cellular senescence
Ben-Porath, I., & Weinberg, R. A. (2005) · The International Journal of Biochemistry & Cell Biology · doi:10.1016/j.biocel.2004.10.013 · Cited by 1,046
DNA Repair, Genome Stability, and Aging
Lombard, D. B., Chua, K. F., Mostoslavsky, R., Franco, S., Gostissa, M., & Alt, F. W. (2005) · Cell · doi:10.1016/j.cell.2005.01.028 · Cited by 944
The Anaphase-Promoting Complex
Peters, J. (2002) · Molecular Cell · doi:10.1016/s1097-2765(02)00540-3 · Cited by 928
Sudakin, V., Chan, G. K. T., & Yen, T. J. (2001) · The Journal of Cell Biology · doi:10.1083/jcb.200102093 · Cited by 927
BubR1 insufficiency causes early onset of aging-associated phenotypes and infertility in mice
Baker, D. J., Jeganathan, K. B., Cameron, J. D., Thompson, M., Juneja, S., Kopecka, A., Kumar, R., Jenkins, R. B., de Groen, P. C., Roche, P., et al. (2004) · Nature Genetics · doi:10.1038/ng1382 · Cited by 731
Self-citation
Research works printed but not linked: 1
- 2004, Blood., 103, 1278
Cited by
Sorted by citations
Items 101–176 of 176
Identification of genes that are essential to restrict genome duplication to once per cell division
Vassilev, A. P., Lee, C. Y., Vassilev, B., Zhu, W., Ormanoglu, P., Martin, S. E., & Depamphilis, M. (2016) · Oncotarget · doi:10.18632/oncotarget.9008 · Cited by 27
Aziz, K., Sieben, C. J., Jeganathan, K. B., Hamada, M., Davies, B. A., Velasco, R. O. F., Rahman, N., Katzmann, D. J., & van Deursen, J. M. (2018) · Journal of Clinical Investigation · doi:10.1172/jci120316 · Cited by 27
Self-citationNovel Interactions between Actin and the Proteasome Revealed by Complex Haploinsufficiency
Haarer, B. K., Aggeli, D., Viggiano, S. C., Burke, D. J., & Amberg, D. C. (2011) · PLoS Genetics · doi:10.1371/journal.pgen.1002288 · Cited by 25
Differential mitotic checkpoint protein requirements in somatic and germ cells
Jeganathan, K. B., & van Deursen, J. M. A. (2006) · Biochemical Society Transactions · doi:10.1042/bst0340583 · Cited by 27
Self-citationEmerging links among Chromosome Instability (CIN), cancer, and aging
Rao, C. V., Asch, A. S., & Yamada, H. Y. (2016) · Molecular Carcinogenesis · doi:10.1002/mc.22539 · Cited by 27
p31comet Induces Cellular Senescence through p21 Accumulation and Mad2 Disruption
Yun, M., Han, Y.-H., Yoon, S. H., Kim, H. Y., Kim, B., Ju, Y.-J., Kang, C., Jang, S. H., Chung, H. Y., Lee, S., et al. (2009) · Molecular Cancer Research · doi:10.1158/1541-7786.mcr-08-0056 · Cited by 25
USP11 deubiquitinates RAE1 and plays a key role in bipolar spindle formation
Stockum, A., Snijders, A. P., & Maertens, G. N. (2018) · PLoS ONE · doi:10.1371/journal.pone.0190513 · Cited by 24
Chromosomal instability and pro-inflammatory response in aging
Barroso‐Vilares, M., & Logarinho, E. (2019) · Mechanisms of Ageing and Development · doi:10.1016/j.mad.2019.111118 · Cited by 26
BUB3, beyond the Simple Role of Partner
Silva, P. M. A., & Bousbaa, H. (2022) · Pharmaceutics · doi:10.3390/pharmaceutics14051084 · Cited by 25
MTBP plays a crucial role in mitotic progression and chromosome segregation
Agarwal, N. A., Tochigi, Y., Adhikari, A. S., Cui, S., Cui, Y. R., & Iwakuma, T. (2011) · Cell Death and Differentiation · doi:10.1038/cdd.2010.189 · Cited by 23
Watanabe, S., Yamamoto, T. G., & Kitagawa, R. (2008) · The EMBO Journal · doi:10.1038/emboj.2008.32 · Cited by 21
Aurea Mediocritas: The Importance of a Balanced GenomePreprint
Varetti, G., Pellman, D. S., & Gordon, D. J. (2014) · Cold Spring Harbor Perspectives in Biology · doi:10.1101/cshperspect.a015842 · Cited by 22
Karyotype Aberrations in Action: The Evolution of Cancer Genomes and the Tumor Microenvironment
Baudoin, N. C., & Bloomfield, M. (2021) · Genes · doi:10.3390/genes12040558 · Cited by 20
RAE1 mediated ZEB1 expression promotes epithelial–mesenchymal transition in breast cancer
Oh, J. H., Lee, J., Yu, S., Cho, Y., Hur, S., Nam, K. T., & Kim, M. H. (2019) · Scientific Reports · doi:10.1038/s41598-019-39574-8 · Cited by 19
BubR1 alterations that reinforce mitotic surveillance act against aneuploidy and cancer
Weaver, R. L., Limzerwala, J. F., Naylor, R. M., Jeganathan, K. B., Baker, D. J., & van Deursen, J. M. (2016) · eLife · doi:10.7554/elife.16620 · Cited by 21
Self-citationPremature aging syndrome showing random chromosome number instabilities with CDC20 mutation
Fujita, H., Sasaki, T., Miyamoto, T., Akutsu, S. N., Sato, S., Mori, T., Nakabayashi, K., Hata, K., Suzuki, H., Kosaki, K., et al. (2020) · Aging Cell · doi:10.1111/acel.13251 · Cited by 19
Oh, J. H., Hur, H., Lee, J., Kim, Y., Seo, Y., & Kim, M. H. (2017) · Scientific Reports · doi:10.1038/srep42256 · Cited by 17
Whole chromosome aneuploidy in the brain of Bub1bH/Hand Ercc1−/Δ7mice
Andriani, G. A., Faggioli, F., Baker, D. J., Dollé, M. E. T., Sellers, R. S., Hébert, J. M., STEEG, H. V., Hoeijmakers, J. H. J., Vijg, J., & Montagna, C. (2015) · Human Molecular Genetics · doi:10.1093/hmg/ddv612 · Cited by 16
Self-citationp53 mediates hydroxyurea resistance in aneuploid cells of colon cancer
Fang, X., Yin, H., Zhang, H., Wu, F., Liu, Y., Fu, Y., Yu, D., & Zong, L. (2019) · Experimental Cell Research · doi:10.1016/j.yexcr.2019.01.013 · Cited by 16
A Reassessment of Genes Modulating Aging in Mice Using Demographic Measurements of the Rate of Aging
de Magalhães, J. P., Thompson, L. M., de Lima, I., Gaskill, D., Li, X., Thornton, D., Yang, C., & Palmer, D. H. (2018) · Genetics · doi:10.1534/genetics.118.300821 · Cited by 17
Von Hippel-Lindau gene product directs cytokinesis: a new tumor suppressor function
Sinha, S., Mondal, G., Hwang, E. J., Han, D. W., Dutta, S. K., Iyer, S. R., Karumanchi, S. A., Kim, K. I., Couch, F. J., & Mukhopadhyay, D. (2011) · Journal of Cell Science · doi:10.1242/jcs.087122 · Cited by 16
The Aging Adipose Organ: Lipid Redistribution, Inflammation, and Cellular Senescence
Stout, M. B., Tchkonia, T., & Kirkland, J. L. (2014) · Humana Press eBooks · doi:10.1007/978-1-62703-770-9_5 · Cited by 15
Cancer and aging: The molecular pathways
Bassi, P., & Sacco, E. (2009) · Urologic Oncology Seminars and Original Investigations · doi:10.1016/j.urolonc.2009.07.013 · Cited by 16
Mosaic variegated aneuploidy in development, ageing and cancer
Malumbres, M., & Villarroya‐Beltri, C. (2024) · Nature Reviews Genetics · doi:10.1038/s41576-024-00762-6 · Cited by 14
Centromeres in cancer: Unraveling the link between chromosomal instability and tumorigenesis
Fath, M. K., Nazari, A., Parsania, N., Behboodi, P., Ketabi, S. S., Razmjouei, P., Farzam, F., Shafagh, S.-G., & Nabi‐Afjadi, M. (2024) · Medical Oncology · doi:10.1007/s12032-024-02524-0 · Cited by 15
García–Martínez, J., Bakker, B., Schukken, K. M., Simon, J. E., & Foijer, F. (2016) · World Journal of Stem Cells · doi:10.4252/wjsc.v8.i6.216 · Cited by 16
Metastasis and chemoresistance in breast cancer: Crucial function of ZEB1/2 proteins
Doodmani, S. M., Safari, M. H., Akbari, M., Farahani, N., Alimohammadi, M., Aref, A. R., Tajik, F., Maghsoodlou, A., Daneshi, S., Tabari, T., et al. (2025) · Pathology - Research and Practice · doi:10.1016/j.prp.2025.155838 · Cited by 13
Contribution of BubR1 to oxidative stress‐induced aneuploidy in p53‐deficient cells
Ikawa‐Yoshida, A., Ando, K., Oki, E., Saeki, H., Kumashiro, R., Taketani, K., Ida, S., Tokunaga, E., Kitao, H., Morita, M., et al. (2013) · Cancer Medicine · doi:10.1002/cam4.101 · Cited by 13
Prinz, F., Puetter, V., Holton, S. J., Andres, D., Stegmann, C. M., Kwiatkowski, D., Prechtl, S., Petersen, K., Beckmann, G., Kreft, B., et al. (2016) · Journal of Biological Chemistry · doi:10.1074/jbc.m115.702142 · Cited by 13
The establishment of mitotic errors-driven senescence depends on autophagy
Goutas, A., Outskouni, Z., Papathanasiou, I. V., Georgakopoulou, A., Karpetas, G. E., Gonos, E. S., & Trachana, V. (2023) · Redox Biology · doi:10.1016/j.redox.2023.102701 · Cited by 14
Genetics of proliferative aging
Zucchero, T. M., & Ahmed, S. C. (2006) · Experimental Gerontology · doi:10.1016/j.exger.2006.06.057 · Cited by 10
Tilston, V., Taylor, S. S., & Perera, D. (2009) · BMC Research Notes · doi:10.1186/1756-0500-2-190 · Cited by 11
Reducing the aneuploid cell burden – cell competition and the ribosome connection
Baker, N. E., & Montagna, C. (2022) · Disease Models & Mechanisms · doi:10.1242/dmm.049673 · Cited by 10
Spindle assembly checkpoint, aneuploidy and tumorigenesis
Li, M., & Zhang, P. (2009) · Cell Cycle · doi:10.4161/cc.8.21.9688 · Cited by 10
Chromosome Instability ( CIN ), Aneuploidy and Cancer
Yuen, K. W. Y. (2010) · Wiley eBooks · doi:10.1002/9780470015902.a0022413 · Cited by 9
Mitotic Errors Promote Genomic Instability and Leukemia in a Novel Mouse Model of Fanconi Anemia
Edwards, D. M., Mitchell, D. K., Sater, Z. A., Chan, K.-K., Sun, Z., Sheth, A. S., He, Y., Jiang, L., Yuan, J., Sharma, R., et al. (2021) · Frontiers in Oncology · doi:10.3389/fonc.2021.752933 · Cited by 9
Bub1 and Bub3 regulate metabolic adaptation via macrolipophagy in Drosophila
Zhang, Q., Zheng, H., Yang, S., Feng, T., Jie, M., Chen, H., & Jiang, H. (2023) · Cell Reports · doi:10.1016/j.celrep.2023.112343 · Cited by 8
Dai, W. H., & Wang, X. (2006) · Science of Aging Knowledge Environment · doi:10.1126/sageke.2006.7.pe9 · Cited by 7
Li, T., Bai, H., Zhang, J., Kang, X.-H., & Qu, Y.-Q. (2024) · COPD Journal of Chronic Obstructive Pulmonary Disease · doi:10.1080/15412555.2024.2379811 · Cited by 5
Song, J., Sandoval, R., Pilkinton, M. A., Tian, X., Raychaudhuri, P., & Colamonici, O. R. (2010) · Oncogene · doi:10.1038/onc.2009.485 · Cited by 5
Chen, F., Jiao, X., Meng, F., Wang, Y., Ding, Z., Miao, Y., Xiong, J., & Huo, L. (2021) · International Journal of Molecular Sciences · doi:10.3390/ijms22094841 · Cited by 5
Sousa-Guimarães, S., Sunkel, C. E., & Malmanche, N. (2011) · G3 Genes Genomes Genetics · doi:10.1534/g3.111.000265 · Cited by 5
STIL overexpression shortens lifespan and reduces tumor formation in mice
Moussa, A.-T., Cosenza, M. R., Wohlfromm, T., Brobeil, K., Hill, A. D., Patrizi, A., Müller‐Decker, K., Holland‐Letz, T., Jauch, A. S., Kraft, B. N., et al. (2024) · PLoS Genetics · doi:10.1371/journal.pgen.1011460 · Cited by 6
Yamada, H. Y., & Gorbsky, G. J. (2006) · Biological Procedures Online · doi:10.1251/bpo116 · Cited by 4
[The effect of deep branches of cervical nerve on motorial function of trapezius muscle].
Wang, F., Wen, Y., & Li, L. (2003) · PubMed · Cited by 4
Age-Associated Calcification: Insights from Murine Models
Nasi, S., Romani, M., & Busso, N. (2024) · Gout Urate and Crystal Deposition Disease · doi:10.3390/gucdd2030018 · Cited by 3
Mouse Models for Chromosomal Instability
Foijer, F. (2012) · InTech eBooks · doi:10.5772/48025 · Cited by 3
FISH Analysis of Aging-Associated Aneuploidy in Neurons and Nonneuronal Brain Cells
Andriani, G. A., & Montagna, C. (2017) · Neuromethods · doi:10.1007/978-1-4939-7280-7_14 · Cited by 3
Silva‐Álvarez, S. D., & Collado, M. (2015) · Elsevier eBooks · doi:10.1016/b978-0-12-394447-4.30066-9 · Cited by 4
Silva‐Álvarez, S. D., & Collado, M. (2022) · Elsevier eBooks · doi:10.1016/b978-0-12-821618-7.00219-4 · Cited by 3
Zhu, Z., Li, L., Ye, Y., & Zhong, Q. (2024) · Cellular Oncology · doi:10.1007/s13402-024-00996-w · Cited by 3
Multitasking Roles for Poly(ADP-ribosyl)ation in Aging and Longevity
Mangerich, A., & Bürkle, A. (2015) · Cancer drug discovery and develogment/Cancer drug discovery and development · doi:10.1007/978-3-319-14151-0_6 · Cited by 2
The Connection between Cellular Senescence and Age-Related Diseases
Falandry, C. (2019) · Cambridge University Press eBooks · doi:10.1017/9781316677018.005 · Cited by 2
Egervári, G., Alexander, D. C., Donahue, G., Huang, H., Hogan, C., Mendoza, M. R., Garcia, B. A., Bonini, N. M., & Berger, S. L. (2024) · bioRxiv (Cold Spring Harbor Laboratory) · doi:10.1101/2024.04.08.588604 · Cited by 2
Li, A., Wu, H., Chen, D.-Y., Gao, Y., Xiang, X.-Q., He, Q., Ma, H., & Tang, D. (2026) · Critical Reviews in Food Science and Nutrition · doi:10.1080/10408398.2026.2696412 · Cited by 1
DiPrima, S., Haarer, B. K., Viggiano, S. C., Pons, C., Myers, C. L., & Amberg, D. C. (2014) · G3 Genes Genomes Genetics · doi:10.1534/g3.114.012054 · Cited by 1
'Exploring aneuploidy: the significance of chromosomal imbalance' review series
Holland, A. J., & Cleveland, D. W. (2012) · Cited by 1
Pereira, S. P., Grilo, L. F., Tavares, R. S., Gomes, R. M., Ramalho‐Santos, J., Ozanne, S. E., & Matafome, P. N. (2022) · Elsevier eBooks · doi:10.1016/b978-0-12-823761-8.00031-8 · Cited by 1
The Role of APC E3 Ubiquitin Ligase Complex in Tumorigenesis
Zhang, J., Wan, L., North, B. J., Inuzuka, H., & Wei, W. (2014) · Springer eBooks · doi:10.1007/978-3-319-05026-3_5 · Cited by 1
Tissue stem cells: the new actors in the aneuploidy field
Brás, R., Sunkel, C. E., & Resende, L. P. (2019) · Cell Cycle · doi:10.1080/15384101.2019.1635867 · Cited by 1
The Role of Stem Cell Genomic Instability in Aging
Sieben, C. J., Childs, B. G., & Baker, D. J. (2015) · Current Stem Cell Reports · doi:10.1007/s40778-015-0020-6 · Cited by 1
Self-citationCharacterisation of the spindle assembly checkpoint in mammalian oocytes
Vogt, E.-J. (2009) · PUB – Publications at Bielefeld University (Bielefeld University)
The Emerging Role of Centromere/Kinetochore Proteins in Cellular Senescence
Maehara, K. (2012) · InTech eBooks · doi:10.5772/33044
Genetic Instability and Herpes Simplex Virus
Zakaryan, H. S. (2013) · British Microbiology Research Journal · doi:10.9734/bmrj/2013/2736
Sénescence cellulaire et cancer: «Le pacte Faustien»
Gaudin, C. (2011) · Springer eBooks · doi:10.1007/978-2-8178-0142-1_3
Inhibiting Cell Cycle Kinases in Cancer Therapy
de Cárcer, G., de Castro, I. P., & Malumbres, M. (2012) · BENTHAM SCIENCE PUBLISHERS eBooks · doi:10.2174/9781608054640113060009
Integrins in Tumorigenesis and Cancer Cell Invasion
Högnäs, G. (2013) · UTUPub (University of Turku)
Longevity Assurance by Genome Maintenance
Hasty, P., Suh, Y., & Vijg, J. (2013) · CRC Press eBooks · doi:10.1201/b14587-3
Enrichment of therapeutic hematopoietic stem cell populations from embryonic stem cells
Gilner, J. B. (2019) · Carolina Digital Repository (University of North Carolina at Chapel Hill) · doi:10.17615/0swe-w763
[Air-conditioning and air-circulation systems in hospitals (author's transl)].
Steuér, W. (1973) · PubMed
(2006) · Science of Aging Knowledge Environment · doi:10.1126/sageke.2006.6.nw6
Goutas, A., & Trachana, V. (2023) · Advances in biogerontology · doi:10.1016/bs.abger.2023.07.002
Anfeng, L., Gu, H., Ali, A. A., Mengfan, Q., Kaixin, P., Zhou, C., Zeng, W., Liu, S., Hongyan, R., Yanzhen, B., et al. (2025) · Theriogenology · doi:10.1016/j.theriogenology.2025.117519
MTR4 : A Conserved Youth Factor for Vascular Endothelium
Guo, Z., Chen, Z., Sun, J., Zhou, X., Ni, C., Zhang, Y., Qiang, P., & Zhang, L. (2026) · Aging Cell · doi:10.1111/acel.70774
Metadata
- Authors
- Baker, D. J., Jeganathan, K. B., Malureanu, L., Perez-Terzic, C., Terzic, A., & van Deursen, J. M. A.
- Affiliations
- 1Department of Pediatric and Adolescent Medicine
- 3Department of Medicine,
- Venue
- The Journal of Cell Biology
- Publisher
- Rockefeller University Press
- Published
- 2006-02-13
- Volume
- 172
- Issue
- 4
- Pages
- 529-540
- ISSN
- 0021-9525 (ISSN-L)
- 1540-8140
- PMC
- PMC2063673
- OpenAlex
- W2021488377
- Cited by
- 175
- References
- 58
- Citations by year
- 2026: 2 · 2025: 2 · 2024: 7 · 2023: 3 · 2022: 4 · 2021: 7 · 2020: 2 · 2019: 10 · 2018: 9 · 2017: 7 · 2016: 8 · 2015: 9 · 2014: 12 · 2013: 13 · 2012: 11
- FWCI
- 10.16
- Type
- journal article
- Language
- en
- Open access
- green
- www.ncbi.nlm.nih.gov
- Licence
- cc-by-nc-sa
- Locations
- The Journal of Cell Biology (publishedVersion)
- PubMed Central (publishedVersion, cc-by-nc-sa)
- PubMed (publishedVersion)
- Funders
- National Cancer Institute (CA-96985, CA-77262, R01CA077262, R01CA096985)
- Topics
- Life Sciences › Biochemistry, Genetics and Molecular Biology › Cell Biology › Telomeres, Telomerase, and Senescence
- Life Sciences › Biochemistry, Genetics and Molecular Biology › Aging › Genetics, Aging, and Longevity in Model Organisms
- Life Sciences › Biochemistry, Genetics and Molecular Biology › Cell Biology › Microtubule and mitosis dynamics
- Keywords
- aging, Bub3, Rae1, BubR1, spindle assembly checkpoint, haploinsufficiency, premature senescence, cellular senescence, p53 pathway, p16, p21, p19, aneuploidy, mouse embryonic fibroblasts
- MeSH terms
- Poly-ADP-Ribose Binding Proteins, Aneuploidy, Animals, Chromosomal Proteins, Non-Histone, Haplotypes, Mice, Mutant Strains, Mutation, Neoplasms, Phenotype, Mice, Knockout, Cell Cycle Proteins, Aging, Premature, Nucleocytoplasmic Transport Proteins, Nuclear Matrix-Associated Proteins, Mice
About these checks
Registry, retraction, Cites and statistics results are computed, not judged, with one exception: a printed reference that no index lists is read once by a model before it counts as a citation error. Claims are extracted by a model and kept only when their quote appears verbatim in the text; each cited source is then checked, with a model’s help, for whether it says what the claim relies on. Those verdicts can be wrong — read the claim’s quote and the cited source before relying on one.
Statistics and arithmetic are recomputed, not judged.
Confidence bands are shown only for fields calibrated on our annotated test set. None is calibrated yet, so no band is shown.
What counts as a claim ›How we measure confidence ›How we check this ›
Are you an author, or do you see a problem with this page? Request a review
