

The DOI matches its Crossref record; 52 of the 52 references it cites were found in a registry or an index.
Muscle inactivation of mTOR causes metabolic and dystrophin defects leading to severe myopathy
Open accessAbstract
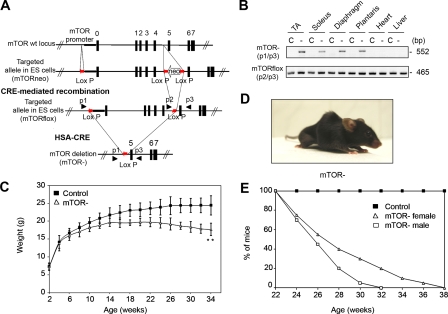
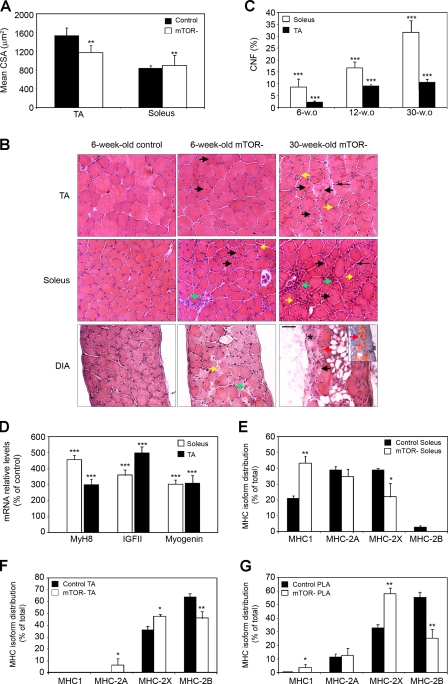
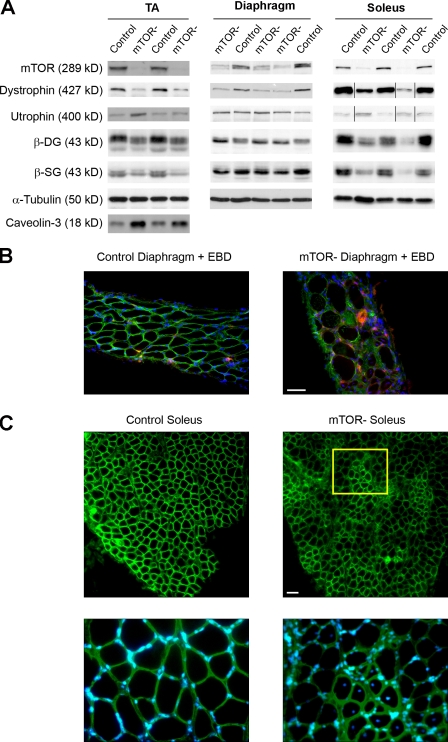
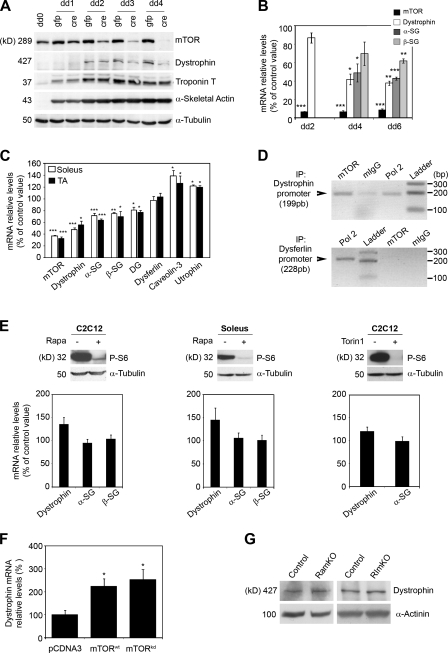
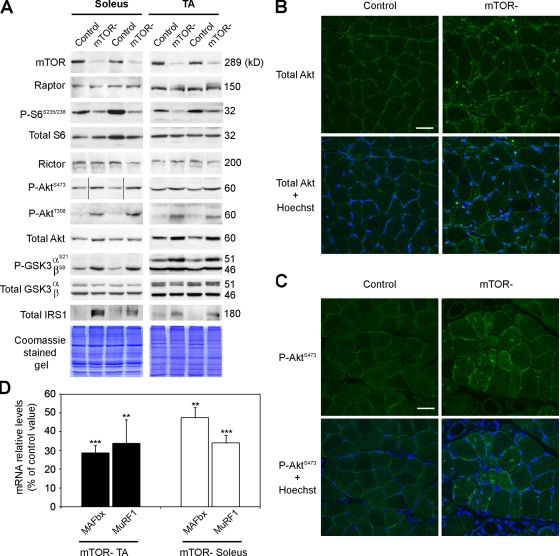
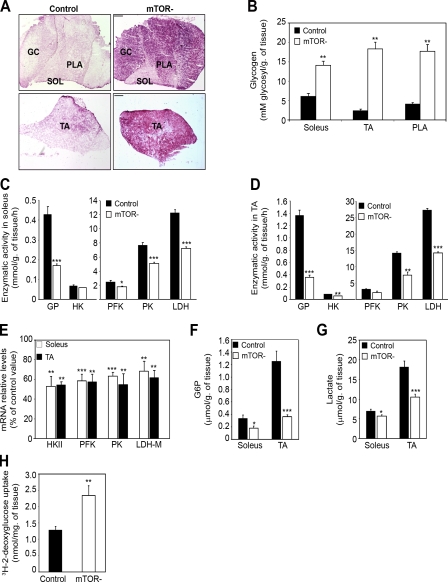
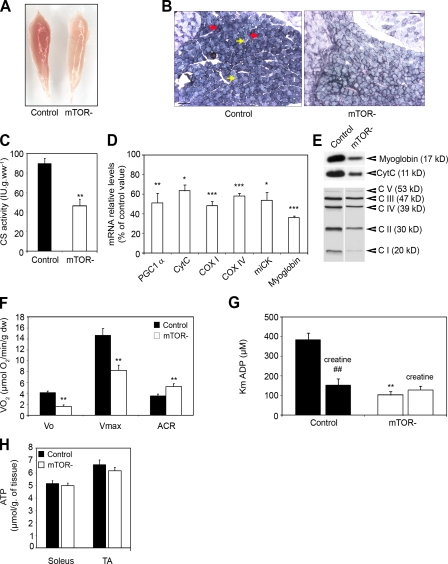
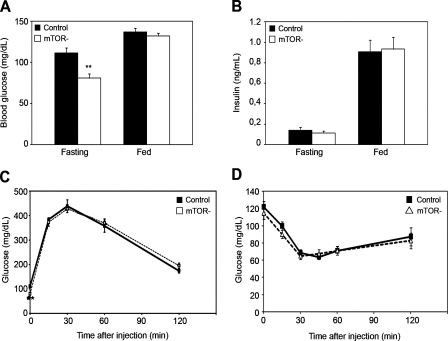
Mammalian target of rapamycin (mTOR) is a key regulator of cell growth that associates with raptor and rictor to form the mTOR complex 1 (mTORC1) and mTORC2, respectively. Raptor is required for oxidative muscle integrity, whereas rictor is dispensable. In this study, we show that muscle-specific inactivation of mTOR leads to severe myopathy, resulting in premature death. mTOR-deficient muscles display metabolic changes similar to those observed in muscles lacking raptor, including impaired oxidative metabolism, altered mitochondrial regulation, and glycogen accumulation associated with protein kinase B/Akt hyperactivation. In addition, mTOR-deficient muscles exhibit increased basal glucose uptake, whereas whole body glucose homeostasis is essentially maintained. Importantly, loss of mTOR exacerbates the myopathic features in both slow oxidative and fast glycolytic muscles. Moreover, mTOR but not raptor and rictor deficiency leads to reduced muscle dystrophin content. We provide evidence that mTOR controls dystrophin transcription in a cell-autonomous, rapamycin-resistant, and kinase-independent manner. Collectively, our results demonstrate that mTOR acts mainly via mTORC1, whereas regulation of dystrophin is raptor and rictor independent.
Overview
The claims and statistics of this paper haven’t been checked yet.
Run the check — free, no account needed. It reads the open-access text and checks the sources it cites.
Integrity signals
Registry
Cites
Statistics
Figures
Verification
Claims the paper makes
The claims and statistics of this paper haven’t been checked yet.
Run the check — free, no account needed. It reads the open-access text and checks the sources it cites.
Claims other papers make about this one
Each is checked against this paper’s own text: does it say what the citing paper says it does?
In the citing paper
“While muscle-specific Rictor knockout mice do not show any overt phenotype conversely, Raptor- and mTOR-deficient mice display reduced postnatal growth, due to the reduced size of fast but not slow muscle fibers and a progressive muscular dystrophy phenotype11,12.”
From Mechanisms of muscle atrophy and hypertrophy: implications in health and disease (2021) · cites this paper as [12]
In the citing paper
“Surprisingly, autophagy is not hyperactivated in these mice, as might be expected to occur following inhibition of the mTORC1 complex (Fig. 1), but instead is impaired and this inhibition greatly contributes to the pathological features of these animals12,14.”
From Mechanisms of muscle atrophy and hypertrophy: implications in health and disease (2021) · cites this paper as [12]
In the citing paper
“However, both conditional mTOR knockout and mTOR catalytical inactive transgenic mice show myofiber degeneration and myopathic phenotype, suggesting an important pro-survival role of mTOR.”
From Mechanisms of muscle atrophy and hypertrophy: implications in health and disease (2021) · cites this paper as [12]
Self-check
Percentages, sums and reported differences re-computed from the paper’s own numbers.
The self-check needs the paper’s full text.
Citations
Cites
TOR signaling in growth and metabolism
Wullschleger, S., Loewith, R., & Hall, M. N. (2006) · Cell · doi:10.1016/j.cell.2006.01.016 · Cited by 5,787
Bodine, S. C., Stitt, T. N., Gonzalez, M., Kline, W. O., Stover, G. L., Bauerlein, R., Zlotchenko, E., Scrimgeour, A., Lawrence, J. C., Glass, D. J., et al. (2001) · Nature Cell Biology · doi:10.1038/ncb1101-1014 · Cited by 2,752
Sarbassov, D. D., Ali, S. M., Kim, D.-H., Guertin, D. A., Latek, R. R., Erdjument-Bromage, H., Tempst, P., & Sabatini, D. M. (2004) · Current Biology · doi:10.1016/j.cub.2004.06.054 · Cited by 2,665
Prolonged Rapamycin Treatment Inhibits mTORC2 Assembly and Akt/PKB
Sarbassov, D. D., Ali, S. M., Sengupta, S., Sheen, J.-H., Hsu, P. P., Bagley, A. F., Markhard, A. L., & Sabatini, D. M. (2006) · Molecular Cell · doi:10.1016/j.molcel.2006.03.029 · Cited by 2,365
Mammalian TOR complex 2 controls the actin cytoskeleton and is rapamycin insensitive
Jacinto, E., Loewith, R., Schmidt, A., Lin, S., Rüegg, M. A., Hall, A., & Hall, M. N. (2004) · Nature Cell Biology · doi:10.1038/ncb1183 · Cited by 2,097
Self-citationStitt, T. N., Drujan, D., Clarke, B. A., Panaro, F., Timofeyva, Y., Kline, W. O., Gonzalez, M., Yancopoulos, G. D., & Glass, D. J. (2004) · Molecular Cell · doi:10.1016/s1097-2765(04)00211-4 · Cited by 1,964
Thoreen, C. C., Kang, S. A., Chang, J. W., Liu, Q., Zhang, J., Gao, Y., Reichling, L. J., Sim, T., Sabatini, D. M., & Gray, N. S. (2009) · Journal of Biological Chemistry · doi:10.1074/jbc.m900301200 · Cited by 1,803
Rommel, C., Bodine, S. C., Clarke, B. A., Rossman, R., Nunez, L., Stitt, T. N., Yancopoulos, G. D., & Glass, D. J. (2001) · Nature Cell Biology · doi:10.1038/ncb1101-1009 · Cited by 1,583
mTOR controls mitochondrial oxidative function through a YY1–PGC-1α transcriptional complex
Cunningham, J. T., Rodgers, J. T., Arlow, D. H., Vazquez, F., Mootha, V. K., & Puigserver, P. (2007) · Nature · doi:10.1038/nature06322 · Cited by 1,488
Majumder, P. K., Febbo, P. G., Bikoff, R., Berger, R., Xue, Q., McMahon, L. M., Manola, J., Brugarolas, J., McDonnell, T. J., Golub, T. R., et al. (2004) · Nature Medicine · doi:10.1038/nm1052 · Cited by 964
Phosphorylation of the Translational Repressor PHAS-I by the Mammalian Target of Rapamycin
Brunn, G. J., Hudson, C. C., Sekulić, A., Williams, J. M., Hosoi, H., Houghton, P. J., Lawrence, J. C., & Abraham, R. T. (1997) · Science · doi:10.1126/science.277.5322.99 · Cited by 846
Analysis of mitochondrial function in situ in permeabilized muscle fibers, tissues and cells
Kuznetsov, A. V., Veksler, V., Gellerich, F. N., Saks, V. A., Margreiter, R., & Kunz, W. S. (2008) · Nature Protocols · doi:10.1038/nprot.2008.61 · Cited by 839
Signaling Pathways in Skeletal Muscle Remodeling
Bassel‐Duby, R., & Olson, E. N. (2006) · Annual Review of Biochemistry · doi:10.1146/annurev.biochem.75.103004.142622 · Cited by 823
Electrophoretic separation of rat skeletal muscle myosin heavy-chain isoforms
Talmadge, R. J., & Roy, R. R. (1993) · Journal of Applied Physiology · doi:10.1152/jappl.1993.75.5.2337 · Cited by 804
Nutrient overload, insulin resistance, and ribosomal protein S6 kinase 1, S6K1
Um, S. H., D'Alessio, D., & Thomas, G. (2006) · Cell Metabolism · doi:10.1016/j.cmet.2006.05.003 · Cited by 690
Self-citationBentzinger, C. F., Romanino, K., Cloëtta, D., Lin, S., Mascarenhas, J. B., Oliveri, F., Xia, J., Casanova, E., Costa, C. F., Brink, M., et al. (2008) · Cell Metabolism · doi:10.1016/j.cmet.2008.10.002 · Cited by 640
Self-citationSchieke, S. M., Phillips, D., McCoy, J. P., Aponte, A. M., Shen, R.-F., Balaban, R. S., & Finkel, T. (2006) · Journal of Biological Chemistry · doi:10.1074/jbc.m603536200 · Cited by 623
mTOR Is Essential for Growth and Proliferation in Early Mouse Embryos and Embryonic Stem Cells
Murakami, M., Ichisaka, T., Maeda, M., Oshiro, N., Hara, K., Edenhofer, F., Kiyama, H., Yonezawa, K., & Yamanaka, S. (2004) · Molecular and Cellular Biology · doi:10.1128/mcb.24.15.6710-6718.2004 · Cited by 620
Expression of full-length utrophin prevents muscular dystrophy in mdx mice
Tinsley, J. M., Deconinck, N., Fisher, R., Kahn, D., Phelps, S., Gillis, J., & Davies, K. E. (1998) · Nature Medicine · doi:10.1038/4033 · Cited by 608
Aminoglycoside antibiotics restore dystrophin function to skeletal muscles of mdx mice
Barton-Davis, E. R., Cordier, L., Shoturma, D. I., Leland, S. E., & Sweeney, H. L. (1999) · Journal of Clinical Investigation · doi:10.1172/jci7866 · Cited by 579
Hardwick, J. S., Kuruvilla, F. G., Tong, J. K., Shamji, A. F., & Schreiber, S. L. (1999) · Proceedings of the National Academy of Sciences · doi:10.1073/pnas.96.26.14866 · Cited by 523
Enzymatic analysis; a practical guide
(1993) · General Pharmacology The Vascular System · doi:10.1016/0306-3623(93)90404-l · Cited by 522
Animal models for muscular dystrophy show different patterns of sarcolemmal disruption
Straub, V., Rafael, J. A., Chamberlain, J. S., & Campbell, K. P. (1997) · The Journal of Cell Biology · doi:10.1083/jcb.139.2.375 · Cited by 488
Gangloff, Y.-G., Mueller, M., Dann, S. G., Svoboda, P., Sticker, M., Spetz, J.-F., Um, S. H., Brown, E. J., Cereghini, S., Thomas, G., et al. (2004) · Molecular and Cellular Biology · doi:10.1128/mcb.24.21.9508-9516.2004 · Cited by 485
Self-citationDurbeej, M., & Campbell, K. P. (2002) · Current Opinion in Genetics & Development · doi:10.1016/s0959-437x(02)00309-x · Cited by 434
Dystrophin-associated proteins are greatly reduced in skeletal muscle from mdx mice.
Ohlendieck, K., & Campbell, K. P. (1991) · The Journal of Cell Biology · doi:10.1083/jcb.115.6.1685 · Cited by 420
Peng, T., Golub, T. R., & Sabatini, D. M. (2002) · Molecular and Cellular Biology · doi:10.1128/mcb.22.15.5575-5584.2002 · Cited by 404
Ohanna, M., Sobering, A. K., Lapointe, T., Lorenzo, L., Praud, C., Petroulakis, E., Sonenberg, N., Kelly, P. A., Sotiropoulos, A., & Pende, M. (2005) · Nature Cell Biology · doi:10.1038/ncb1231 · Cited by 392
Self-citationAcharyya, S., Butchbach, M. E. R., Sahenk, Z., Wang, H., Saji, M., Carathers, M., Ringel, M. D., Skipworth, R. J. E., Fearon, K. C. H., Hollingsworth, M. A., et al. (2005) · Cancer Cell · doi:10.1016/j.ccr.2005.10.004 · Cited by 323
Passonneau, J. V., & Lowry, O. H. (1993) · Humana Press eBooks · doi:10.1007/978-1-60327-407-4 · Cited by 300
Activity-Dependent Signaling Pathways Controlling Muscle Diversity and Plasticity
Schiaffino, S., Sandri, M., & Murgia, M. (2007) · Physiology · doi:10.1152/physiol.00009.2007 · Cited by 261
Kumar, A. T., Harris, T. E., Keller, S. R., Choi, K. M., Magnuson, M. A., & Lawrence, J. C. (2007) · Molecular and Cellular Biology · doi:10.1128/mcb.01405-07 · Cited by 223
Cross, D. A. E., Watt, P., Shaw, M., KAAY, J. V. D., Downes, C. P., Holder, J. C., & Cohen, P. (1997) · FEBS Letters · doi:10.1016/s0014-5793(97)00240-8 · Cited by 221
Tibialis anterior muscles in mdx mice are highly susceptible to contraction-induced injury
DelloRusso, C., Crawford, R. W., Chamberlain, J. S., & Brooks, S. V. (2001) · Journal of Muscle Research and Cell Motility · doi:10.1023/a:1014587918367 · Cited by 207
Kuznetsov, A. V., Tiivel, T., Sikk, P., Käämbre, T., Kay, L., Daneshrad, Z., Rossi, A., Kadaja, L., Peet, N., Seppet, E. K., et al. (1996) · European Journal of Biochemistry · doi:10.1111/j.1432-1033.1996.00909.x · Cited by 199
Effect of acute exercise on citrate synthase activity in untrained and trained human skeletal muscle
Leek, B. T., Mudaliar, S. R. D., Henry, R. R., Mathieu-Costello, O. A., & Richardson, R. S. (2001) · American Journal of Physiology-Regulatory, Integrative and Comparative Physiology · doi:10.1152/ajpregu.2001.280.2.r441 · Cited by 184
Regulation of Akt/PKB Ser473 Phosphorylation
Bayascas, J. R., & Alessi, D. R. (2005) · Molecular Cell · doi:10.1016/j.molcel.2005.03.020 · Cited by 184
IGF-II transcription in skeletal myogenesis is controlled by mTOR and nutrients
Erbay, E., Park, I., Nuzzi, P. D., Schoenherr, C. J., & Chen, J. (2003) · The Journal of Cell Biology · doi:10.1083/jcb.200307158 · Cited by 174
Histone deacetylase 9 couples neuronal activity to muscle chromatin acetylation and gene expression
Méjat, A., Ramond, F., Bassel‐Duby, R., Khochbin, S., Olson, E. N., & Schaeffer, L. (2005) · Nature Neuroscience · doi:10.1038/nn1408 · Cited by 169
Self-citationEdinger, A. L., Linardic, C. M., Chiang, G. G., Thompson, C. B., & Abraham, R. T. (2003) · PubMed · Cited by 162
The Mammalian Target of Rapamycin Regulates C2C12 Myogenesis via a Kinase-independent Mechanism
Erbay, E., & Chen, J. (2001) · Journal of Biological Chemistry · doi:10.1074/jbc.c100406200 · Cited by 158
Patursky-Polischuk, I., Stolovich-Rain, M., Hausner-Hanochi, M., Kasir, J., Cybulski, N., Avruch, J., Rüegg, M. A., Hall, M. N., & Meyuhas, O. (2008) · Molecular and Cellular Biology · doi:10.1128/mcb.00980-08 · Cited by 139
Self-citationFunctional characteristics of dystrophic skeletal muscle: insights from animal models
Watchko, J. F., O’Day, T. L., & Hoffman, E. P. (2002) · Journal of Applied Physiology · doi:10.1152/japplphysiol.01242.2001 · Cited by 114
Dogra, C., Changotra, H., Wergedal, J. E., & Kumar, A. (2006) · Journal of Cellular Physiology · doi:10.1002/jcp.20696 · Cited by 112
Increased Number of Caveolae and Caveolin-3 Overexpression in Duchenne Muscular Dystrophy
Repetto, S., Bado, M., Broda, P., Lucania, G., Masetti, E., Sotgia, F., Carbone, I., Pavan, A., Bonilla, E., Cordone, G., et al. (1999) · Biochemical and Biophysical Research Communications · doi:10.1006/bbrc.1999.1055 · Cited by 106
Nicole, S., Desforges, B., Millet, G., Lesbordes, J.-C., Cifuentes-Díaz, C., Vertes, D., Cao, M. L., Backer, F. D., Languille, L., Roblot, N., et al. (2003) · The Journal of Cell Biology · doi:10.1083/jcb.200210117 · Cited by 102
Peter, A. K., & Crosbie, R. H. (2006) · Experimental Cell Research · doi:10.1016/j.yexcr.2006.04.024 · Cited by 92
Blaauw, B., Mammucari, C., Toniolo, L., Agatea, L., Abraham, R., Sandri, M., Reggiani, C., & Schiaffino, S. (2008) · Human Molecular Genetics · doi:10.1093/hmg/ddn264 · Cited by 84
Peter, A. K., Ko, C. Y., Kim, M. H., Hsu, N. N., Ouchi, N., Rhie, S. K., Izumiya, Y., Zeng, L., Walsh, K. X., & Crosbie, R. H. (2008) · Human Molecular Genetics · doi:10.1093/hmg/ddn358 · Cited by 56
Slow myosin heavy chain expression in the absence of muscle activity
Agbulut, O., Vignaud, A., Hourdé, C., Mouisel, É., Fougerousse, F., Butler-Browne, G. S., & Ferry, A. (2008) · American Journal of Physiology-Cell Physiology · doi:10.1152/ajpcell.00408.2008 · Cited by 43
Self-citationThe Dystrophin Promoter Is Negatively Regulated by YY1 in Undifferentiated Muscle Cells
Galvagni, F., Cartocci, E., & Oliviero, S. (1998) · Journal of Biological Chemistry · doi:10.1074/jbc.273.50.33708 · Cited by 43
Outcome of acetylcholinesterase deficiency for neuromuscular functioning
Mouisel, É., Blondet, B., Escourrou, P., Chatonnet, A., Molgó, J., & Ferry, A. (2006) · Neuroscience Research · doi:10.1016/j.neures.2006.05.002 · Cited by 31
Self-citation
Cited by
Sorted by citations
mTOR Signaling in Growth, Metabolism, and Disease
Saxton, R. A., & Sabatini, D. M. (2017) · Cell · doi:10.1016/j.cell.2017.02.004 · Cited by 7,555
Mechanisms regulating skeletal muscle growth and atrophy
Schiaffino, S., Dyar, K. A., Ciciliot, S., Blaauw, B., & Sandri, M. (2013) · The FEBS Journal · doi:10.1111/febs.12253 · Cited by 1,492
Cellular and molecular mechanisms of muscle atrophy
Bonaldo, P., & Sandri, M. (2013) · Disease Models & Mechanisms · doi:10.1242/dmm.010389 · Cited by 1,284
Rapamycin passes the torch: a new generation of mTOR inhibitors
Benjamin, D., Colombi, M., Moroni, C., & Hall, M. N. (2011) · Nature Reviews Drug Discovery · doi:10.1038/nrd3531 · Cited by 1,013
Mechanisms of muscle atrophy and hypertrophy: implications in health and disease
Sartori, R., Romanello, V., & Sandri, M. (2021) · Nature Communications · doi:10.1038/s41467-020-20123-1 · Cited by 940
Metadata
- Authors
- Risson, V., Mazelin, L., Roceri, M., Sanchez, H., Moncollin, V., Corneloup, C., Richard-Bulteau, H., Vignaud, A., Baas, D., Defour, A., Freyssenet, D., Tanti, J.-F., Le-Marchand-Brustel, Y., Ferrier, B., Conjard-Duplany, A., Romanino, K., Bauché, S., Hantaï, D., Mueller, M., Kozma, S. C., Thomas, G., Rüegg, M. A., Ferry, A., Pende, M., Bigard, X., Koulmann, N., Schaeffer, L., & Gangloff, Y.-G.
- Affiliations
- École Normale Supérieure de Lyon (FR)
- Inserm (FR)
- Service de Santé des Armées (FR)
- Department of Human Factors, Research Center of the Health of the Military, La Tronche 38702, France 3
- Université Pierre-et-Marie-Curie (FR)
- Université de Lyon (FR)
- Institut National de la Santé et de la Recherche Médicale, Unité 895, Centre Méditerranéen de Médecine Moléculaire, F-06204 Nice, France 6
- Lyon 1 Université (FR)
- Métabolomique et Maladies Métaboliques, Institut National de la Santé et de la Recherche Médicale, Unité 820, Faculté de Médecine R.T.H. Laennec, Université Claude Bernard Lyon 1, 69372 Lyon Cedex 08, France 8
- University of Basel (CH)
- Institut National de la Santé et de la Recherche Médicale, Université Pierre et Marie Curie, Unité Mixte de Recherche 975, Hôpital de la Salpêtrière, 75651 Paris Cedex 13, France 10
- Novartis (Switzerland) (CH)
- University of Cincinnati (US)
- Corresponding author
- Schaeffer, Laurent
- Gangloff, Yann-Gaël
- ORCID
- Venue
- Journal of Cell Biology
- Publisher
- Rockefeller University Press
- Published
- 2009-12-14
- Volume
- 187
- Issue
- 6
- Pages
- 859-874
- ISSN
- 0021-9525 (ISSN-L)
- 1540-8140
- PMC
- PMC2806319
- OpenAlex
- W2164316354
- Cited by
- 381
- References
- 52
- Citations by year
- 2026: 8 · 2025: 14 · 2024: 17 · 2023: 15 · 2022: 26 · 2021: 31 · 2020: 28 · 2019: 25 · 2018: 23 · 2017: 31 · 2016: 28 · 2015: 22 · 2014: 28 · 2013: 27 · 2012: 26
- FWCI
- 7.78
- Type
- journal article
- Language
- en
- Open access
- bronze
- doi.org
- Locations
- The Journal of Cell Biology (publishedVersion)
- PubMed Central (publishedVersion, cc-by-nc-sa)
- PubMed (publishedVersion)
- edoc (University of Basel) (acceptedVersion)
- HAL (submittedVersion)
- Dipòsit Digital de la Universitat de Barcelona (Universitat de Barcelona) (submittedVersion, cc-by)
- Funders
- Agence Nationale de la Recherche (ANR-06-BLAN-0354)
- Topics
- Life Sciences › Biochemistry, Genetics and Molecular Biology › Molecular Biology › Muscle Physiology and Disorders
- Life Sciences › Biochemistry, Genetics and Molecular Biology › Molecular Biology › PI3K/AKT/mTOR signaling in cancer
- Health Sciences › Nursing › Nutrition and Dietetics › Muscle metabolism and nutrition
- Keywords
- mTOR, mTORC1, mTORC2, raptors, Rictor, muscle myopathies, dystrophin, oxidative metabolism, mitochondrial regulation, glycogen accumulation, glucose uptake, glucose homeostasis, rapamycin resistance, kinase-independent signaling
- MeSH terms
- Regulatory-Associated Protein of mTOR, Rapamycin-Insensitive Companion of mTOR Protein, Age Factors, Animals, Carrier Proteins, Cells, Cultured, Energy Metabolism, Enzyme Activation, Female, Glucose, Glycogen, Mice, Inbred C57BL, Mitochondria, Muscle, Muscle Contraction, Muscular Dystrophy, Animal, Mutation, Oxidation-Reduction, Severity of Illness Index, Transduction, Genetic, Dystrophin, Phosphotransferases (Alcohol Group Acceptor), Electroporation, Mice, Knockout, Muscle, Skeletal, Sirolimus, Adaptor Proteins, Signal Transducing, Utrophin, Proto-Oncogene Proteins c-akt, Mice, Rats, TOR Serine-Threonine Kinases
About these checks
Registry, retraction, Cites and statistics results are computed, not judged, with one exception: a printed reference that no index lists is read once by a model before it counts as a citation error. Claims are extracted by a model and kept only when their quote appears verbatim in the text; each cited source is then checked, with a model’s help, for whether it says what the claim relies on. Those verdicts can be wrong — read the claim’s quote and the cited source before relying on one.
Statistics and arithmetic are recomputed, not judged.
Confidence bands are shown only for fields calibrated on our annotated test set. None is calibrated yet, so no band is shown.
What counts as a claim ›How we measure confidence ›How we check this ›
Are you an author, or do you see a problem with this page? Request a review
