

The DOI matches its Crossref record; 64 of the 65 references it cites were found in a registry or an index.
Mitophagy of damaged mitochondria occurs locally in distal neuronal axons and requires PINK1 and Parkin
Open accessAbstract
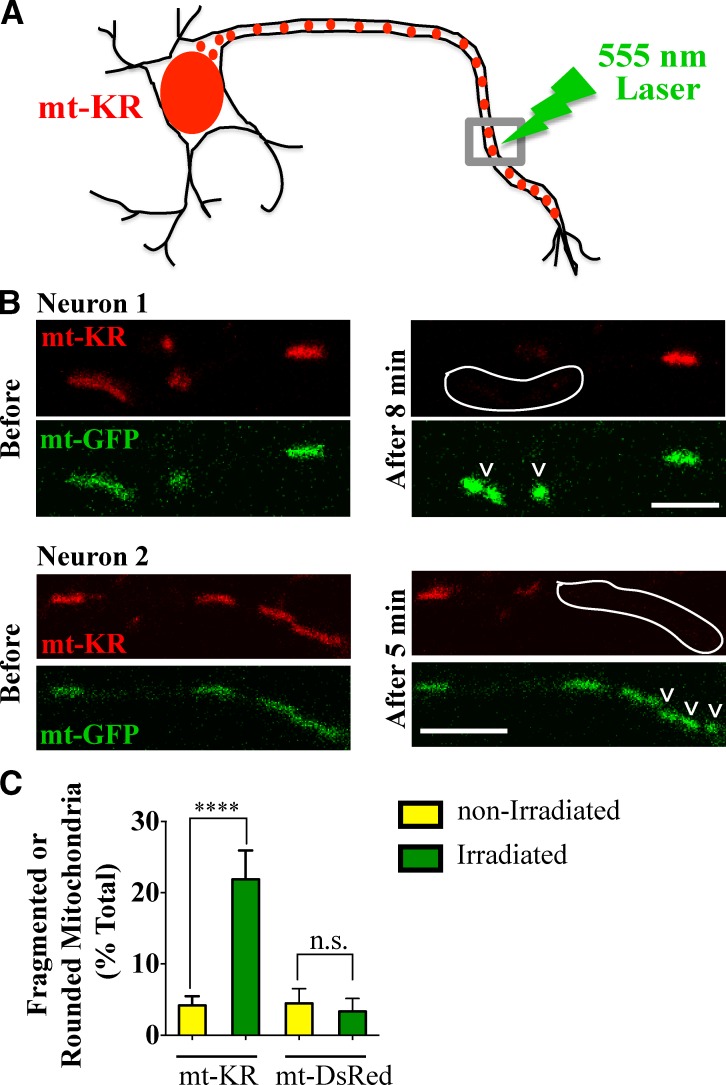
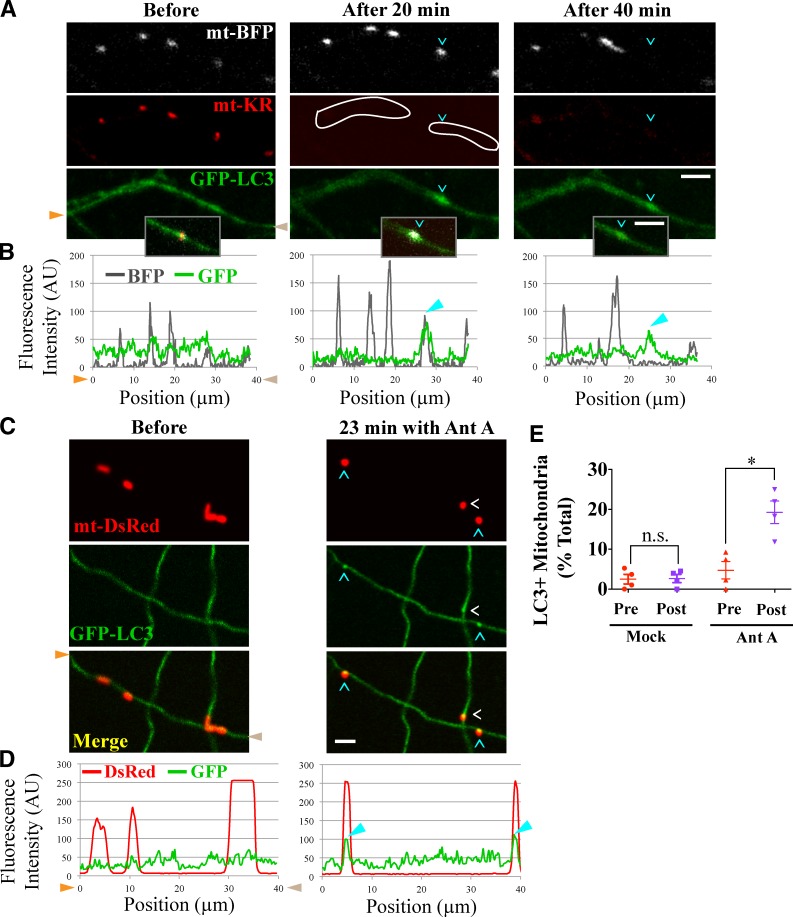
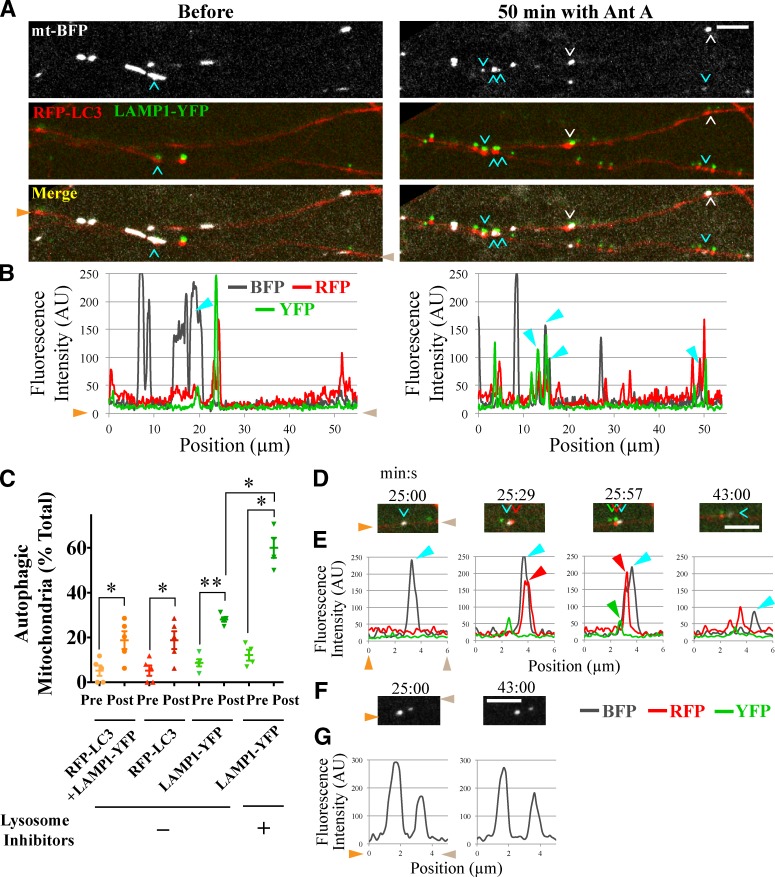
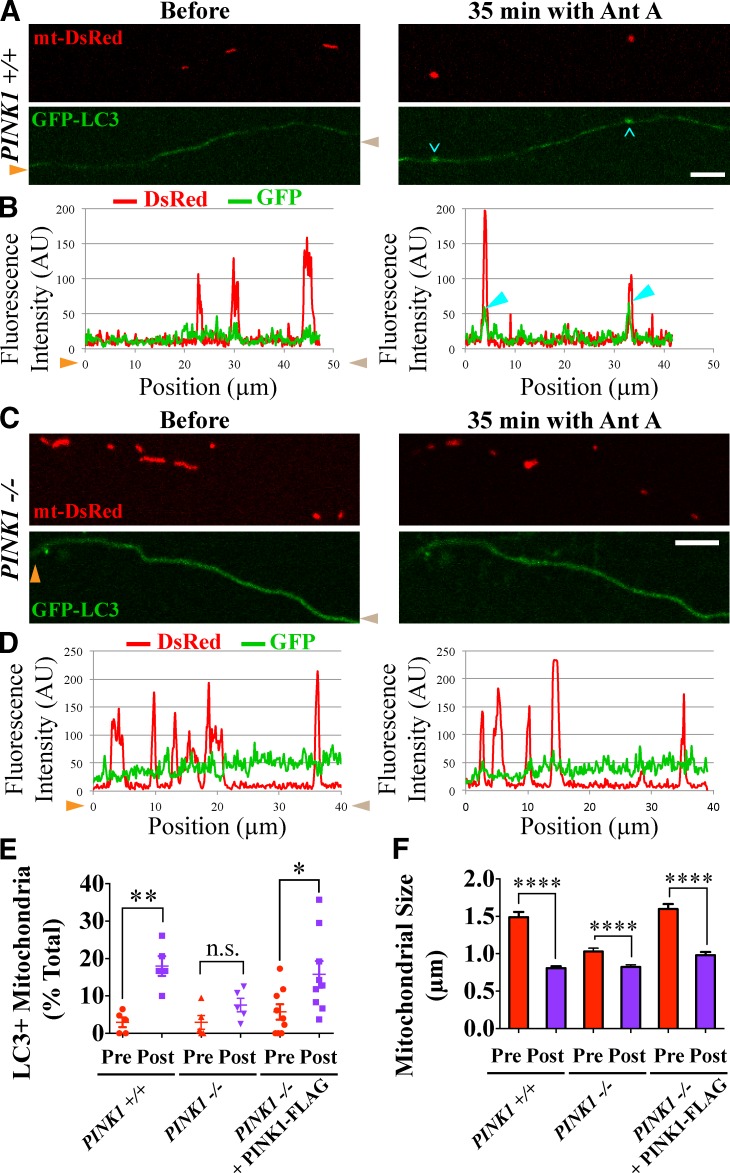
To minimize oxidative damage to the cell, malfunctioning mitochondria need to be removed by mitophagy. In neuronal axons, mitochondrial damage may occur in distal regions, far from the soma where most lysosomal degradation is thought to occur. In this paper, we report that PINK1 and Parkin, two Parkinson’s disease–associated proteins, mediate local mitophagy of dysfunctional mitochondria in neuronal axons. To reduce cytotoxicity and mimic physiological levels of mitochondrial damage, we selectively damaged a subset of mitochondria in hippocampal axons. Parkin was rapidly recruited to damaged mitochondria in axons followed by formation of LC3-positive autophagosomes and LAMP1-positive lysosomes. In PINK1−/− axons, damaged mitochondria did not accumulate Parkin and failed to be engulfed in autophagosomes. Similarly, initiation of mitophagy was blocked in Parkin−/− axons. Our findings demonstrate that the PINK1–Parkin-mediated pathway is required for local mitophagy in distal axons in response to focal damage. Local mitophagy likely provides rapid neuroprotection against oxidative stress without a requirement for retrograde transport to the soma.
Overview
The claims and statistics of this paper haven’t been checked yet.
Run the check — free, no account needed. It reads the open-access text and checks the sources it cites.
Integrity signals
Registry
Cites
Statistics
Figures
Verification
Claims the paper makes
The claims and statistics of this paper haven’t been checked yet.
Run the check — free, no account needed. It reads the open-access text and checks the sources it cites.
Claims other papers make about this one
Each is checked against this paper’s own text: does it say what the citing paper says it does?
The cited source says what the claim attributes to it.
In the citing paper
“Axonal autophagy is dependent on specialized enzymatic apparatuses, including the PINK1-PRKN complex for localized mitophagy [24], KIF1A/UNC-104 for autophagosome formation at the synapse [22,25], and the HTT-HAP1 complex and MAPK8IP1/JIP1 for retrograde transport of autophagosomes [23,26].”
From Autophagy and ALS: mechanistic insights and therapeutic implications (2022) · cites this paper as [22]
Self-check
Percentages, sums and reported differences re-computed from the paper’s own numbers.
The self-check needs the paper’s full text.
Citations
Cites
NIH Image to ImageJ: 25 years of image analysis
Schneider, C. A., Rasband, W. S., & Eliceiri, K. W. (2012) · Nature Methods · doi:10.1038/nmeth.2089 · Cited by 64,638 · cited 1×
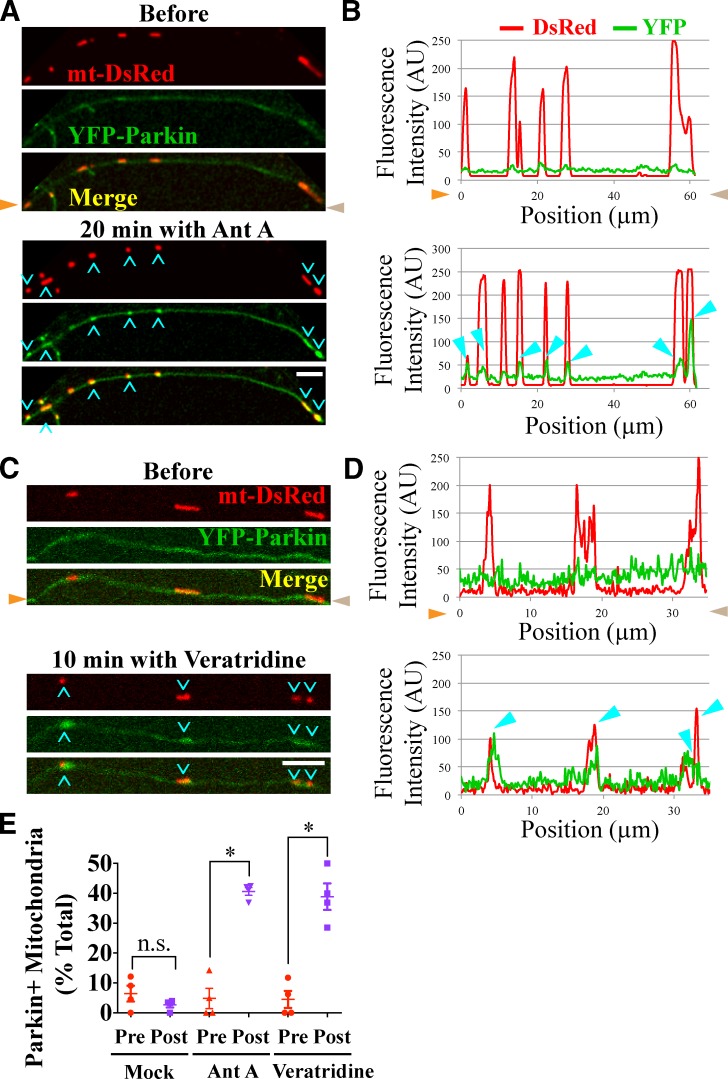
“…of Parkin on mitochondria before and after 15–20 min of Antimycin A (or mock) treatment, plots of fluorescence intensity versus distance along the axon were generated for both DsRed (mitochondria) and YFP (Parkin) channels using the line scan function of ImageJ software (Schneider et al., 2012).”
Autophagy: Renovation of Cells and Tissues
Mizushima, N., & Komatsu, M. (2011) · Cell · doi:10.1016/j.cell.2011.10.026 · Cited by 6,615 · cited 1×
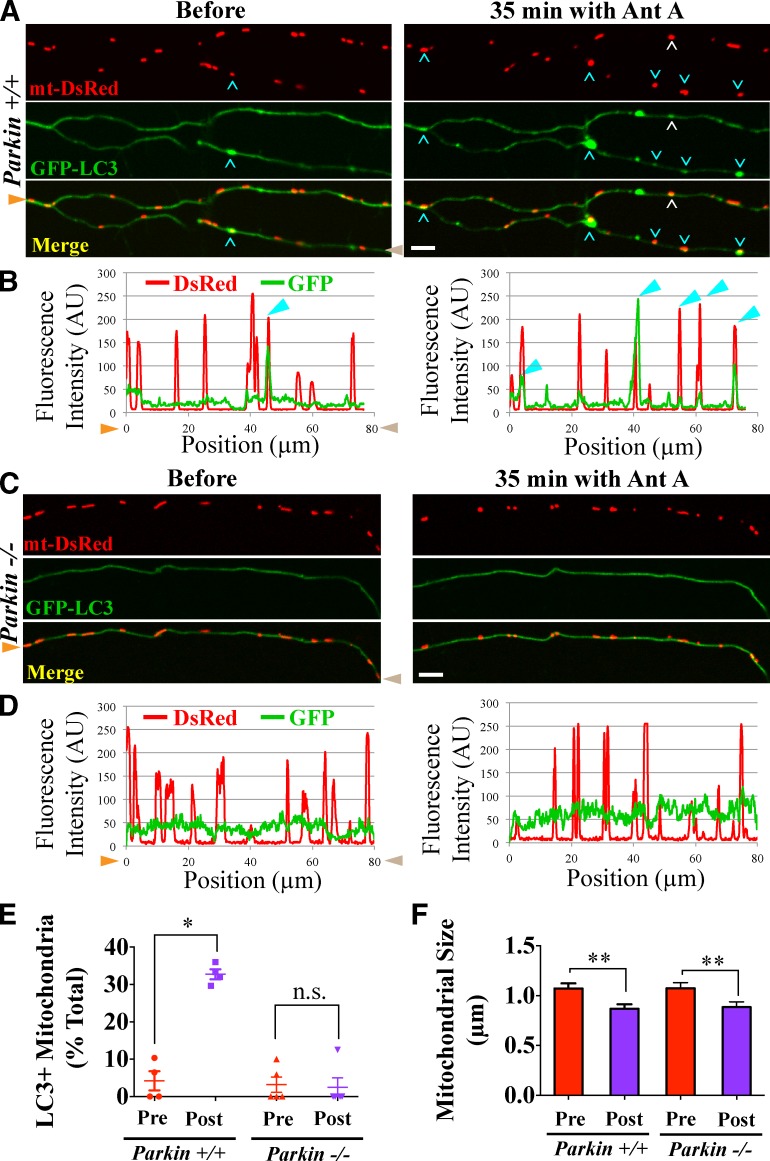
“GFPLC3 is a cytosolic protein, but upon induction of autophagy, it gets lipidated and incorporated into autophagosomes forming distinct puncta (Mizushima and Komatsu, 2011).”
BackgroundParkin is recruited selectively to impaired mitochondria and promotes their autophagy
Narendra, D., Tanaka, A., Suen, D.-F., & Youle, R. J. (2008) · The Journal of Cell Biology · doi:10.1083/jcb.200809125 · Cited by 4,026 · cited 4×
“Unlike many cell lines where the entire mitochondrial network can be cleared by mitophagy (Narendra et al., 2008, 2010; Geisler et al., 2010), neurons are strictly dependent on mitochondrial ATP production (Almeida et al., 2001, 2004).”
InfluentialChronic systemic pesticide exposure reproduces features of Parkinson's disease
Betarbet, R. S., Sherer, T., MacKenzie, G. M., Garcia‐Osuna, M., Panov, A. V., & Greenamyre, J. T. (2000) · Nature Neuroscience · doi:10.1038/81834 · Cited by 3,770 · cited 1×
“…2006; Navarro et al., 2009) and PDlike symptoms caused by mitochondrial drugs, such as Rotenone and MPTP (1methyl4phenyl1,2,3,6tetrahydro pyridine; Betarbet et al., 2000; Przedborski et al., 2004), were the first lines of evidence linking mitochondrial dysfunction to the pathology of PD.”
Youle, R. J., & Narendra, D. P. (2011) · Nature Reviews Molecular Cell Biology · doi:10.1038/nrm3028 · Cited by 3,273 · cited 1×
“The final step of mitophagy involves of autophagosome/ lysosome fusion and enzymatic degradation of the mitochon drion (Youle and Narendra, 2011).”
Wallace, D. C. (2005) · Annual Review of Genetics · doi:10.1146/annurev.genet.39.110304.095751 · Cited by 3,185 · cited 1×
“Mitochondria, particularly when dysfunctional, produce excessive reactive oxygen species (ROS; Wallace, 2005) and must be removed by quality control pathways.”
PINK1 Is Selectively Stabilized on Impaired Mitochondria to Activate Parkin
Narendra, D. P., Jin, S. M., Tanaka, A., Suen, D.-F., Gautier, C. A., Shen, J., Cookson, M. R., & Youle, R. J. (2010) · PLoS Biology · doi:10.1371/journal.pbio.1000298 · Cited by 2,944 · cited 5×
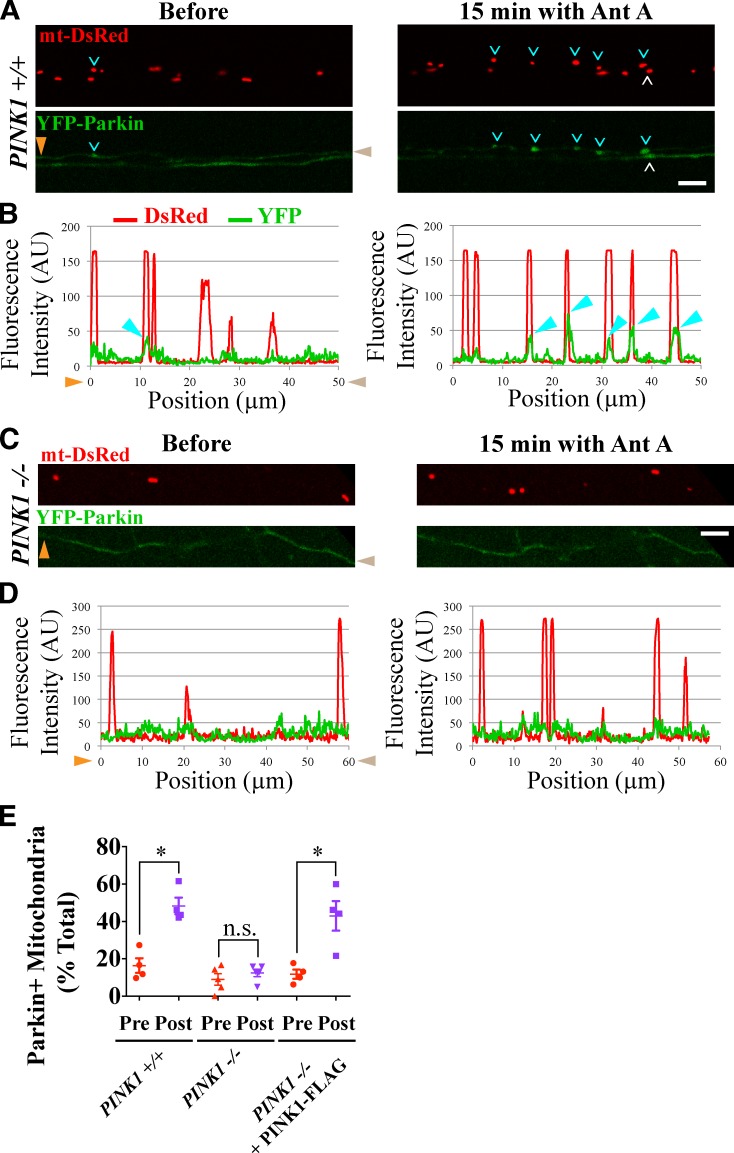
“Therefore, to rescue the recruitment of Parkin to depolarized mitochon dria in PINK1/ axons, we expressed PINK1FLAG at low mitochondrial depolarization (Narendra et al., 2010).”
BackgroundInfluentialPINK1/Parkin-mediated mitophagy is dependent on VDAC1 and p62/SQSTM1
Geisler, S., Holmström, K. M., Skujat, D., Fiesel, F. C., Rothfuss, O. C., Kahle, P. J., & Springer, W. (2010) · Nature Cell Biology · doi:10.1038/ncb2012 · Cited by 2,835 · cited 3×
“Unlike many cell lines where the entire mitochondrial network can be cleared by mitophagy (Narendra et al., 2008, 2010; Geisler et al., 2010), neurons are strictly dependent on mitochondrial ATP production (Almeida et al., 2001, 2004).”
Autophagosome formation: core machinery and adaptations
Xie, Z., & Klionsky, D. J. (2007) · Nature Cell Biology · doi:10.1038/ncb1007-1102 · Cited by 2,237 · cited 1×
“Degradation of autophagosomal cargoes requires fusion of au tophagosomes with lysosomes to form autolysosomes (Xie and Klionsky, 2007), and it was suggested that autophagosomes would have to translocate to neuronal soma to fuse with ly sosomes (Cai et al., 2012).”
Drosophila pink1 is required for mitochondrial function and interacts genetically with parkin
Clark, I. E., Dodson, M. W., Jiang, C., Cao, J. H., Huh, J. R., Seol, J. H., Yoo, S. J., Hay, B. A., & Guo, M. (2006) · Nature · doi:10.1038/nature04779 · Cited by 1,788 · cited 1×
“Genetic studies have indicated that PINK1 acts upstream of Parkin in the regulation of mitochondrial integrity (Clark et al., 2006; Park et al., 2006), and stabilization of PINK1 on the outer mitochondrial membrane is essential for Parkin re cruitment in nonneuronal cells (Geisler et al., 2010;…”
Mitochondrial dysfunction in Drosophila PINK1 mutants is complemented by parkin
Park, J., Lee, S. B., Lee, S., Kim, Y., Song, S., Kim, S., Bae, E., Kim, J., Shong, M., Kim, J.-M., et al. (2006) · Nature · doi:10.1038/nature04788 · Cited by 1,705 · cited 1×
“Most neuronal mitochondria reside in distal dendritic and axonal processes, far from the cell body where ly sosomes are abundant (Parton et al., 1992; Craig and Banker, 1994).”
BackgroundMitochondrial dynamics-fusion, fission, movement, and mitophagy-in neurodegenerative diseases
Chen, H., & Chan, D. C. (2009) · Human Molecular Genetics · doi:10.1093/hmg/ddp326 · Cited by 1,506 · cited 2×
“The involvement of PINK1 and Par kin in regulation of mitochondrial dynamics further supports the classification of PD as a mitochondrial disease (Chen and Chan, 2009; Wang et al., 2011).”
PINK1 and Parkin Target Miro for Phosphorylation and Degradation to Arrest Mitochondrial Motility
Wang, X., Winter, D., Ashrafi, G., Schlehe, J. S., Wong, Y. L., Selkoe, D. J., Rice, S. E., Steen, J. A. J., LaVoie, M. J., & Schwarz, T. L. (2011) · Cell · doi:10.1016/j.cell.2011.10.018 · Cited by 1,198 · cited 15×
“We have now established that (a) mitophagy of damaged mitochondria occurs locally in distal neuronal axons and (b) that axonal mitophagy depends on both PINK1 and Parkin.”
InfluentialSelf-citationA microfluidic culture platform for CNS axonal injury, regeneration and transport
Taylor, A. M., Blurton-Jones, M. M., Rhee, S. W., Cribbs, D. H., Cotman, C. W., & Jeon, N. L. (2005) · Nature Methods · doi:10.1038/nmeth777 · Cited by 1,172 · cited 1×
“…at 400 g for 2–3 min, resuspended at a final concentration of 4 × 10 4 /µl in Neurobasal medium supplemented with l -glutamine and penicillin/ streptomycin, plated into one of the somal compartments at a density of 5 × 10 6 /cm 2 , and cultured as previously described (Taylor et al., 2005).”
Dagda, R. K., Cherra, S. J., Kulich, S. M., Tandon, A., Park, D., & Chu, C. T. (2009) · Journal of Biological Chemistry · doi:10.1074/jbc.m808515200 · Cited by 954 · cited 1×
“Untreated mitochondria in PINK1 / axons were smaller than in PINK1 +/+ axons as previously reported (Dagda et al., 2009), and expression of PINK1FLAG restored the wildtype mitochondrial size in the PINK1 / background.”
Parkin-deficient Mice Exhibit Nigrostriatal Deficits but Not Loss of Dopaminergic Neurons
Goldberg, M. S., Fleming, S. M., Palacino, J. J., Cepeda, C., Lam, H. A., Bhatnagar, A., Meloni, E. G., Wu, N., Ackerson, L. C., Klapstein, G. J., et al. (2003) · Journal of Biological Chemistry · doi:10.1074/jbc.m308947200 · Cited by 913 · cited 2×
“129S4-Park2 tm1Shn (exon 3 deletion), and their control mice have been previously described (Goldberg et al., 2003).”
Keeney, P. M., Xie, J., Capaldi, R., & Bennett, J. P. (2006) · Journal of Neuroscience · doi:10.1523/jneurosci.0984-06.2006 · Cited by 765 · cited 1×
“Accumulation of mitochondrial damage in the brains of PD patients (Keeney et al., 2006; Navarro et al., 2009) and PDlike symptoms caused by mitochondrial drugs, such as Rotenone and MPTP (1methyl4phenyl1,2,3,6tetrahydro pyridine; Betarbet et al., 2000; Przedborski et al., 2004), were the first…”
BackgroundA Vesicular Transport Pathway Shuttles Cargo from Mitochondria to Lysosomes
Soubannier, V., McLelland, G., Zunino, R., Braschi, E., Rippstein, P. U., Fon, E. A., & McBride, H. M. (2012) · Current Biology · doi:10.1016/j.cub.2011.11.057 · Cited by 755 · cited 2×
“Antimycin A induces mi tochondrial ROS production in nonneuronal cells (Soubannier et al., 2012a) and depolarizes neuronal mitochondria (Cai et al., 2012).”
McLelland, G., Soubannier, V., Chen, C. X., McBride, H. M., & Fon, E. A. (2014) · The EMBO Journal · doi:10.1002/embj.201385902 · Cited by 743
Mitochondrial processing peptidase regulates PINK1 processing, import and Parkin recruitment
Greene, A. W., Grenier, K., Aguileta, M. A., Muise, S., Farazifard, R., Haque, M. E., McBride, H. M., Park, D. S., & Fon, E. A. (2012) · The EMBO Reports · doi:10.1038/embor.2012.14 · Cited by 711 · cited 1×
“PINK1 functions as a sensor for mitochondrial damage; its precursor is constitutively imported to the inner membrane of healthy mitochondria, where it is proteolytically cleaved (Greene et al., 2012) and eventually degraded by the protea some (Yamano and Youle, 2013).”
Craig, A. M., & Banker, G. A. (1994) · Annual Review of Neuroscience · doi:10.1146/annurev.ne.17.030194.001411 · Cited by 704
PINK1 is degraded through the N-end rule pathway
Yamano, K., & Youle, R. J. (2013) · Autophagy · doi:10.4161/auto.24633 · Cited by 694 · cited 1×
“PINK1 functions as a sensor for mitochondrial damage; its precursor is constitutively imported to the inner membrane of healthy mitochondria, where it is proteolytically cleaved (Greene et al., 2012) and eventually degraded by the protea some (Yamano and Youle, 2013).”
Autophagosomes initiate distally and mature during transport toward the cell soma in primary neurons
Maday, S., Wallace, K. E., & Holzbaur, E. L. F. (2012) · Journal of Cell Biology · doi:10.1083/jcb.201106120 · Cited by 681 · cited 6×
“S2, B and C) as previously observed (Maday et al., 2012).”
BackgroundResultInfluentialLegros, F., Lombès, A., Frachon, P., & Rojo, M. (2002) · Molecular Biology of the Cell · doi:10.1091/mbc.e02-06-0330 · Cited by 676 · cited 6×
“S2, B and C) as previously observed (Maday et al., 2012).”
BackgroundResultInfluentialGlater, E. E., Megeath, L. J., Stowers, R. S., & Schwarz, T. L. (2006) · The Journal of Cell Biology · doi:10.1083/jcb.200601067 · Cited by 667 · cited 1×
“…min, permeabilized with PBS containing 0.5% saponin for 1 h at room temperature, blocked with the permeabilization buffer + 1% BSA for 1 h, and incubated with mouse monoclonal anti-LAMP1 primary antibody (LY1C6; EMD Millipore) at 1:500 overnight at 4°C (Stowers et al., 2002; Glater et al., 2006).”
InfluentialSelf-citationAxonal Transport of Mitochondria to Synapses Depends on Milton, a Novel Drosophila Protein
Stowers, R. S., Megeath, L. J., Górska‐Andrzejak, J., Meinertzhagen, I. A., & Schwarz, T. L. (2002) · Neuron · doi:10.1016/s0896-6273(02)01094-2 · Cited by 643 · cited 1×
“…min, permeabilized with PBS containing 0.5% saponin for 1 h at room temperature, blocked with the permeabilization buffer + 1% BSA for 1 h, and incubated with mouse monoclonal anti-LAMP1 primary antibody (LY1C6; EMD Millipore) at 1:500 overnight at 4°C (Stowers et al., 2002; Glater et al., 2006).”
InfluentialSelf-citationA genetically encoded photosensitizer
Bulina, M. E., Chudakov, D. M., Britanova, O. V., Yanushevich, Y. G., Staroverov, D. B., Chepurnykh, T. V., Merzlyak, E. M., Shkrob, M., Lukyanov, S., & Lukyanov, K. A. (2005) · Nature Biotechnology · doi:10.1038/nbt1175 · Cited by 597 · cited 1×
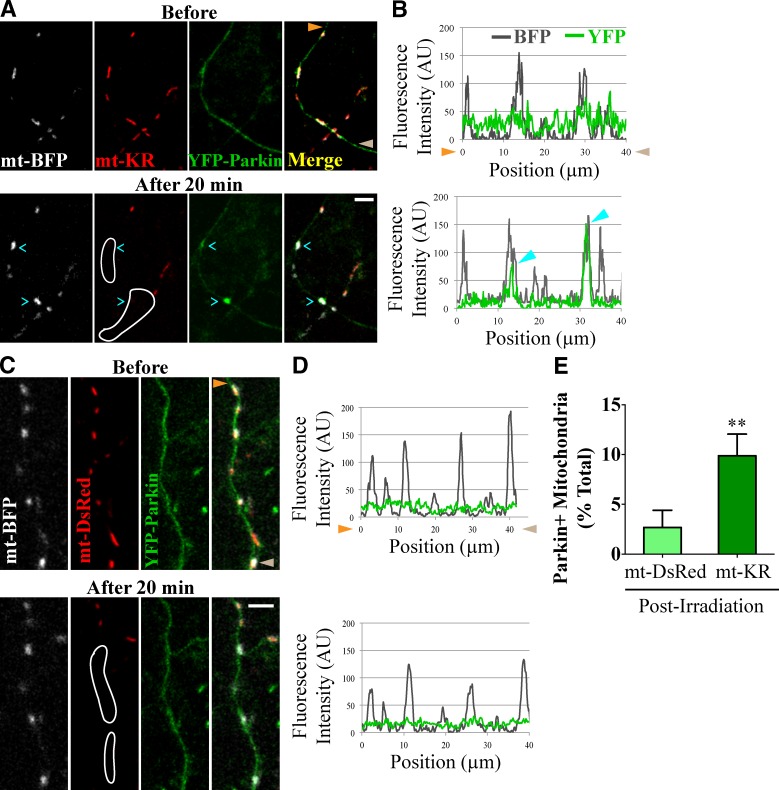
“Lightinduced activation of mtKR causes local ROSmediated damage to mitochondria (Bulina et al., 2006; Ertürk et al., 2014) and has been previously used to induce mitophagy in HeLa cells (Yang and Yang, 2011; Wang et al., 2012).”
MethodAxon degeneration in Parkinson's disease
Burke, R. E., & O’Malley, K. L. (2012) · Experimental Neurology · doi:10.1016/j.expneurol.2012.01.011 · Cited by 514 · cited 1×
“Quality control of axonal mitochondria, however, is of particular interest because axonal degeneration precedes the loss of the soma in neuro degenerative diseases, such as PD (Burke and O’Malley, 2013).”
Axonal mitochondrial transport and potential are correlated
Miller, K. E., & Sheetz, M. P. (2004) · Journal of Cell Science · doi:10.1242/jcs.01130 · Cited by 512 · cited 4×
“A prevalent model has favored transport of mitochondria toward the cell body for subsequent degradation (Miller and Sheetz, 2004).”
BackgroundMethodInfluentialAlmeida, Á., Moncada, S., & Bolaños, J. P. (2003) · Nature Cell Biology · doi:10.1038/ncb1080 · Cited by 481 · cited 1×
“Unlike many cell lines where the entire mitochondrial network can be cleared by mitophagy (Narendra et al., 2008, 2010; Geisler et al., 2010), neurons are strictly dependent on mitochondrial ATP production (Almeida et al., 2001, 2004).”
The PINK1-Parkin pathway promotes both mitophagy and selective respiratory chain turnover in vivo
Vincow, E. S., Merrihew, G., Thomas, R. E., Shulman, N. J., Beyer, R. P., MacCoss, M. J., & Pallanck, L. J. (2013) · Proceedings of the National Academy of Sciences · doi:10.1073/pnas.1221132110 · Cited by 478 · cited 1×
“Similarly, PINK1 is re quired for basal turnover of mitochondrial respiratory chain subunits in Drosophila melanogaster (Vincow et al., 2013).”
Lee, S., Satō, Y., & Nixon, R. A. (2011) · Journal of Neuroscience · doi:10.1523/jneurosci.6412-10.2011 · Cited by 478 · cited 2×
“In our study, mitoautophagosomes were largely station ary; although in agreement with previous studies (Lee et al., 2011; Maday et al., 2012), nonmitophagic autophagosomes were highly motile.”
BackgroundResultWang, Y., Nartiss, Y., Steipe, B., McQuibban, G. A., & Kim, P. K. (2012) · Autophagy · doi:10.4161/auto.21211 · Cited by 438 · cited 2×
“Lightinduced activation of mtKR causes local ROSmediated damage to mitochondria (Bulina et al., 2006; Ertürk et al., 2014) and has been previously used to induce mitophagy in HeLa cells (Yang and Yang, 2011; Wang et al., 2012).”
Almeida, A., Almeida, J., Bolaños, J. P., & Moncada, S. (2001) · Proceedings of the National Academy of Sciences · doi:10.1073/pnas.261560998 · Cited by 423 · cited 1×
“Unlike many cell lines where the entire mitochondrial network can be cleared by mitophagy (Narendra et al., 2008, 2010; Geisler et al., 2010), neurons are strictly dependent on mitochondrial ATP production (Almeida et al., 2001, 2004).”
Visualization of Retroviral Replication in Living Cells Reveals Budding into Multivesicular Bodies
Sherer, N. M., Lehmann, M. J., Soto, L. F. J., Ingmundson, A., Horner, S. M., Cicchetti, G., Allen, P. G., Pypaert, M., Cunningham, J. M., & Mothes, W. (2003) · Traffic · doi:10.1034/j.1600-0854.2003.00135.x · Cited by 416 · cited 2×
“1 vector with a CMV promoter (Weihofen et al., 2009), mt-DsRed with a CMV promoter (Takara Bio Inc.), mt-GFP in the pShooter vector with a CMV promoter (gift of M. Haigis, Harvard Medical School, Boston, MA), pEGFP-N1 with a CMV promoter (Takara Bio Inc.), pKillerRed-dMito with a CMV promoter (Evrogen), and LAMP1-YFP…”
Mitochondrial Trafficking to Synapses in Cultured Primary Cortical Neurons
Chang, D. T. W., Honick, A. S., & Reynolds, I. J. (2006) · Journal of Neuroscience · doi:10.1523/jneurosci.1012-06.2006 · Cited by 391 · cited 1×
“Veratridine, an activator of voltagegated sodium channels, was applied to axons to increase firing and intracellular calcium (Chang et al., 2006).”
Seibler, P., Graziotto, J. J., Jeong, H., Šimunović, F., Klein, C., & Krainc, D. (2011) · Journal of Neuroscience · doi:10.1523/jneurosci.4441-10.2011 · Cited by 388 · cited 4×
“…(Clark et al., 2006; Park et al., 2006), and stabilization of PINK1 on the outer mitochondrial membrane is essential for Parkin re cruitment in nonneuronal cells (Geisler et al., 2010; Narendra et al., 2010) and cell bodies of induced pluripotent stem cell– derived neurons (Seibler et al., 2011).”
InfluentialSoubannier, V., Rippstein, P. U., Kaufman, B. A., Shoubridge, E. A., & McBride, H. M. (2012) · PLoS ONE · doi:10.1371/journal.pone.0052830 · Cited by 346 · cited 2×
“Antimycin A induces mi tochondrial ROS production in nonneuronal cells (Soubannier et al., 2012a) and depolarizes neuronal mitochondria (Cai et al., 2012).”
Cai, Q., Zakaria, H. M., Simone, A., & Sheng, Z. (2012) · Current Biology · doi:10.1016/j.cub.2012.02.005 · Cited by 346 · cited 16×
“Degradation of autophagosomal cargoes requires fusion of au tophagosomes with lysosomes to form autolysosomes (Xie and Klionsky, 2007), and it was suggested that autophagosomes would have to translocate to neuronal soma to fuse with ly sosomes (Cai et al., 2012).”
InfluentialMicrofluidic Local Perfusion Chambers for the Visualization and Manipulation of Synapses
Taylor, A. M., Dieterich, D. C., Ito, H., Kim, S. A., & Schuman, E. M. (2010) · Neuron · doi:10.1016/j.neuron.2010.03.022 · Cited by 292
Weihofen, A., Craig, K. J. T., Ostaszewski, B. L., Cookson, M., & Selkoe, D. J. (2009) · Biochemistry · doi:10.1021/bi8019178 · Cited by 291 · cited 1×
“1 vector with a CMV promoter (Weihofen et al., 2009), mt-DsRed with a CMV promoter (Takara Bio Inc.), mt-GFP in the pShooter vector with a CMV promoter (gift of M. Haigis, Harvard Medical School, Boston, MA), pEGFP-N1 with a CMV promoter (Takara Bio Inc.), pKillerRed-dMito with a CMV promoter…”
MPTP as a Mitochondrial Neurotoxic Model of Parkinson's Disease
Przedborski, S., Tieu, K., Perier, C., & Vila, M. (2004) · Journal of Bioenergetics and Biomembranes · doi:10.1023/b:jobb.0000041771.66775.d5 · Cited by 289 · cited 1×
“…et al., 2006; Navarro et al., 2009) and PDlike symptoms caused by mitochondrial drugs, such as Rotenone and MPTP (1methyl4phenyl1,2,3,6tetrahydro pyridine; Betarbet et al., 2000; Przedborski et al., 2004), were the first lines of evidence linking mitochondrial dysfunction to the pathology of PD.”
BackgroundGlucose Regulates Mitochondrial Motility via Milton Modification by O-GlcNAc Transferase
Pekkurnaz, G., Trinidad, J. C., Wang, X., Kong, D., & Schwarz, T. L. (2014) · Cell · doi:10.1016/j.cell.2014.06.007 · Cited by 283 · cited 2×
“…generated from the time-lapse videos and analyzed with a custom-made ImageJ macro Kymolyzer (Supplemental material; National Institutes of Health; Pekkurnaz et al., 2014). mt-KR activation Before imaging, hippocampal neurons expressing mt-KR were protected from light to prevent inadvertent ROS…”
MethodSelf-citationThe mechanism of action of the respiratory inhibitor, antimycin
Slater, E. C. (1973) · Biochimica et Biophysica Acta (BBA) - Reviews on Bioenergetics · doi:10.1016/0304-4173(73)90002-5 · Cited by 280 · cited 1×
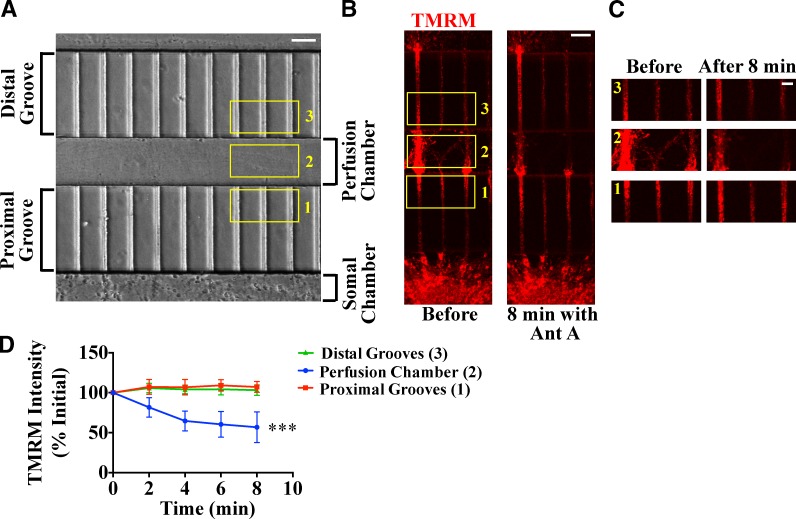
“We there fore used Antimycin A, an inhibitor of respiratory complex III (Slater, 1973), to impair mitochondria.”
A neo-substrate that amplifies catalytic activity of Parkinson's-disease-related kinase PINK1
Hertz, N. T., Berthet, A., Sos, M. L., Thorn, K. S., Burlingame, A. L., Nakamura, K., & Shokat, K. M. (2013) · Cell · doi:10.1016/j.cell.2013.07.030 · Cited by 275
Axonal and dendritic endocytic pathways in cultured neurons.
Parton, R. G., Simons, K., & Dotti, C. G. (1992) · The Journal of Cell Biology · doi:10.1083/jcb.119.1.123 · Cited by 272 · cited 1×
“Kymo-graphs were generated from the time-lapse videos and analyzed with a custom-made ImageJ macro Kymolyzer (Supplemental material; National Institutes of Health; Pekkurnaz et al., 2014).”
Regulation of mitochondrial matrix volume
Kaasik, A., Safiulina, D., Zharkovsky, A., & Veksler, V. (2006) · American Journal of Physiology-Cell Physiology · doi:10.1152/ajpcell.00272.2006 · Cited by 259 · cited 1×
“Accumulation of mitochondrial damage in the brains of PD patients (Keeney et al., 2006; Navarro et al., 2009) and PDlike symptoms caused by mitochondrial drugs, such as Rotenone and MPTP (1methyl4phenyl1,2,3,6tetrahydro pyridine; Betarbet et al., 2000; Przedborski et al., 2004), were the first…”
BackgroundLocal Pruning of Dendrites and Spines by Caspase-3-Dependent and Proteasome-Limited Mechanisms
Ertürk, A., Wang, Y., & Sheng, M. (2014) · Journal of Neuroscience · doi:10.1523/jneurosci.3121-13.2014 · Cited by 234 · cited 2×
“Lightinduced activation of mtKR causes local ROSmediated damage to mitochondria (Bulina et al., 2006; Ertürk et al., 2014) and has been previously used to induce mitophagy in HeLa cells (Yang and Yang, 2011; Wang et al., 2012).”
Laar, V. S. V., Arnold, B. A., Cassady, S. J., Chu, C. T., Burton, E. A., & Berman, S. (2010) · Human Molecular Genetics · doi:10.1093/hmg/ddq531 · Cited by 225 · cited 4×
“The PINK1–Parkin pathway is primarily characterized in nonneuronal cells, and controversy surrounds whether it plays any role in mitochondrial quality control in neuronal processes (Van Laar et al., 2011; Wang et al., 2011; Cai et al., 2012; Grenier et al., 2013).”
BackgroundResultInfluentialRakovic, A., Shurkewitsch, K., Seibler, P., Grünewald, A., Zanon, A., Hagenah, J., Krainc, D., & Klein, C. (2013) · Journal of Biological Chemistry · doi:10.1074/jbc.m112.391680 · Cited by 218 · cited 2×
“Indeed, most studies have focused on mitochondrial quality con trol in the soma (Seibler et al., 2011; Van Laar et al., 2011; Cai et al., 2012; Rakovic et al., 2013), and little is known about mitochondrial clearance from distal axons.”
BackgroundResultMitophagy Selectively Degrades Individual Damaged Mitochondria After Photoirradiation
Kim, I., & Lemasters, J. J. (2010) · Antioxidants and Redox Signaling · doi:10.1089/ars.2010.3768 · Cited by 198
A further update on the role of excitotoxicity in the pathogenesis of Parkinson’s disease
Ambrosi, G., Cerri, S., & Blandini, F. (2014) · Journal of Neural Transmission · doi:10.1007/s00702-013-1149-z · Cited by 195 · cited 1×
“In several neurological diseases, such as PD, excessive neuronal firing is closely associated with neurodegeneration, and excitotoxicityrelated increases in intracellular calcium can lead to ROS production and mitochondrial damage (Ambrosi et al., 2014).”
The ubiquitin E3 ligase parkin regulates the proapoptotic function of Bax
Johnson, B. N., Berger, A. K., Cortese, G. P., & LaVoie, M. J. (2012) · Proceedings of the National Academy of Sciences · doi:10.1073/pnas.1113248109 · Cited by 195
Self-citationVerburg, J., & Hollenbeck, P. J. (2008) · Journal of Neuroscience · doi:10.1523/jneurosci.2614-08.2008 · Cited by 150 · cited 10×
“…fluidic devices that allowed local application of Antimycin A. Compared with the nonspecific ionophore CCCP, Antimycin A is a milder depolarizer and has been previously used to modu late mitochondrial motility in neurons (Miller and Sheetz, 2004; Verburg and Hollenbeck, 2008; Wang et al., 2011).”
BackgroundMethodInfluentialNavarro, A., Boveris, A., Bández, M. J., Sánchez-del-Pino, M. J., Gómez, C., Muntané, G., & Ferrer, I. (2009) · Free Radical Biology and Medicine · doi:10.1016/j.freeradbiomed.2009.03.007 · Cited by 136 · cited 1×
“Hippocampal neurons from embryonic day 18 mouse or rat embryos were dissected and dissociated as previously described (Nie and Sahin, 2012).”
MethodWhat causes the death of dopaminergic neurons in Parkinson’s disease?
Surmeier, D. J., Guzmán, J. N., Sánchez-Padilla, J., & Goldberg, J. A. (2010) · Progress in brain research · doi:10.1016/s0079-6123(10)83004-3 · Cited by 132 · cited 1×
“Despite the fact that dopami nergic neurons are the most pathologically affected cells in PD (Surmeier et al., 2010), the neuronal role of PINK1 and Par kin remained unclear.”
Parkin- and PINK1-Dependent Mitophagy in Neurons: Will the Real Pathway Please Stand Up?
Grenier, K., McLelland, G., & Fon, E. A. (2013) · Frontiers in Neurology · doi:10.3389/fneur.2013.00100 · Cited by 124 · cited 3×
“Mitophagy of damaged mitochondria occurs locally in distal neuronal axons and requires PINK1 and”
BackgroundFerree, A. W., Trudeau, K. M., Zik, E., Benador, I. Y., Twig, G., Gottlieb, R. A., & Shirihai, O. S. (2013) · Autophagy · doi:10.4161/auto.26503 · Cited by 124 · cited 2×
“…before rapid mitophagy, we reexamined the ques tion with locally restricted and nearphysiological levels of our observations of mitochondrial motility arrest (Wang et al., 2011) and the accumulation of aged mitochondrial proteins in distal processes (Ferree et al., 2013) argue against this model.”
In VivoImaging of Disease-Related Mitochondrial Dynamics in a Vertebrate Model System
Plucińska, G., Paquet, D., Hruscha, A., Godinho, L., Haass, C., Schmid, B., & Misgeld, T. (2012) · Journal of Neuroscience · doi:10.1523/jneurosci.1327-12.2012 · Cited by 105 · cited 1×
“However, flux measurements in zebrafish axons indicate a bias for mitochondrial movement in the anterograde direction, suggesting that local removal of distal mitochondria must occur to maintain mitochondrial density (Plucińska et al., 2012).”
BackgroundParkin selectively alters the intrinsic threshold for mitochondrial cytochrome c release
Berger, A. K., Cortese, G. P., Amodeo, K. D., Weihofen, A., Letai, A. G., & LaVoie, M. J. (2009) · Human Molecular Genetics · doi:10.1093/hmg/ddp384 · Cited by 84 · cited 1×
“…antiapoptotic role by limiting the translo cation of proapoptotic Bax to the mitochondrial surface (Johnson et al., 2012a) and increasing the threshold for cytochrome c re lease from mitochondria (Berger et al., 2009), both under nor mal and stress conditions (Johnson et al., 2012b).”
Self-citationSpatiotemporally controlled initiation of Parkin-mediated mitophagy within single cells
Yang, J., & Yang, W. Y. (2011) · Autophagy · doi:10.4161/auto.7.10.16626 · Cited by 58 · cited 2×
“Lightinduced activation of mtKR causes local ROSmediated damage to mitochondria (Bulina et al., 2006; Ertürk et al., 2014) and has been previously used to induce mitophagy in HeLa cells (Yang and Yang, 2011; Wang et al., 2012).”
Bains, M., & Heidenreich, K. A. (2009) · Methods in enzymology on CD-ROM/Methods in enzymology · doi:10.1016/s0076-6879(08)04007-x · Cited by 36 · cited 1×
“RFPLC3 is more stable than GFPLC3 and labels both autophagosomes and autolysosomes (Bains and Heidenreich, 2009), accounting for frequent double labeling of lysosomes with both LAMP1 YFP and RFPLC3.”
A Genetic Model to Dissect the Role of Tsc-mTORC1 in Neuronal Cultures
Nie, D. A., & Şahin, M. (2011) · Methods in molecular biology · doi:10.1007/978-1-61779-430-8_25 · Cited by 17 · cited 1×
“Hippocampal neurons from embryonic day 18 mouse or rat embryos were dissected and dissociated as previously described (Nie and Sahin, 2012).”
MethodRecognizing the cooperative and independent mitochondrial functions of Parkin and PINK1
Johnson, B. N., Charan, R. A., & LaVoie, M. J. (2012) · Cell Cycle · doi:10.4161/cc.21261 · Cited by 16 · cited 2×
“…in mitophagy, Parkin plays a PINK1independent, antiapoptotic role by limiting the translo cation of proapoptotic Bax to the mitochondrial surface (Johnson et al., 2012a) and increasing the threshold for cytochrome c re lease from mitochondria (Berger et al., 2009), both under nor mal and stress…”
BackgroundSelf-citation
Cited by
Sorted by citations
Guidelines for the use and interpretation of assays for monitoring autophagy (4th edition) 1
Klionsky, D. J., Abdel-Aziz, A. K., Abdelfatah, S., Abdellatif, M., Abdoli, A., Abel, S., Abeliovich, H., Abildgaard, M. H., Abudu, Y. P., Acevedo-Arozena, A., et al. (2021) · Autophagy · doi:10.1080/15548627.2020.1797280 · Cited by 2,897
The Roles of PINK1, Parkin, and Mitochondrial Fidelity in Parkinson’s Disease
Pickrell, A. M., & Youle, R. J. (2015) · Neuron · doi:10.1016/j.neuron.2014.12.007 · Cited by 2,310
“Physiological Triggers of Parkin Translocation beyond CCCP It is experimentally convenient in cultured cell lines, in primary neurons (Ashrafi et al., 2014) and in induced pluripotent stem cells (iPSCs) differentiated into neurons (Rakovic et al.”
BackgroundMolecular mechanisms and physiological functions of mitophagy
Onishi, M., Yamano, K., Sato, M., Matsuda, N., & Okamoto, K. (2021) · The EMBO Journal · doi:10.15252/embj.2020104705 · Cited by 1,469
“Because CCCP is highly toxic and induces non-physiological levels of mitochondrial damage especially in neurons, antimycin A is often used to induce mitophagy in neuronal cells (Cai et al , 2012; Ashrafi et al , 2014).”
Selective neuronal vulnerability in Parkinson disease
Surmeier, D. J., Obeso, J. A., & Halliday, G. M. (2017) · Nature Reviews Neuroscience · doi:10.1038/nrn.2016.178 · Cited by 1,116
Compromised autophagy and neurodegenerative diseases
Menzies, F. M., Fleming, A., & Rubinsztein, D. C. (2015) · Nature Reviews Neuroscience · doi:10.1038/nrn3961 · Cited by 851
Metadata
- Authors
- Ashrafi, G., Schlehe, J. S., LaVoie, M. J., & Schwarz, T. L.
- Affiliations
- Boston Children's Hospital (US)
- Brigham and Women's Hospital (US)
- Corresponding author
- Schwarz, Thomas L.
- Venue
- Journal of Cell Biology
- Publisher
- Rockefeller University Press
- Published
- 2014-08-25
- Volume
- 206
- Issue
- 5
- Pages
- 655-670
- ISSN
- 0021-9525 (ISSN-L)
- 1540-8140
- PMC
- PMC4151150
- OpenAlex
- W1992264711
- Cited by
- 502
- References
- 65
- Citations by year
- 2026: 18 · 2025: 22 · 2024: 39 · 2023: 25 · 2022: 39 · 2021: 53 · 2020: 53 · 2019: 51 · 2018: 49 · 2017: 49 · 2016: 51 · 2015: 46 · 2014: 7
- FWCI
- 38.33
- Type
- journal article
- Language
- en
- Open access
- hybrid
- doi.org
- Licence
- cc-by-nc-sa
- Locations
- The Journal of Cell Biology (publishedVersion, cc-by-nc-sa)
- PubMed Central (publishedVersion, cc-by-nc-sa)
- PubMed (publishedVersion)
- Digital Access to Scholarship at Harvard (DASH) (Harvard University) (submittedVersion, cc-by)
- Funders
- National Institute of General Medical Sciences (GM069808, R01GM069808)
- National Institute of Neurological Disorders and Stroke (R21NS069949, R01NS065013, NS065013, NS069949)
- Eunice Kennedy Shriver National Institute of Child Health and Human Development (HD-01866, P30HD018655)
- Topics
- Life Sciences › Biochemistry, Genetics and Molecular Biology › Cell Biology › Autophagy in Disease and Therapy
- Health Sciences › Medicine › Clinical Neurology › Parkinson's Disease Mechanisms and Treatments
- Life Sciences › Biochemistry, Genetics and Molecular Biology › Molecular Biology › Ubiquitin and proteasome pathways
- Keywords
- mitophagy, PINK1, Parkin, axons, mitochondrial damage, Parkinson's disease, autophagosomes, lysosomes, oxidative stress, neuroprotection, hippocampal neurons, retrograde transport, mitochondrial quality control
- MeSH terms
- PTEN-Induced Putative Kinase, Animals, Antimycin A, Autophagy, Axons, Cells, Cultured, Female, Lysosomes, Mice, Inbred C57BL, Microtubule-Associated Proteins, Mitochondria, Phagosomes, Protein Kinases, Veratridine, Rats, Sprague-Dawley, Mice, Knockout, Rats, Long-Evans, Protein Transport, Ubiquitin-Protein Ligases, Mice, Rats, Membrane Potential, Mitochondrial, Mice, 129 Strain, Mitophagy
About these checks
Registry, retraction, Cites and statistics results are computed, not judged, with one exception: a printed reference that no index lists is read once by a model before it counts as a citation error. Claims are extracted by a model and kept only when their quote appears verbatim in the text; each cited source is then checked, with a model’s help, for whether it says what the claim relies on. Those verdicts can be wrong — read the claim’s quote and the cited source before relying on one.
Statistics and arithmetic are recomputed, not judged.
Confidence bands are shown only for fields calibrated on our annotated test set. None is calibrated yet, so no band is shown.
What counts as a claim ›How we measure confidence ›How we check this ›
Are you an author, or do you see a problem with this page? Request a review
