

The DOI matches its Crossref record; 72 of the 73 references it cites were found in a registry or an index.
Heat stress induces ferroptosis-like cell death in plants
Open accessAbstract
In plants, regulated cell death (RCD) plays critical roles during development and is essential for plant-specific responses to abiotic and biotic stresses. Ferroptosis is an iron-dependent, oxidative, nonapoptotic form of cell death recently described in animal cells. In animal cells, this process can be triggered by depletion of glutathione (GSH) and accumulation of lipid reactive oxygen species (ROS). We investigated whether a similar process could be relevant to cell death in plants. Remarkably, heat shock (HS)–induced RCD, but not reproductive or vascular development, was found to involve a ferroptosis-like cell death process. In root cells, HS triggered an iron-dependent cell death pathway that was characterized by depletion of GSH and ascorbic acid and accumulation of cytosolic and lipid ROS. These results suggest a physiological role for this lethal pathway in response to heat stress in Arabidopsis thaliana. The similarity of ferroptosis in animal cells and ferroptosis-like death in plants suggests that oxidative, iron-dependent cell death programs may be evolutionarily ancient.
Overview
The claims and statistics of this paper haven’t been checked yet.
Run the check — free, no account needed. It reads the open-access text and checks the sources it cites.
Integrity signals
Registry
Cites
Statistics
Figures
Verification
Claims the paper makes
The claims and statistics of this paper haven’t been checked yet.
Run the check — free, no account needed. It reads the open-access text and checks the sources it cites.
Claims other papers make about this one
Each is checked against this paper’s own text: does it say what the citing paper says it does?
In the citing paper
“a ferroptosis-like RCD subroutine has been described in plants responding to moderate heat stress, supporting some degree of evolutionary conservation and the relevance of ferroptosis for organismal homeostasis [601].”
From Molecular mechanisms of cell death: recommendations of the nomenclature committee on cell death 2018. (2018) · cites this paper as [601]
Self-check
Percentages, sums and reported differences re-computed from the paper’s own numbers.
The self-check needs the paper’s full text.
Citations
Cites
Ferroptosis: An Iron-Dependent Form of Nonapoptotic Cell Death
Dixon, S. J., Lemberg, K. M., Lamprecht, M. R., Skouta, R., Zaitsev, E. M., Gleason, C. E., Patel, D. N., Bauer, A. J., Cantley, A. M., Yang, W. S., et al. (2012) · Cell · doi:10.1016/j.cell.2012.03.042 · Cited by 18,691
Self-citationRegulation of Ferroptotic Cancer Cell Death by GPX4
Yang, W. S., SriRamaratnam, R., Welsch, M. E., Shimada, K., Skouta, R., Viswanathan, V. S., Cheah, J. H., Clemons, P. A., Shamji, A. F., Clish, C. B., et al. (2014) · Cell · doi:10.1016/j.cell.2013.12.010 · Cited by 7,713
Self-citationGriffith, O. W. (1980) · Analytical Biochemistry · doi:10.1016/0003-2697(80)90139-6 · Cited by 4,628
Heat tolerance in plants: An overview
Wahid, A., Gelani, S., Ashraf, M., & Foolad, M. R. (2007) · Environmental and Experimental Botany · doi:10.1016/j.envexpbot.2007.05.011 · Cited by 4,218
Inactivation of the ferroptosis regulator Gpx4 triggers acute renal failure in mice
Friedmann Angeli, J. P., Schneider, M., Proneth, B., Tyurina, Y. Y., Tyurin, V. A., Hammond, V. J., Herbach, N., Aichler, M., Walch, A., Eggenhofer, E., et al. (2014) · Nature Cell Biology · doi:10.1038/ncb3064 · Cited by 3,732
Self-citationClassification of cell death: recommendations of the Nomenclature Committee on Cell Death 2009
Kroemer, G., Galluzzi, L., Vandenabeele, P., Abrams, J., Alnemri, E. S., Baehrecke, E. H., Blagosklonny, M. V., El-Deiry, W. S., Golstein, P., Green, D. R., et al. (2009) · Cell Death & Differentiation · doi:10.1038/cdd.2008.150 · Cited by 3,399
Pyroptosis: host cell death and inflammation
Bergsbaken, T., Fink, S. L., & Cookson, B. T. (2009) · Nature Reviews Microbiology · doi:10.1038/nrmicro2070 · Cited by 3,288
Ascorbate and Glutathione: The Heart of the Redox Hub
Foyer, C. H., & Noctor, G. (2011) · PLANT PHYSIOLOGY · doi:10.1104/pp.110.167569 · Cited by 2,559
Peroxidation of polyunsaturated fatty acids by lipoxygenases drives ferroptosis
Yang, W. S., Kim, K. J., Gaschler, M. M., Patel, M., Shchepinov, M. S., & Stockwell, B. R. (2016) · Proceedings of the National Academy of Sciences · doi:10.1073/pnas.1603244113 · Cited by 2,329
Self-citationAutophagosome formation: core machinery and adaptations
Xie, Z., & Klionsky, D. J. (2007) · Nature Cell Biology · doi:10.1038/ncb1007-1102 · Cited by 2,237
Dixon, S. J., Patel, D. N., Welsch, M., Skouta, R., Lee, E. D., Hayano, M., Thomas, A. G., Gleason, C. E., Tatonetti, N. P., Slusher, B. S., et al. (2014) · eLife · doi:10.7554/elife.02523 · Cited by 2,088
Self-citationBita, C. E., & Gerats, T. (2013) · Frontiers in Plant Science · doi:10.3389/fpls.2013.00273 · Cited by 1,896
Yang, W. S., & Stockwell, B. R. (2008) · Chemistry & Biology · doi:10.1016/j.chembiol.2008.02.010 · Cited by 1,876
Self-citationRAS–RAF–MEK-dependent oxidative cell death involving voltage-dependent anion channels
Yagoda, N., von Rechenberg, M., Zaganjor, E., Bauer, A. J., Yang, W. S., Fridman, D. J., Wolpaw, A. J., Smukste, I., Peltier, J. M., Boniface, J. J., et al. (2007) · Nature · doi:10.1038/nature05859 · Cited by 1,631
Self-citationLindsten, T., Ross, A. J., King, A., Zong, W.-X., Rathmell, J. C., Shiels, H. A., Ulrich, E., Waymire, K. G., Mahar, P., Frauwirth, K., et al. (2000) · Molecular Cell · doi:10.1016/s1097-2765(00)00136-2 · Cited by 1,489
Differential Requirement for Caspase 9 in Apoptotic Pathways In Vivo
Hakem, R., Hakem, A., Duncan, G. S., Henderson, J. T., Woo, M., Soengas, M. S., Elia, A., de la Pompa, J. L., Kägi, D., Khoo, W., et al. (1998) · Cell · doi:10.1016/s0092-8674(00)81477-4 · Cited by 1,296
Ferrostatins Inhibit Oxidative Lipid Damage and Cell Death in Diverse Disease Models
Skouta, R., Dixon, S. J., Wang, J., Dunn, D. E., Orman, M., Shimada, K., Rosenberg, P. A., Lo, D. C., Weinberg, J. M., Linkermann, A., et al. (2014) · Journal of the American Chemical Society · doi:10.1021/ja411006a · Cited by 1,146 · cited 6×
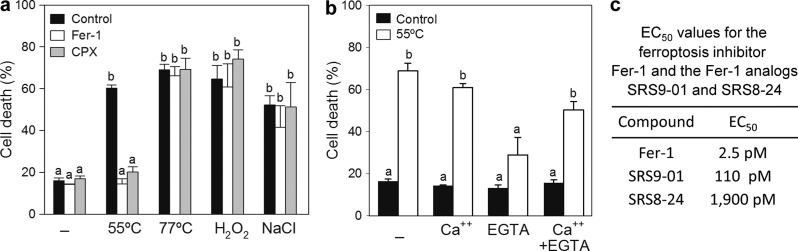
“Substitution of the primary aromatic amine, which is essential for antioxidant function (SRS9-01 and SRS8-24) resulted in less protection against cell death, as reported for animal cells (Dixon et al., 2012; Skouta et al., 2014).”
BackgroundInfluentialSelf-citationApaf1 Is Required for Mitochondrial Pathways of Apoptosis and Brain Development
Yoshida, H., Kong, Y., Yoshida, R., Elia, A., Hakem, A., Hakem, R., Penninger, J. M., & Mak, T. W. (1998) · Cell · doi:10.1016/s0092-8674(00)81733-x · Cited by 1,138
Synchronized renal tubular cell death involves ferroptosis
Linkermann, A., Skouta, R., Himmerkus, N., Mulay, S. R., Dewitz, C., De Zen, F., Prokai, A., Zuchtriegel, G., Krombach, F., Welz, P.-S., et al. (2014) · Proceedings of the National Academy of Sciences · doi:10.1073/pnas.1415518111 · Cited by 1,126
Self-citationArabidopsis WRKY33 transcription factor is required for resistance to necrotrophic fungal pathogens
Zheng, Z., Qamar, S. A., Chen, Z., & Mengiste, T. D. (2006) · The Plant Journal · doi:10.1111/j.1365-313x.2006.02901.x · Cited by 978
Dagda, R. K., Cherra, S. J., Kulich, S. M., Tandon, A., Park, D., & Chu, C. T. (2009) · Journal of Biological Chemistry · doi:10.1074/jbc.m808515200 · Cited by 954
Necroptosis as an alternative form of programmed cell death
Christofferson, D. E., & Yuan, J. (2010) · Current Opinion in Cell Biology · doi:10.1016/j.ceb.2009.12.003 · Cited by 794
Han, D., Antunes, F., Canali, R., Rettori, D., & Cadenas, E. (2003) · Journal of Biological Chemistry · doi:10.1074/jbc.m210269200 · Cited by 711
HSPB1 as a novel regulator of ferroptotic cancer cell death
Sun, X., Ou, Z., Xie, M., Kang, R., Fan, Y., Niu, X., Wang, H., Cao, L., & Tang, D. (2015) · Oncogene · doi:10.1038/onc.2015.32 · Cited by 666
Programmed cell death and aerenchyma formation in roots
DREW, M. C., He, C.-J., & Morgan, P. W. (2000) · Trends in Plant Science · doi:10.1016/s1360-1385(00)01570-3 · Cited by 593
Morphological classification of plant cell deaths
van Doorn, W. G., Beers, E. P., Dangl, J. L., Franklin-Tong, V. E., Gallois, P., Hara-Nishimura, I., Jones, A. M., Kawai-Yamada, M., Lam, E., Mundy, J., et al. (2011) · Cell Death & Differentiation · doi:10.1038/cdd.2011.36 · Cited by 584
Auxin-resistant mutants of Arabidopsis thaliana with an altered morphology
Estelle, M. A., & Somerville, C. (1987) · Molecular and General Genetics MGG · doi:10.1007/bf00333575 · Cited by 576
Marty, F. (1999) · The Plant Cell · doi:10.1105/tpc.11.4.587 · Cited by 511
Oxidative Stimulation of Glutathione Synthesis in Arabidopsis thaliana Suspension Cultures
May, M. J., & Leaver, C. J. (1993) · PLANT PHYSIOLOGY · doi:10.1104/pp.103.2.621 · Cited by 429
Arabidopsis Type I Metacaspases Control Cell Death
Coll, N. S., Vercammen, D., Smidler, A. L., Clover, C. M. W., Breusegem, F. V., Dangl, J. L., & Epple, P. (2010) · Science · doi:10.1126/science.1194980 · Cited by 426
Autophagy is required for tolerance of drought and salt stress in plants
Liu, Y., Xiong, Y., & Bassham, D. C. (2009) · Autophagy · doi:10.4161/auto.5.7.9290 · Cited by 422
A Gene Regulatory Network for Root Epidermis Cell Differentiation in Arabidopsis
Bruex, A., Kainkaryam, R. M., Wieckowski, Y., Kang, Y. H., Bernhardt, C., Xia, Y., Zheng, X., Wang, J. Y., Lee, M. M., Benfey, P. N., et al. (2012) · PLoS Genetics · doi:10.1371/journal.pgen.1002446 · Cited by 355
Ascorbic Acid Deficiency Activates Cell Death and Disease Resistance Responses in Arabidopsis
Pavet, V., Olmos, E., Kiddle, G. A., Mowla, S., Kumar, S., ANTONIW, J. F., Álvarez, M. E., & Foyer, C. H. (2005) · PLANT PHYSIOLOGY · doi:10.1104/pp.105.067686 · Cited by 344
Programmed Cell Death in Development and Defense
Jones, A. M. (2001) · PLANT PHYSIOLOGY · doi:10.1104/pp.125.1.94 · Cited by 330
Kranner, I., Birtić, S., Anderson, K. M., & Pritchard, H. W. (2006) · Free Radical Biology and Medicine · doi:10.1016/j.freeradbiomed.2006.02.013 · Cited by 329
Bartoli, C. G. (2006) · Journal of Experimental Botany · doi:10.1093/jxb/erl005 · Cited by 299
Self-citationThe role of vacuole in plant cell death
Hara‐Nishimura, I., & Hatsugai, N. (2011) · Cell Death and Differentiation · doi:10.1038/cdd.2011.70 · Cited by 260
Glutathione Efflux and Cell Death
Franco, R., & Cidlowski, J. A. (2012) · Antioxidants and Redox Signaling · doi:10.1089/ars.2012.4553 · Cited by 254
Apoptotic‐like programmed cell death in plants
Reape, T. J., & McCabe, P. F. (2008) · New Phytologist · doi:10.1111/j.1469-8137.2008.02549.x · Cited by 252
Vacuolar processing enzyme: an executor of plant cell death
Hara‐Nishimura, I., Hatsugai, N., Nakaune, S., Kuroyanagi, M., & Nishimura, M. (2005) · Current Opinion in Plant Biology · doi:10.1016/j.pbi.2005.05.016 · Cited by 244
Comparative pharmacology of chemically distinct nadph oxidase inhibitors
Wind, S., Beuerlein, K., Eucker, T., Müller, H., Scheurer, P., Armitage, M., Ho, H., Schmidt, H., & Wingler, K. (2010) · British Journal of Pharmacology · doi:10.1111/j.1476-5381.2010.00920.x · Cited by 241
Danon, A., Rotari, V. I., Gordon, A., Mailhac, N., & Gallois, P. (2003) · Journal of Biological Chemistry · doi:10.1074/jbc.m304468200 · Cited by 230
Meiri, D., & Breiman, A. (2009) · The Plant Journal · doi:10.1111/j.1365-313x.2009.03878.x · Cited by 229
Xylem cell death: emerging understanding of regulation and function
Bollhöner, B., Prestele, J., & Tuominen, H. (2012) · Journal of Experimental Botany · doi:10.1093/jxb/err438 · Cited by 216
HanumanthaRao, B., Nair, R. M., & Nayyar, H. (2016) · Frontiers in Plant Science · doi:10.3389/fpls.2016.00957 · Cited by 216
Only in dying, life: programmed cell death during plant development
Hautegem, T. V., Waters, A. J., Goodrich, J., & Nowack, M. K. (2014) · Trends in Plant Science · doi:10.1016/j.tplants.2014.10.003 · Cited by 215
Ohama, N., Kusakabe, K., Mizoi, J., Zhao, H., Kidokoro, S., Koizumi, S., Takahashi, F., Ishida, T., Yanagisawa, S., Shinozaki, K., et al. (2015) · The Plant Cell · doi:10.1105/tpc.15.00435 · Cited by 208
Programmed Cell Death Remodels Lace Plant Leaf Shape during Development[W]
Gunawardena, A. H. L. A. N., Greenwood, J. S., & Dengler, N. G. (2004) · The Plant Cell · doi:10.1105/tpc.016188 · Cited by 196
The grateful dead: calcium and cell death in plant innate immunity
Ma, W., & Berkowitz, G. A. (2007) · Cellular Microbiology · doi:10.1111/j.1462-5822.2007.01031.x · Cited by 196
Drews, G. N., & Koltunow, A. M. (2011) · The Arabidopsis Book · doi:10.1199/tab.0155 · Cited by 196
Ozgur, R., Türkan, İ., Uzilday, B., & Sekmen, A. H. (2014) · Journal of Experimental Botany · doi:10.1093/jxb/eru034 · Cited by 180
Kwon, S. I., Cho, H. J., Jung, J. H., Yoshimoto, K., Shirasu, K., & Park, O. K. (2010) · The Plant Journal · doi:10.1111/j.1365-313x.2010.04315.x · Cited by 175
Mitochondrial GFA2 Is Required for Synergid Cell Death in Arabidopsis
Christensen, C. A., Gorsich, S. W., Brown, R. H., Jones, L. G., Brown, J., Shaw, J. M., & Drews, G. N. (2002) · The Plant Cell · doi:10.1105/tpc.002170 · Cited by 175
A unique program for cell death in xylem fibers of Populus stem
Courtois-Moreau, C., Pesquet, E., Sjödin, A., Muñiz, L. M., Bollhöner, B., Kaneda, M., Samuels, L., Jansson, S., & Tuominen, H. (2008) · The Plant Journal · doi:10.1111/j.1365-313x.2008.03777.x · Cited by 175
Small heat-shock proteins protect from heat-stroke-associated neurodegeneration
Kourtis, N., Nikoletopoulou, V., & Tavernarakis, N. (2012) · Nature · doi:10.1038/nature11417 · Cited by 173
Activation of autophagy by unfolded proteins during endoplasmic reticulum stress
Yang, X., Srivastava, R., Howell, S. H., & Bassham, D. C. (2015) · The Plant Journal · doi:10.1111/tpj.13091 · Cited by 173
Programmed cell death and tissue remodelling in plants: Fig. 1.
Gunawardena, A. H. L. A. N. (2007) · Journal of Experimental Botany · doi:10.1093/jxb/erm189 · Cited by 129
ROS signaling as common element in low oxygen and heat stresses
Pucciariello, C., Banti, V., & Pierdomenico Perata, A. (2012) · Plant Physiology and Biochemistry · doi:10.1016/j.plaphy.2012.02.016 · Cited by 128
Synergid Cell Death in Arabidopsis Is Triggered following Direct Interaction with the Pollen Tube
Sandaklie-Nikolova, L., Palanivelu, R., King, E. J., Copenhaver, G. P., & Drews, G. N. (2007) · PLANT PHYSIOLOGY · doi:10.1104/pp.107.098236 · Cited by 111
The Arabidopsis peptide kiss of death is an inducer of programmed cell death
Blanvillain, R., Young, B., Cai, Y., Hecht, V. F. G., Varoquaux, F., Delorme‐Hinoux, V., Lancelin, J., Delseny, M., & Gallois, P. (2011) · The EMBO Journal · doi:10.1038/emboj.2011.14 · Cited by 107
A Novel Family of Transporters Mediating the Transport of Glutathione Derivatives in Plants
Zhang, M., Bourbouloux, A., Cagnac, O., Srikanth, C. V., Rentsch, D., Bachhawat, A. K., & Delrot, S. (2004) · PLANT PHYSIOLOGY · doi:10.1104/pp.103.030940 · Cited by 102
The antimycotic ciclopirox olamine induces HIF‐1α stability, VEGF expression, and angiogenesis
Linden, T., Katschinski, D. M., Eckhardt, K., Scheid, A., Pagel, H., & Wenger, R. H. (2003) · The FASEB Journal · doi:10.1096/fj.02-0586fje · Cited by 102
Inhibition of cathepsin B by caspase-3 inhibitors blocks programmed cell death in Arabidopsis
Ge, Y., Cai, Y., Bonneau, L., Rotari, V., Danon, A., McKenzie, E. A., McLellan, H., Mach, L., & Gallois, P. (2016) · Cell Death and Differentiation · doi:10.1038/cdd.2016.34 · Cited by 102
Henke, N., Albrecht, P., Bouchachia, I., Ryazantseva, M., Knoll, K., Lewerenz, J., Kaznacheyeva, E. V., Maher, P. A., & Methner, A. (2013) · Cell Death and Disease · doi:10.1038/cddis.2012.216 · Cited by 97
Ramírez, L., Bartoli, C. G., & Lamattina, L. (2013) · Journal of Experimental Botany · doi:10.1093/jxb/ert153 · Cited by 95
Self-citationCharacterization of Glutathione Uptake in Broad Bean Leaf Protoplasts
Jamaï, A., Tommasini, R., Martinoia, E., & Delrot, S. (1996) · PLANT PHYSIOLOGY · doi:10.1104/pp.111.4.1145 · Cited by 83
Genes for Plant Autophagy: Functions and Interactions
Kim, S.-H., Kwon, C., Lee, J., & Chung, T. (2012) · Molecules and Cells · doi:10.1007/s10059-012-0098-y · Cited by 72
Robert, N., d’Erfurth, I., Marmagne, A., Erhardt, M., Allot, M., Boivin, K., Gissot, L., Monachello, D., Michaud, M., Duchêne, A., et al. (2012) · Plant Molecular Biology · doi:10.1007/s11103-012-9874-5 · Cited by 59
An in vivo root hair assay for determining rates of apoptotic-like programmed cell death in plants
Hogg, B. V., Kacprzyk, J., Molony, E. M., O’Reilly, C., Gallagher, T. F., Gallois, P., & McCabe, P. F. (2011) · Plant Methods · doi:10.1186/1746-4811-7-45 · Cited by 50
Kariya, K., Demiral, T., Sasaki, T., Tsuchiya, Y., Türkan, İ., Sano, T., Hasezawa, S., & Yamamoto, Y. (2013) · Journal of Inorganic Biochemistry · doi:10.1016/j.jinorgbio.2013.07.001 · Cited by 39
The Fate of the Plant Embryo's Suspensor: Balancing Life and Death
Choi, C. Q. (2013) · PLoS Biology · doi:10.1371/journal.pbio.1001656 · Cited by 9
Spectrophotometric determination of iron(III) with Ciclopirox olamine
KURIKI, T., TSUJIYAMA, T., SUZUKI, N., & Suzuki, N. (1975) · BUNSEKI KAGAKU · doi:10.2116/bunsekikagaku.24.112 · Cited by 1
Research works printed but not linked: 1
- Schneider, 1992, Reduced glutathione (GSH) transport in cultured tobacco cells, Plant Physiol. Biochem., 30, 29
Cited by
Sorted by citations
Ferroptosis: A Regulated Cell Death Nexus Linking Metabolism, Redox Biology, and Disease
Stockwell, B. R., Friedmann Angeli, J. P., Bayir, H., Bush, A. I., Conrad, M., Dixon, S. J., Fulda, S., Gascón, S., Hatzios, S. K., Kagan, V. E., et al. (2017) · Cell · doi:10.1016/j.cell.2017.09.021 · Cited by 7,695
Self-citationFerroptosis: mechanisms, biology and role in disease
Jiang, X., Stockwell, B. R., & Conrad, M. (2021) · Nature Reviews Molecular Cell Biology · doi:10.1038/s41580-020-00324-8 · Cited by 7,973
Self-citationGalluzzi, L., Vitale, I., Aaronson, S. A., Abrams, J. M., Adam, D., Agostinis, P., Alnemri, E. S., Altucci, L., Amelio, I., Andrews, D. W., et al. (2018) · Cell Death & Differentiation · doi:10.1038/s41418-017-0012-4 · Cited by 6,680
Self-citationFerroptosis: molecular mechanisms and health implications
Tang, D., Chen, X., Kang, R., & Kroemer, G. (2020) · Cell Research · doi:10.1038/s41422-020-00441-1 · Cited by 4,495
Ferroptosis turns 10: Emerging mechanisms, physiological functions, and therapeutic applications
Stockwell, B. R. (2022) · Cell · doi:10.1016/j.cell.2022.06.003 · Cited by 3,211
Self-citation
Metadata
- Authors
- Distéfano, A. M., Martin, M. V., Córdoba, J. P., Bellido, A. M., D’Ippólito, S., Colman, S. L., Soto, D., Roldán, J. A., Bartoli, C. G., Zabaleta, E. J., Fiol, D. F., Stockwell, B. R., Dixon, S. J., & Pagnussat, G. C.
- Affiliations
- Consejo Nacional de Investigaciones Científicas y Técnicas (AR)
- Columbia University (US)
- Stanford University (US)
- Corresponding author
- Dixon, Scott J.
- Pagnussat, Gabriela Carolina
- ORCID
- Venue
- Journal of Cell Biology
- Publisher
- Rockefeller University Press
- Published
- 2017-01-18
- Volume
- 216
- Issue
- 2
- Pages
- 463-476
- ISSN
- 0021-9525 (ISSN-L)
- 1540-8140
- PMC
- PMC5294777
- OpenAlex
- W2577539162
- Cited by
- 268
- References
- 73
- Citations by year
- 2026: 17 · 2025: 33 · 2024: 43 · 2023: 29 · 2022: 36 · 2021: 50 · 2020: 25 · 2019: 12 · 2018: 11 · 2017: 11
- FWCI
- 13.34
- Type
- journal article
- Language
- en
- Open access
- hybrid
- doi.org
- Licence
- Locations
- The Journal of Cell Biology (publishedVersion, cc-by-nc-sa)
- PubMed Central (publishedVersion, cc-by-nc-sa)
- Americanae (AECID Library) (publishedVersion, other-oa)
- PubMed (publishedVersion)
- LA Referencia (Red Federada de Repositorios Institucionales de Publicaciones Científicas) (submittedVersion, cc-by-nc-sa)
- Funders
- Howard Hughes Medical Institute (55007430)
- National Institutes of Health (5R01CA097061, R35CA209896)
- National Cancer Institute (4R00CA166517-03)
- Topics
- Life Sciences › Biochemistry, Genetics and Molecular Biology › Cancer Research › Ferroptosis and cancer prognosis
- Life Sciences › Agricultural and Biological Sciences › Plant Science › Plant Stress Responses and Tolerance
- Life Sciences › Biochemistry, Genetics and Molecular Biology › Molecular Biology › Cell death mechanisms and regulation
- Keywords
- ferroptosis, heat stress, regulated cell death, plant cell death, iron-dependent cell death, glutathione depletion, vitamin C, lipid reactive oxygen species, oxidative stress, root cells, Arabidopsis thaliana
- MeSH terms
- Antioxidants, Ascorbic Acid, Glutathione, Hot Temperature, Iron, Iron Chelating Agents, Microscopy, Fluorescence, Oxidation-Reduction, Plant Proteins, Time Factors, Lipid Peroxidation, Signal Transduction, Cell Death, Arabidopsis, Reactive Oxygen Species, Oxidative Stress, Plant Roots, Heat-Shock Response, Evolution, Molecular
About these checks
Registry, retraction, Cites and statistics results are computed, not judged, with one exception: a printed reference that no index lists is read once by a model before it counts as a citation error. Claims are extracted by a model and kept only when their quote appears verbatim in the text; each cited source is then checked, with a model’s help, for whether it says what the claim relies on. Those verdicts can be wrong — read the claim’s quote and the cited source before relying on one.
Statistics and arithmetic are recomputed, not judged.
Confidence bands are shown only for fields calibrated on our annotated test set. None is calibrated yet, so no band is shown.
What counts as a claim ›How we measure confidence ›How we check this ›
Are you an author, or do you see a problem with this page? Request a review
