Student or educator? Sign up with your school email and get 6 months of Pro free.
Cited by 9Cellular Mechanics and InteractionsProtein Structure and DynamicsMicrotubule and mitosis dynamics

The DOI matches its Crossref record; 55 of the 55 references it cites were found in a registry or an index.

Structure of the F-tractin–F-actin complex

Open access
Shatskiy, Dmitry, Sivan, Athul, Wedlich-Söldner, Roland, Belyy, Alexander·2025·Journal of Cell Biology

Published version of a preprint

Abstract

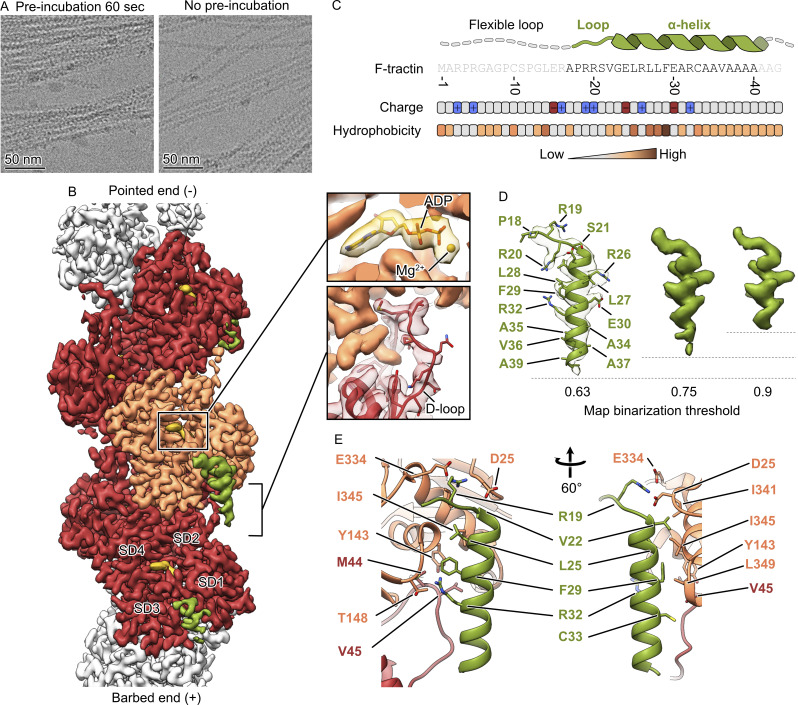
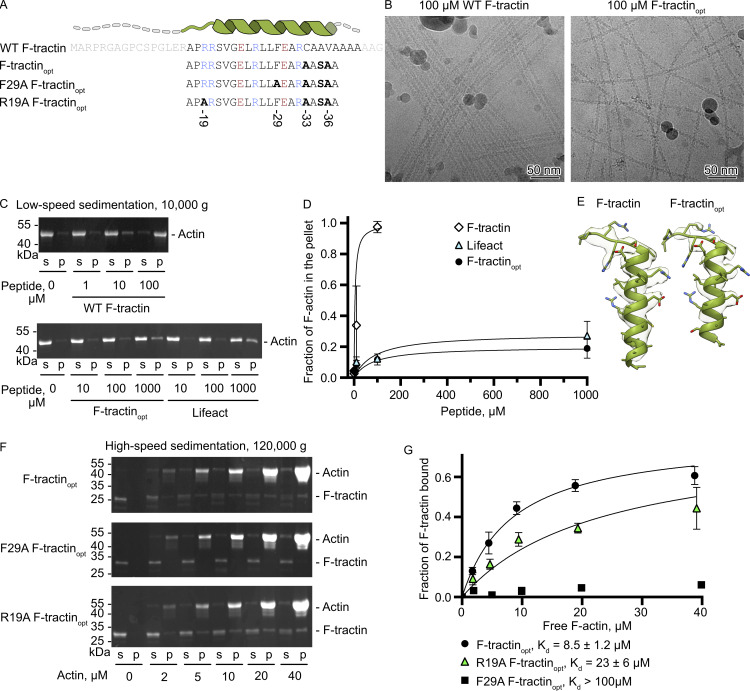
F-tractin is a peptide widely used to visualize the actin cytoskeleton in live eukaryotic cells but has been reported to impair cell migration and induce actin bundling at high expression levels. To elucidate these effects, we determined the cryo-EM structure of the F-tractin–F-actin complex, revealing that F-tractin consists of a flexible N-terminal region and an amphipathic C-terminal helix. The N-terminal part is dispensable for F-actin binding but responsible for the bundling effect. Based on these insights, we developed an optimized F-tractin, which eliminates the N-terminal region and minimizes bundling while retaining strong actin labeling. The C-terminal helix interacts with a hydrophobic pocket formed by two neighboring actin subunits, an interaction region shared by many actin-binding polypeptides, including the popular actin-binding probe Lifeact. Thus, rather than contrasting F-tractin and Lifeact, our data indicate that these peptides have analogous modes of interaction with F-actin. Our study dissects the structural elements of F-tractin and provides a foundation for developing future actin probes.

Overview

The claims and statistics of this paper haven’t been checked yet.

Run the check — free, no account needed. It reads the open-access text and checks the sources it cites.

A few free checks a day · papers already verified open instantly · results are public

Integrity signals

Registry

Crossref · 10.1083/jcb.202409192

Cites

55 of 55 references verified0 citation errors · 0 not checkable

Statistics

Figures

Figure 1. Cryo-EM structure of the F-tractin–F-actin complex. (A) Cryo-EM micrographs of actin filaments after mixing with F-tractin with (left) and without preincubation (right). (B) The 3.2 Å map of the F-tractin–F-actin complex shows a clear density for actin (orange and red), ADP (gold), and the F-tractin peptide (green). SD – subdomain. (C) The amino acid sequence of F-tractin, the distribution of its charged and hydrophobic residues, and the schematic structure of the peptide. (D) F-tractin and its corresponding density at different map binarization thresholds, illustrating the flexibility of the extreme C-terminus. (E) Atomic model of the F-tractin-F-actin interface.
Figure 1. Cryo-EM structure of the F-tractin–F-actin complex. (A) Cryo-EM micrographs of actin filaments after mixing with F-tractin with (left) and without preincubation (right). (B) The 3.2 Å map of the F-tractin–F-actin complex shows a clear density for actin (orange and red), ADP (gold), and the F-tractin peptide (green). SD – subdomain. (C) The amino acid sequence of F-tractin, the distribution of its charged and hydrophobic residues, and the schematic structure of the peptide. (D) F-tractin and its corresponding density at different map binarization thresholds, illustrating the flexibility of the extreme C-terminus. (E) Atomic model of the F-tractin-F-actin interface.CC BY · PubMed Central
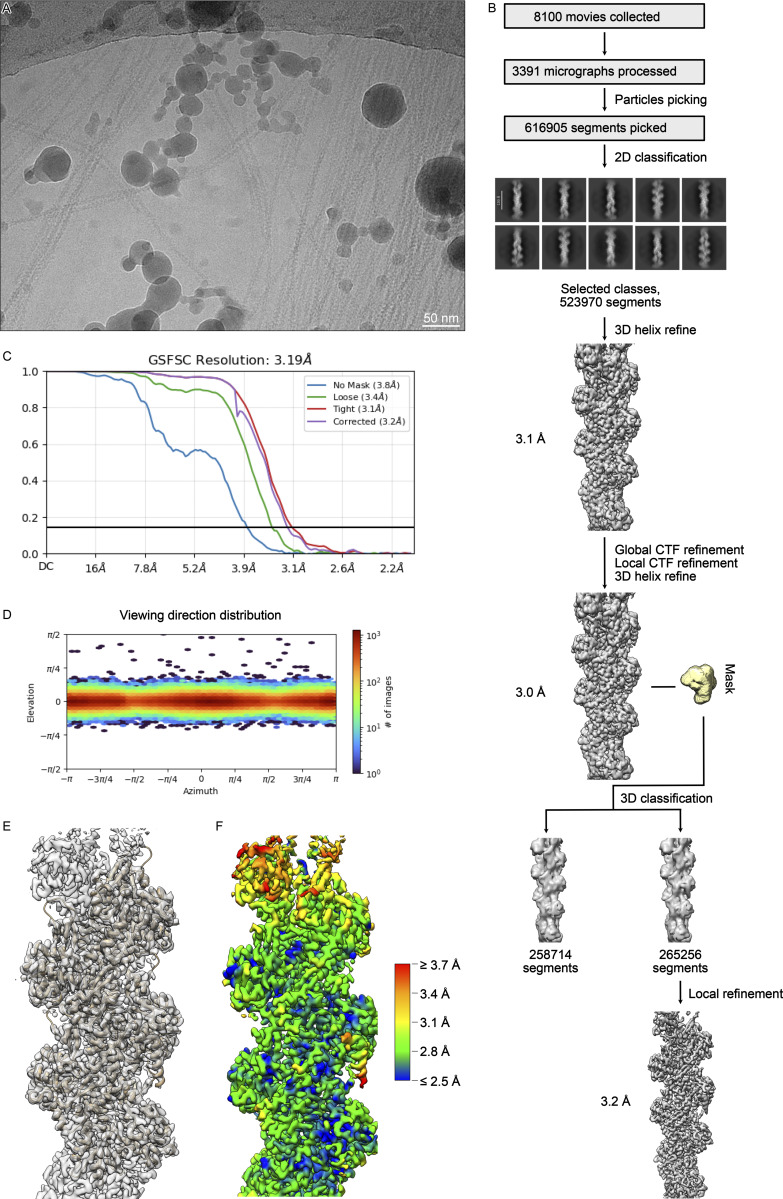
Figure S1. Processing of the F-tractin-F-actin complex. (A) An example of the 3,391 analyzed cryo-EM micrographs. (B) Processing overview. (C) Fourier shell correlation curve of the final reconstruction. (D) Angular distribution. (E) Fit of the molecular model into the cryo-EM density. (F) Local resolution gradient of the reconstruction calculated at the FSC threshold of 0.143.
Figure S1. Processing of the F-tractin-F-actin complex. (A) An example of the 3,391 analyzed cryo-EM micrographs. (B) Processing overview. (C) Fourier shell correlation curve of the final reconstruction. (D) Angular distribution. (E) Fit of the molecular model into the cryo-EM density. (F) Local resolution gradient of the reconstruction calculated at the FSC threshold of 0.143.CC BY · PubMed Central
Figure 2. Point mutations and deletions in F-tractin alter its interaction with F-actin. (A) Amino acid sequence of F-tractin variants. Amino acids colored in light grey were not observed in the cryo-EM reconstruction. Amino acids colored in blue and red correspond to positively and negatively charged residues, respectively. (B) Cryo-EM micrographs of F-actin mixed with 100 µM of WT F-tractin or F-tractinopt. (C) Actin bundling assay using low-speed centrifugation of F-actin in the presence of WT F-tractin, F-tractinopt, or Lifeact. Representative SDS-PAGE from three independent experiments are shown. (D) The level of actin bundling was quantified by densitometry and plotted against peptide concentrations. (E) Structures of WT F-tractin and F-tractinopt fitted into their cryo-EM densities. (F) Cosedimentation of F-actin and 2 μM of F-tractin-mCherry with supernatant (s), and pellet (p) fractions analyzed by SDS-PAGE. The upper band corresponds to actin and the lower band corresponds to F-tractinopt–mCherry. Representative stain-free gels are shown. (G) The fractions of F-tractinopt–mCherry that cosedimented with F-actin were quantified by densitometry and plotted against actin concentrations. Error bars in D and G correspond to standard deviations of three independent experiments. Source data are available for this figure: SourceData F2.
Figure 2. Point mutations and deletions in F-tractin alter its interaction with F-actin. (A) Amino acid sequence of F-tractin variants. Amino acids colored in light grey were not observed in the cryo-EM reconstruction. Amino acids colored in blue and red correspond to positively and negatively charged residues, respectively. (B) Cryo-EM micrographs of F-actin mixed with 100 µM of WT F-tractin or F-tractinopt. (C) Actin bundling assay using low-speed centrifugation of F-actin in the presence of WT F-tractin, F-tractinopt, or Lifeact. Representative SDS-PAGE from three independent experiments are shown. (D) The level of actin bundling was quantified by densitometry and plotted against peptide concentrations. (E) Structures of WT F-tractin and F-tractinopt fitted into their cryo-EM densities. (F) Cosedimentation of F-actin and 2 μM of F-tractin-mCherry with supernatant (s), and pellet (p) fractions analyzed by SDS-PAGE. The upper band corresponds to actin and the lower band corresponds to F-tractinopt–mCherry. Representative stain-free gels are shown. (G) The fractions of F-tractinopt–mCherry that cosedimented with F-actin were quantified by densitometry and plotted against actin concentrations. Error bars in D and G correspond to standard deviations of three independent experiments. Source data are available for this figure: SourceData F2.CC BY · PubMed Central
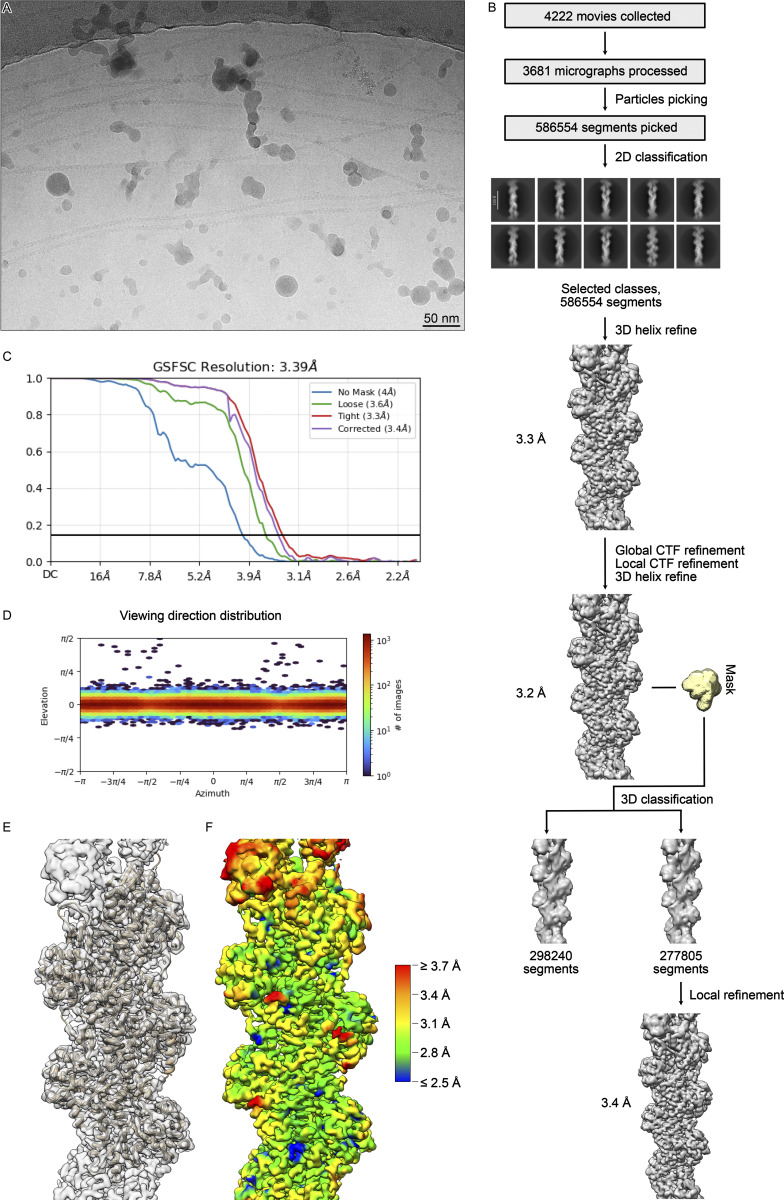
Figure S2. Processing of the F-tractin opt –F-actin complex. (A) An example of the 3,681 analyzed cryo-EM micrographs. (B) Processing overview. (C) Fourier shell correlation curve of the final reconstruction. (D) Angular distribution. (E) Fit of the molecular model into the cryo-EM density. (F) Local resolution gradient of the reconstruction calculated at the FSC threshold of 0.143.
Figure S2. Processing of the F-tractin opt –F-actin complex. (A) An example of the 3,681 analyzed cryo-EM micrographs. (B) Processing overview. (C) Fourier shell correlation curve of the final reconstruction. (D) Angular distribution. (E) Fit of the molecular model into the cryo-EM density. (F) Local resolution gradient of the reconstruction calculated at the FSC threshold of 0.143.CC BY · PubMed Central
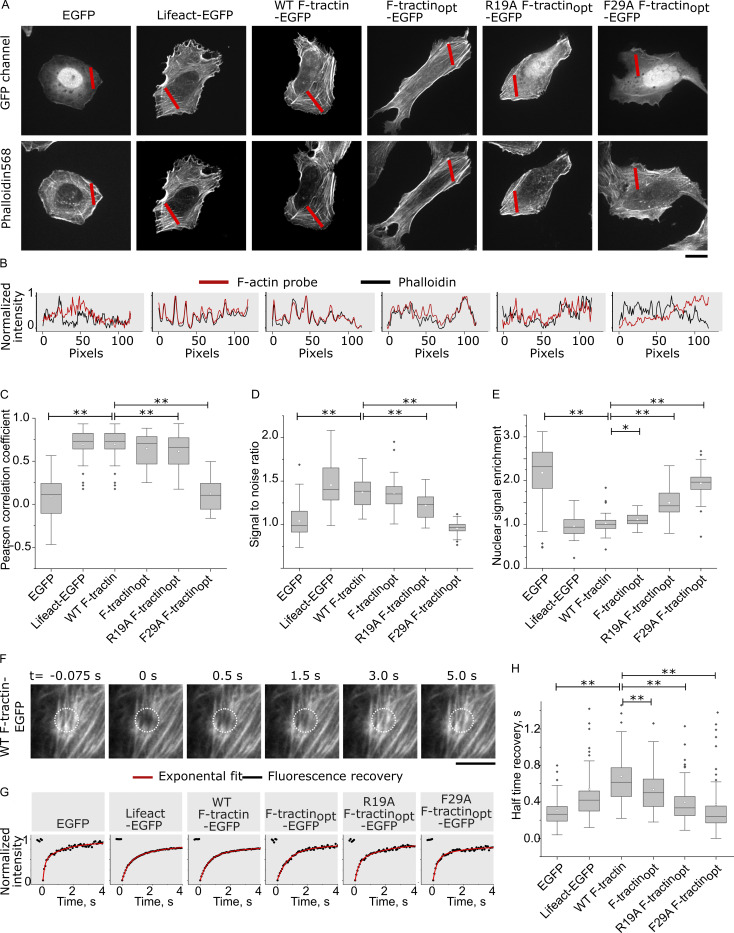
Figure 3. Actin labeling efficiency and exchange rate of F-tractin variants in U-2 OS cells. (A) Representative images of F-tractin-EGFP (GFP channel) and phalloidin. Scale bar: 20 μm. (B) Line scans of F-tractin variants (red lines) compared with respective phalloidin staining (black lines). (C) Boxplots of Pearson correlation coefficients between F-tractin variants and phalloidin staining. Two-sided t test P ≤ 0.01: ** (N = 3 experiments, n > 18 cells). The whiskers extend to 1.5× the interquartile range beyond the first and third quartiles of the data. (D) Boxplots of signal-to-noise ratio (fibers/cytosol) for F-tractin variants. t test P ≤ 0.01: ** (N = 3 experiments, n > 27 cells). (E) Boxplots of nuclear enrichment for F-tractin variants. Two-sided t test P ≤ 0.01: **, 0.01 < P ≤ 0.05: * (N = 3 experiments, n > 27 cells). (F) Time frames of a FRAP experiment in U2-OS cells expressing F-tractin-EGFP. Scale bar: 5 μm. (G) Recovery profiles for F-actin variants (black) with exponential fits (red). (H) Boxplots of FRAP recovery half times for indicated F-tractin variants, free EGFP, and Lifeact. Two-sided t test P ≤ 0.01: **. (N = 3 experiments, n > 25 cells).
Figure 3. Actin labeling efficiency and exchange rate of F-tractin variants in U-2 OS cells. (A) Representative images of F-tractin-EGFP (GFP channel) and phalloidin. Scale bar: 20 μm. (B) Line scans of F-tractin variants (red lines) compared with respective phalloidin staining (black lines). (C) Boxplots of Pearson correlation coefficients between F-tractin variants and phalloidin staining. Two-sided t test P ≤ 0.01: ** (N = 3 experiments, n > 18 cells). The whiskers extend to 1.5× the interquartile range beyond the first and third quartiles of the data. (D) Boxplots of signal-to-noise ratio (fibers/cytosol) for F-tractin variants. t test P ≤ 0.01: ** (N = 3 experiments, n > 27 cells). (E) Boxplots of nuclear enrichment for F-tractin variants. Two-sided t test P ≤ 0.01: **, 0.01 < P ≤ 0.05: * (N = 3 experiments, n > 27 cells). (F) Time frames of a FRAP experiment in U2-OS cells expressing F-tractin-EGFP. Scale bar: 5 μm. (G) Recovery profiles for F-actin variants (black) with exponential fits (red). (H) Boxplots of FRAP recovery half times for indicated F-tractin variants, free EGFP, and Lifeact. Two-sided t test P ≤ 0.01: **. (N = 3 experiments, n > 25 cells).CC BY · PubMed Central
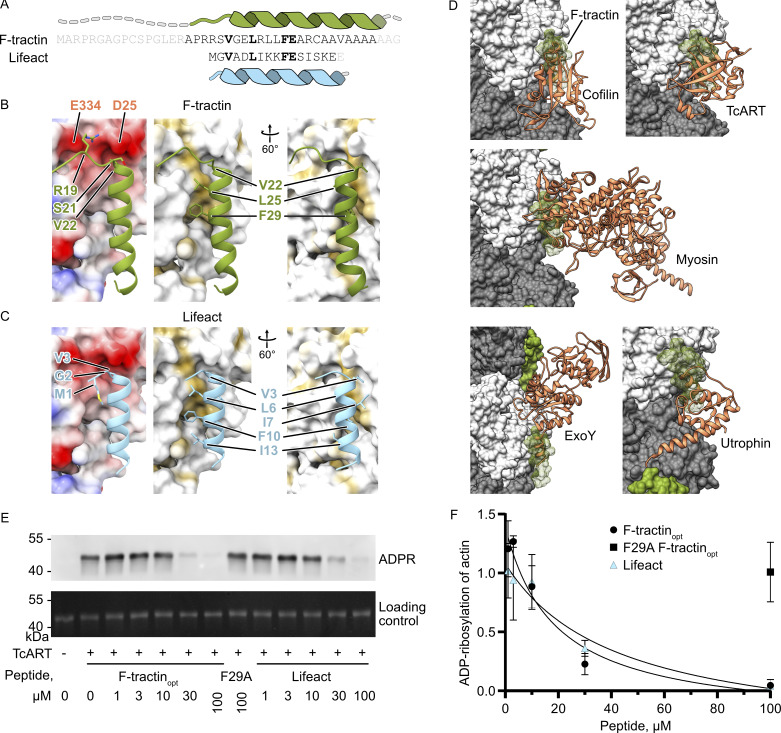
Figure 4. F-tractin and Lifeact share an interaction interface. (A) Comparison of amino acid sequence and secondary structure elements of F-tractin and Lifeact. (B and C) Comparison of electrostatic (left) and hydrophobic (middle/right) interactions of F-tractin and Lifeact (PDB 7AD9 [Belyy et al., 2020]). (D) Structures of cofilin (5YU8 [Tanaka et al., 2018]), myosin (5JLH [Oosterheert et al., 2022]), TcART (7Z7H [Belyy et al., 2022]), ExoY (7P1G [Belyy et al., 2021]), and utrophin (6M5G [Kumari et al., 2020]) bound to F-actin (grey and white). Note that all proteins overlap the F-actin interaction site of F-tractin (green). (E) Levels of actin ADP-ribosylation by TcART in the presence of F-tractinopt and Lifeact analyzed by western blot of a His-tagged ADP-ribose binding protein. (F) Level of ADP-ribosylation of actin was quantified by densitometry and plotted against peptide concentrations. Error bars in F correspond to the standard deviations of three independent experiments. Source data are available for this figure: SourceData F4.
Figure 4. F-tractin and Lifeact share an interaction interface. (A) Comparison of amino acid sequence and secondary structure elements of F-tractin and Lifeact. (B and C) Comparison of electrostatic (left) and hydrophobic (middle/right) interactions of F-tractin and Lifeact (PDB 7AD9 [Belyy et al., 2020]). (D) Structures of cofilin (5YU8 [Tanaka et al., 2018]), myosin (5JLH [Oosterheert et al., 2022]), TcART (7Z7H [Belyy et al., 2022]), ExoY (7P1G [Belyy et al., 2021]), and utrophin (6M5G [Kumari et al., 2020]) bound to F-actin (grey and white). Note that all proteins overlap the F-actin interaction site of F-tractin (green). (E) Levels of actin ADP-ribosylation by TcART in the presence of F-tractinopt and Lifeact analyzed by western blot of a His-tagged ADP-ribose binding protein. (F) Level of ADP-ribosylation of actin was quantified by densitometry and plotted against peptide concentrations. Error bars in F correspond to the standard deviations of three independent experiments. Source data are available for this figure: SourceData F4.CC BY · PubMed Central
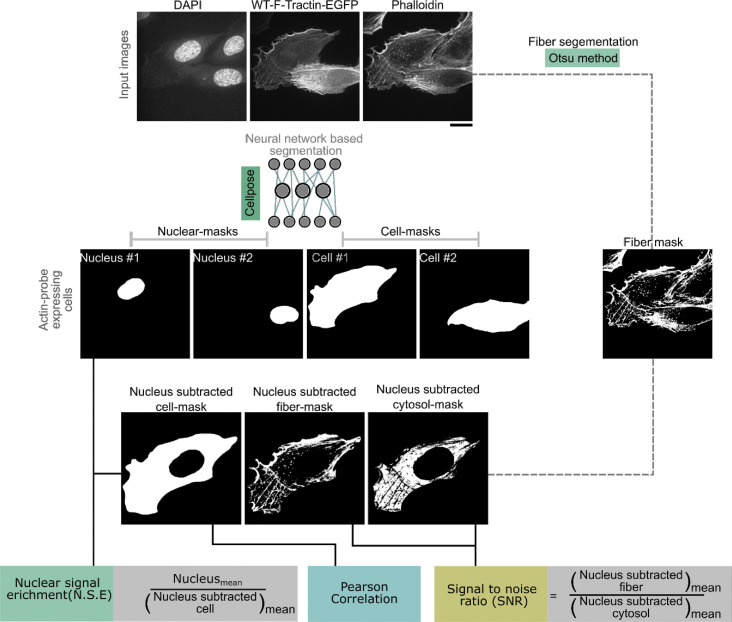
Figure S3. Image analysis workflow. Composite images were segmented using a combination of cellpose-based cell and nuclear segmentation and a custom Python pipeline incorporating background subtraction and Otsu’s thresholding for phalloidin channel fiber segmentation. Region-specific intensity measurements were performed for nuclear, fiber, cytosolic, and whole-cell. Pearson correlation coefficients were calculated to assess the relationship between actin markers and phalloidin fluorescence intensities, providing insights into colocalization patterns and enrichment trends.
Figure S3. Image analysis workflow. Composite images were segmented using a combination of cellpose-based cell and nuclear segmentation and a custom Python pipeline incorporating background subtraction and Otsu’s thresholding for phalloidin channel fiber segmentation. Region-specific intensity measurements were performed for nuclear, fiber, cytosolic, and whole-cell. Pearson correlation coefficients were calculated to assess the relationship between actin markers and phalloidin fluorescence intensities, providing insights into colocalization patterns and enrichment trends.CC BY · PubMed Central

Verification

Claims the paper makes

The claims and statistics of this paper haven’t been checked yet.

Run the check — free, no account needed. It reads the open-access text and checks the sources it cites.

A few free checks a day · papers already verified open instantly · results are public

Self-check

Percentages, sums and reported differences re-computed from the paper’s own numbers.

The self-check needs the paper’s full text.

Citations

Cites

Show all 55 references

Metadata

Authors
Shatskiy, D., Sivan, A., Wedlich-Söldner, R., & Belyy, A.
Affiliations
  • University of Groningen (NL)
  • University of Münster (DE)
  • Institute of Cell Dynamics and Imaging, and Cells-in-Motion Interfaculty Center (CiMIC), University of Münster 2 , Münster,
Corresponding author
  • Sivan, Athul
  • Belyy, Alexander
Venue
Journal of Cell Biology
Published
2025-02-10
Volume
224
Issue
4
ISSN
  • 0021-9525 (ISSN-L)
  • 1540-8140
OpenAlex
W4407349027
Cited by
9
References
55
Citations by year
2026: 6 · 2025: 3
FWCI
4.49
Type
journal article
Language
en
Open access
Locations
  • The Journal of Cell Biology (publishedVersion, other-oa)
  • bioRxiv (Cold Spring Harbor Laboratory) (acceptedVersion, cc-by-nc-nd)
  • PubMed Central (publishedVersion, cc-by)
  • PubMed (publishedVersion)
  • University of Groningen research database (University of Groningen / Centre for Information Technology) (submittedVersion, cc-by)
Funders
  • University of Groningen
  • German Research Foundation (SFB1009, SFB1348, SFB1557)
Topics
  • Life Sciences › Biochemistry, Genetics and Molecular Biology › Cell Biology › Cellular Mechanics and Interactions
  • Life Sciences › Biochemistry, Genetics and Molecular Biology › Molecular Biology › Protein Structure and Dynamics
  • Life Sciences › Biochemistry, Genetics and Molecular Biology › Cell Biology › Microtubule and mitosis dynamics
Keywords
F-actin, actin bundling, Lifeact, amphipathic helix, N-terminal flexibility, hydrophobic pocket, cryo-EM structure
MeSH terms
Actins, Animals, Binding Sites, Humans, Actin Cytoskeleton, Models, Molecular, Oligopeptides, Peptides, Protein Binding, Cryoelectron Microscopy

About these checks

Registry, retraction, Cites and statistics results are computed, not judged, with one exception: a printed reference that no index lists is read once by a model before it counts as a citation error. Claims are extracted by a model and kept only when their quote appears verbatim in the text; each cited source is then checked, with a model’s help, for whether it says what the claim relies on. Those verdicts can be wrong — read the claim’s quote and the cited source before relying on one.

Statistics and arithmetic are recomputed, not judged.

Confidence bands are shown only for fields calibrated on our annotated test set. None is calibrated yet, so no band is shown.

What counts as a claim ›How we measure confidence ›How we check this ›

Are you an author, or do you see a problem with this page? Request a review

How to cite

Cite CoChat for the checks on this page, and the paper for its own findings.

This page
CoChat. (2026). Citation check: Structure of the F-tractin–F-actin complex. https://app.cochat.ai/papers/10.1083/jcb.202409192
The paper
Shatskiy, D., Sivan, A., Wedlich-Söldner, R., & Belyy, A. (2025). Structure of the F-tractin–F-actin complex. Journal of Cell Biology. https://doi.org/10.1083/jcb.202409192

Data sources

Bibliographic data: Semantic Scholar, OpenAlex, Crossref.

Contains information from the Semantic Scholar Academic Graph Datasets, made available under the ODC Attribution License (ODC-BY 1.0).

Semantic Scholar’s data is described in: Kinney, R., et al. (2023). The Semantic Scholar Open Data Platform. arXiv:2301.10140.