

The DOI matches its Crossref record; 33 of the 33 references it cites were found in a registry or an index.
Intrinsic and Extrinsic Control of Hemopoietic Stem Cell Numbers: Mapping of a Stem Cell Gene
Open accessAbstract
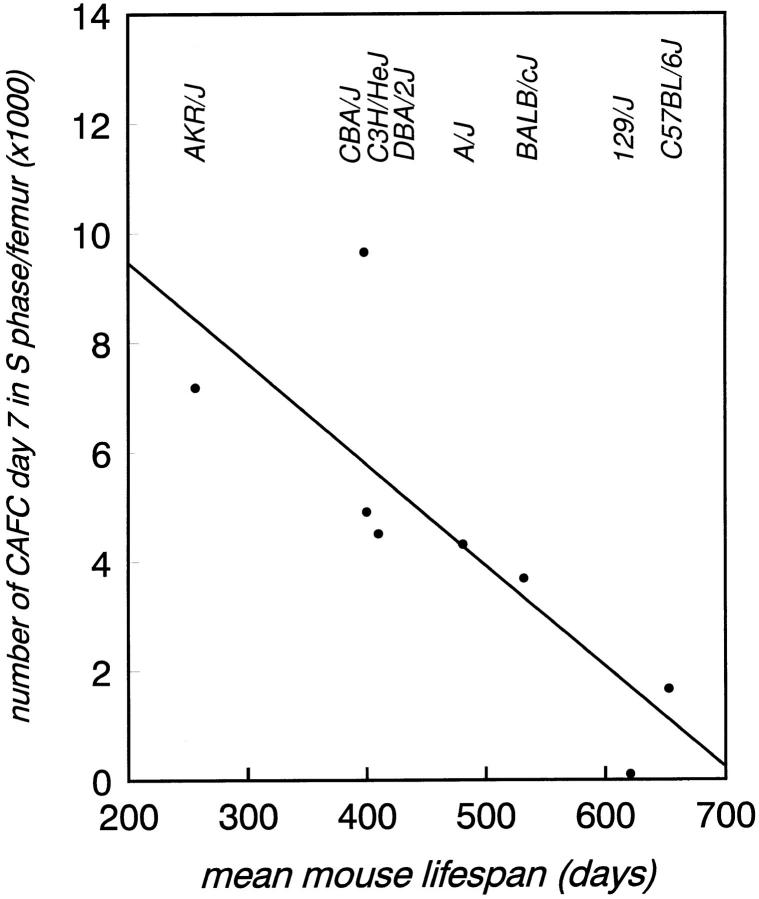
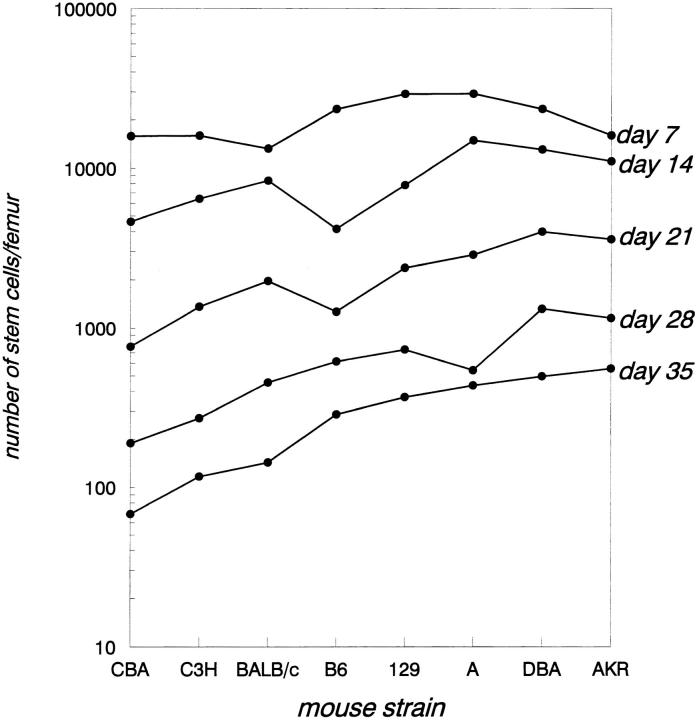
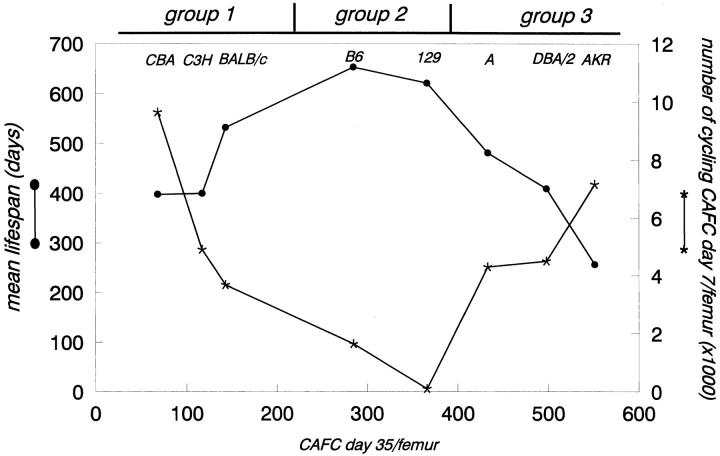
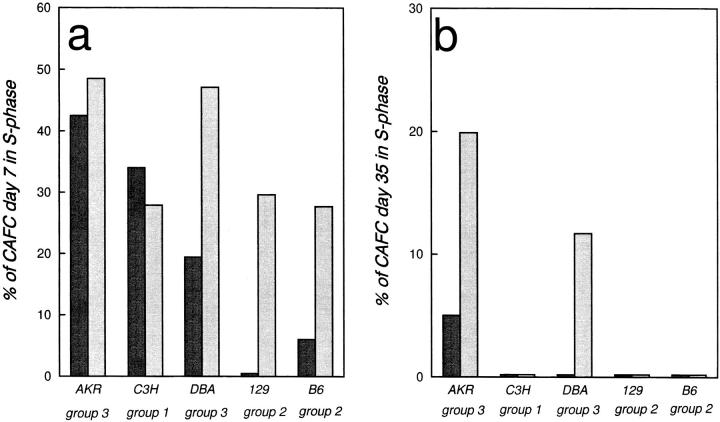
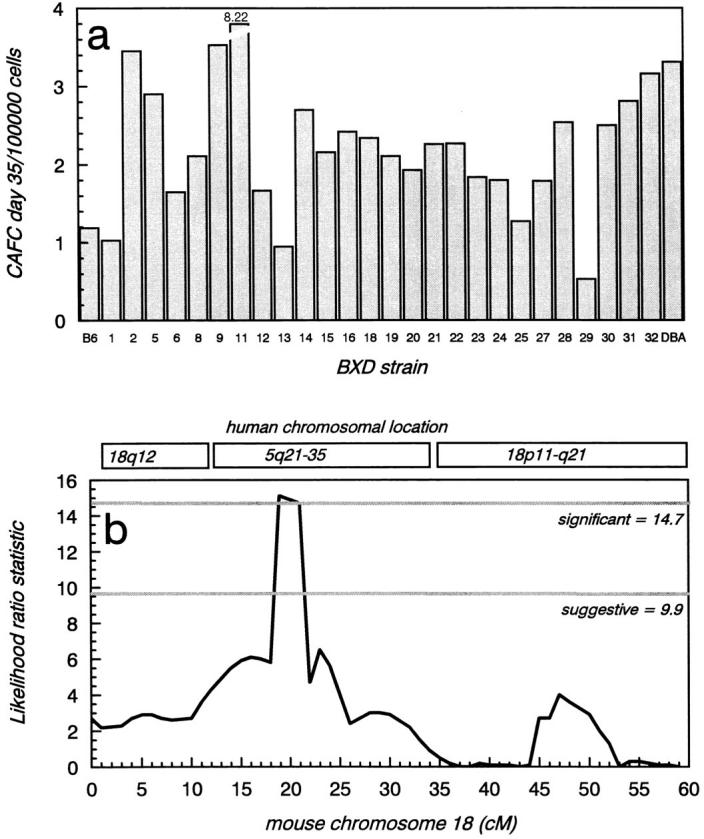
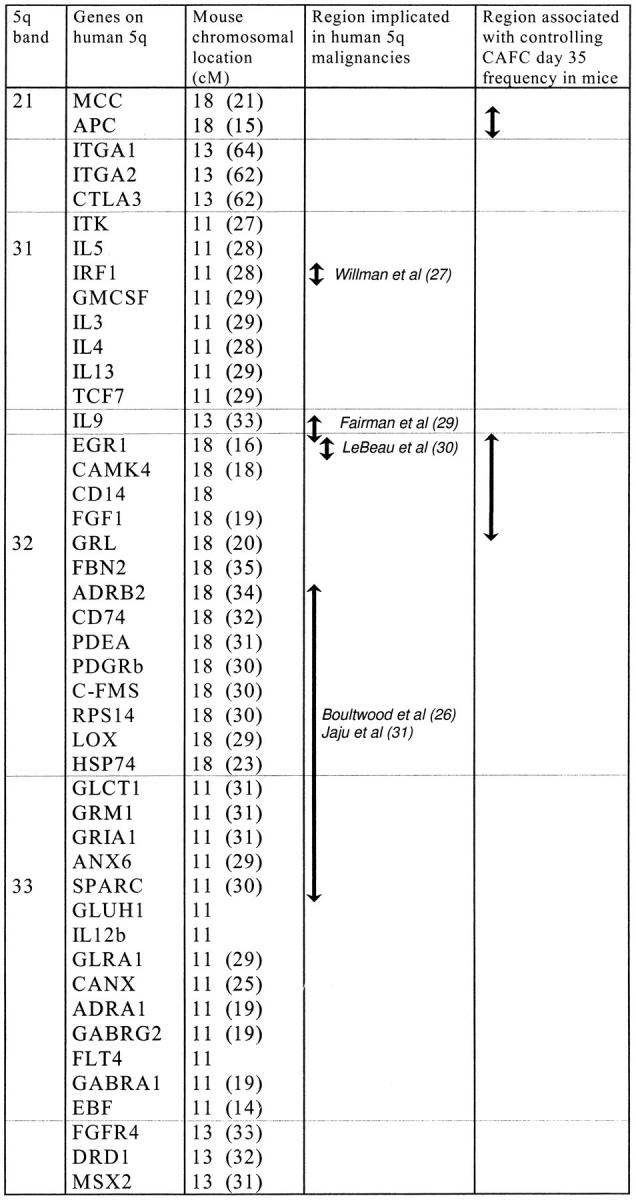
We evaluated in vivo interactions between extrinsic (growth factor induced) and intrinsic (genetically determined) effectors of mouse primitive hemopoietic stem cell proliferation and numbers. Accordingly, stem cell frequency and cell cycle kinetics were assessed in eight strains of inbred mice using the cobblestone area-forming cell (CAFC) assay. A strong inverse correlation was observed between mouse lifespan and the number of autonomously cycling progenitors (CAFC day 7) in the femur. The population size of primitive stem cells (CAFC day 35) varied widely (up to sevenfold) among strains, unlike total CAFC day 7 numbers (cycling and quiescent), which were similar. Administration of the early acting cytokine flt-3 ligand to these strains resulted in activation of quiescent primitive stem cells exclusively in strains with high endogenous stem cell numbers (DBA and AKR), but was unrelated to strain-specific progenitor cell cycling. To map loci affecting stem cell frequency, we quantified stem cells in BXD recombinant inbred mice (offspring of C57BL/6 and DBA/2). The resulting strain distribution pattern showed high concordance with a marker that mapped to chromosome 18 (19 cM). Linkage with this genomic interval was associated with a likelihood of odds score of 3.3, surpassing the level required for significance. Interestingly, this segment, containing the EGR-1 gene, shows synteny with human chromosome 5q, a region strongly associated with various hematological malignancies. Our findings indicate that a gene mapping to this region is mutated in either C57BL/6 or DBA/2 (and possibly AKR) mice. These studies in apparently healthy mice may facilitate the identification of a gene implicated in human 5q-syndromes.
Overview
The claims and statistics of this paper haven’t been checked yet.
Run the check — free, no account needed. It reads the open-access text and checks the sources it cites.
Integrity signals
Registry
Cites
Statistics
Figures
Verification
Claims the paper makes
The claims and statistics of this paper haven’t been checked yet.
Run the check — free, no account needed. It reads the open-access text and checks the sources it cites.
Claims other papers make about this one
Each is checked against this paper’s own text: does it say what the citing paper says it does?
In the citing paper
“aging (also of the hematopoietic system) is at least qualitatively different in distinct strains of mice.”
From Aging of hematopoietic stem cells (2018) · cites this paper as [31]
Self-check
Percentages, sums and reported differences re-computed from the paper’s own numbers.
The self-check needs the paper’s full text.
Citations
Cites
Genetic dissection of complex traits: guidelines for interpreting and reporting linkage results
Lander, E. S., & Kruglyak, L. (1995) · Nature Genetics · doi:10.1038/ng1195-241 · Cited by 5,236 · cited 2×
“Statistical criteria for linkage (16) were established by performing a permutation test (1,000 permutations at 1-cM intervals) (17).”
Empirical threshold values for quantitative trait mapping.
Churchill, G. A., & Doerge, R. W. (1994) · Genetics · doi:10.1093/genetics/138.3.963 · Cited by 4,935
The aging of hematopoietic stem cells
Morrison, S. J., Wandycz, A. M., Akashi, K., Globerson, A., & Weissman, I. L. (1996) · Nature Medicine · doi:10.1038/nm0996-1011 · Cited by 853 · cited 1×
“Conversely, the stem cell pool in unmanipulated mice continuously expands during its lifetime, such that old mice have substantially more stem cells than young mice, although aging has no effect on circulating blood cell counts (2, 3).”
BackgroundBiology of the Laboratory Mouse
(1941) · JAMA · doi:10.1001/jama.1941.02820440081034 · Cited by 805
Mackarehtschian, K., Hardin, J. D., Moore, K., Boast, S., Goff, S. P., & Lemischka, I. R. (1995) · Immunity · doi:10.1016/1074-7613(95)90167-1 · Cited by 575 · cited 1×
“A wealth of in vitro data has shown that FL has potent effects on primitive stem cell proliferation (8–11), and in vivo flk-2/flt-3 knockout mice show stem cell defects, especially affecting lymphopoiesis (12).”
A Macintosh program for storage and analysis of experimental genetic mapping data
Manly, K. F. (1993) · Mammalian Genome · doi:10.1007/bf00357089 · Cited by 496
Deletion of IRF-1 , Mapping to Chromosome 5q31.1, in Human Leukemia and Preleukemic Myelodysplasia
Willman, C. L., Sever, C. E., Pallavicini, M. G., Harada, H., Tanaka, N., Slovak, M. L., Yamamoto, H., Harada, K., Meeker, T. C., List, A. F., et al. (1993) · Science · doi:10.1126/science.8438156 · Cited by 380 · cited 1×
“(27) to be deleted in some 5q-samples, maps to mouse chromosome 11.”
Human/Mouse Homology Relationships
DeBry, R. W., & Seldin, M. F. (1996) · Genomics · doi:10.1006/geno.1996.0209 · Cited by 367
de Haan, G., NIJHOF, W., & Zant, G. E. V. (1997) · Blood · doi:10.1182/blood.v89.5.1543 · Cited by 300
Ploemacher, R., der Sluijs, J. V., van Beurden, C., Baert, M., & Chan, P. (1991) · Blood · doi:10.1182/blood.v78.10.2527.2527 · Cited by 261 · cited 2×
“CAFC day 7, a population of cells which has been shown to consist primarily of multipotent progenitors (18–20), showed a substantial HU kill, whereas primitive CAFC day 35, which contain cells with long-term repopulating ability (18, 20), were not killed by a 1-h incubation with HU, demonstrating their proliferative q…”
Cited by
Sorted by citations
Weissman, I. L. (2000) · Cell · doi:10.1016/s0092-8674(00)81692-x · Cited by 1,827
In vivo proliferation and cell cycle kinetics of long-term self-renewing hematopoietic stem cells
Cheshier, S. H., Morrison, S. J., Liao, X., & Weissman, I. L. (1999) · Proceedings of the National Academy of Sciences · doi:10.1073/pnas.96.6.3120 · Cited by 858
Rufer, N., Brümmendorf, T. H., Kolvraa, S., Bischoff, C., Christensen, K., Wadsworth, L., Schulzer, M., & Lansdorp, P. M. (1999) · The Journal of Experimental Medicine · doi:10.1084/jem.190.2.157 · Cited by 709
“Interestingly, in mice the genetically controlled fraction of actively cycling hematopoietic progenitor cells correlates significantly with the life span of the animal (38), whereas the overall telomere length clearly does not (32).”
BackgroundPassegue, E. A., Jamieson, C. H. M., Ailles, L., & Weissman, I. L. (2003) · Proceedings of the National Academy of Sciences · doi:10.1073/pnas.2034201100 · Cited by 712
Aging of hematopoietic stem cells
de Haan, G., & Lazare, S. S. (2018) · Blood · doi:10.1182/blood-2017-06-746412 · Cited by 432
Bystrykh, L. V., Weersing, E., Dontje, B., Sutton, S., Pletcher, M. T., Wiltshire, T., Su, A. I., Vellenga, E., Wang, J., Manly, K. F., et al. (2005) · Nature Genetics · doi:10.1038/ng1497 · Cited by 390
“In previous studies, we used a genetic approach to identify loci associated with variation in attributes of HSC population”
MethodCho, R. H., Sieburg, H. B., & Muller-Sieburg, C. E. (2008) · Blood · doi:10.1182/blood-2007-11-123547 · Cited by 377
The polycomb group gene Ezh2 prevents hematopoietic stem cell exhaustion
Kamminga, L. M., Bystrykh, L. V., de Boer, A., Houwer, S., Douma, J., Weersing, E., Dontje, B., & de Haan, G. (2006) · Blood · doi:10.1182/blood-2005-09-3585 · Cited by 376
T cells and aging january 2002 update
Pawelec, G. (2002) · Frontiers in bioscience · doi:10.2741/a831 · Cited by 372
Pawelec, G. (1998) · Frontiers in bioscience · doi:10.2741/a266 · Cited by 357
Shizuru, J. A., Negrin, R. S., & Weissman, I. L. (2002) · Annual Review of Medicine · doi:10.1146/annurev.med.54.101601.152334 · Cited by 349
The Role of Apoptosis in the Regulation of Hematopoietic Stem Cells
Domen, J., Cheshier, S. H., & Weissman, I. L. (2000) · The Journal of Experimental Medicine · doi:10.1084/jem.191.2.253 · Cited by 332
The aging of lympho-hematopoietic stem cells
Geiger, H., & Van Zant, G. (2002) · Nature Immunology · doi:10.1038/ni0402-329 · Cited by 233
“When the fraction of hematopoietic progenitor cells killed by hydroxyurea in eight commonly used, but unrelated, inbred mouse strains was measured, the fraction of surviving progenitors positively correlated with the mean lifespan of the mouse strai”
BackgroundDynamic Changes in Mouse Hematopoietic Stem Cell Numbers During Aging
de Haan, G., & Van Zant, G. (1999) · Blood · doi:10.1182/blood.v93.10.3294.410k07_3294_3301 · Cited by 208
The role of stem cells in aging
Zant, G. E. V., & Liang, Y. (2003) · Experimental Hematology · doi:10.1016/s0301-472x(03)00088-2 · Cited by 197
“Secondly, it has become clear in recent years that there is not only considerable mouse strain variation in longevity, but in properties of the stem cell compartment [101, 102].”
BackgroundSelf-renewal, differentiation or death: regulation and manipulation of hematopoietic stem cell fate
Domen, J., & Weissman, I. L. (1999) · Molecular Medicine Today · doi:10.1016/s1357-4310(99)01464-1 · Cited by 192
Yoshida, T., Hazan, I., Zhang, J., Ng, S. Y., Naito, T., Snippert, H. J. G., Heller, E. J., Qi, X., Lawton, L. N., Williams, C. J., et al. (2008) · Genes & Development · doi:10.1101/gad.1642808 · Cited by 184
de Guzman, C. G., Warren, A. J., Zhang, Z., Gartland, L., Erickson, P., Drabkin, H. A., Hiebert, S. W., & Klug, C. A. (2002) · Molecular and Cellular Biology · doi:10.1128/mcb.22.15.5506-5517.2002 · Cited by 173
“The expansion of AML1-ETO-expressing HSC no longer seemed to be restricted by the normal genetic control of HSC pool size (8, 25) but was exhaustible, based on serial transplantation experiments.”
BackgroundInfluentialT cells and aging (update February 1999)
Pawelec, G. (1999) · Frontiers in bioscience · doi:10.2741/pawelec · Cited by 140
“A strong inverse correlation was observed between mouse lifespan and the number of autonomously cycling progenitors in 8 different strains of mice; a gene controlling this frequency was mapped to mouse chromosome 18 (syntenic to human chromosome 5, involved in various haematological malignancies) (69).”
Genetic regulation of primitive hematopoietic stem cell senescence
Chen, J., Astle, C. M., & Harrison, D. E. (2000) · Experimental Hematology · doi:10.1016/s0301-472x(99)00157-5 · Cited by 131
“Other analyses using RI mice have suggested genetic loci that may regulate frequencies of stem cells assayed in vitro [18,19,31,42].”
BackgroundMethodStem cells and aging in the hematopoietic system
Warren, L. A., & Rossi, D. J. (2009) · Mechanisms of Ageing and Development · doi:10.1016/j.mad.2008.03.010 · Cited by 128
A Limited Role for p21Cip1/Waf1 in Maintaining Normal Hematopoietic Stem Cell Functioning
van Os, R. P., Kamminga, L. M., Ausema, A., Bystrykh, L. V., Draijer, D. P., van Pelt, K., Dontje, B., & de Haan, G. (2006) · Stem Cells · doi:10.1634/stemcells.2006-0631 · Cited by 124
Chen, J., Astle, C. M., & Harrison, D. E. (2003) · Experimental Hematology · doi:10.1016/s0301-472x(03)00238-8 · Cited by 106
“In recent years, loci that regulate different aspects of HSC function, including senescence, have been mapped to different chromosomal regions [8,10, 14–16].”
BackgroundA Genetic Determinant That Specifically Regulates the Frequency of Hematopoietic Stem Cells
Morrison, S. J., Qian, D., Jerabek, L., Thiel, B., Park, I.-K., Ford, P. S., Kiel, M. J., Schork, N. J., Weissman, I. L., & Clarke, M. F. (2002) · The Journal of Immunology · doi:10.4049/jimmunol.168.2.635 · Cited by 105
“de Haan and Van Zant (9) looked for linkages between day 35 CAFC frequency and genetic markers in recombinant inbred strains of C57BL/6 and DBA/2.”
BackgroundMethodInfluentialAge- and stage-specific regulation patterns in the hematopoietic stem cell hierarchy
Geiger, H., True, J. M., de Haan, G., & Zant, G. E. V. (2001) · Blood · doi:10.1182/blood.v98.10.2966 · Cited by 103
Gerrits, A., Walasek, M. A., Olthof, S. G. M., Weersing, E., Ritsema, M., Zwart, E., van Os, R. P., Bystrykh, L. V., & de Haan, G. (2011) · Blood · doi:10.1182/blood-2011-01-331686 · Cited by 101
Stem cells, aging, and cancer: inevitabilities and outcomes
Bell, D. R., & Zant, G. E. V. (2004) · Oncogene · doi:10.1038/sj.onc.1207949 · Cited by 99
Liang, Y., Jansen, M., Aronow, B. J., Geiger, H., & Zant, G. E. V. (2007) · Nature Genetics · doi:10.1038/ng1938 · Cited by 97
“LOC381240 19 (6) 19395 // 381240 Guanyl-nucleotide”
Optimal protocol for total body irradiation for allogeneic bone marrow transplantation in mice
Cui, Y., Hisha, H., Yang, G.-X., Fan, T.-X., Jin, T., Li, Q., Lian, Z., & Ikehara, S. (2002) · Bone Marrow Transplantation · doi:10.1038/sj.bmt.1703766 · Cited by 95
Hematopoietic Stem Cell Aging: Wrinkles In Stem Cell Potential
Chambers, S. M., & Goodell, M. A. (2007) · Stem Cell Reviews and Reports · doi:10.1007/s12015-007-0027-1 · Cited by 92
“that together regulate longevity and HSC proliferative capacity researchers took advantage of a collection of recombinant inbred mice from a cross of B6 and DBA mouse strains (BXD) to perform linkage analysis to narrow down the number of candidate genes [35, 36].”
A pilot study of subcutaneous decitabine in β-thalassemia intermedia
Olivieri, N. F., Saunthararajah, Y., Thayalasuthan, V., Kwiatkowski, J. L., Ware, R. E., Kuypers, F. A., Kim, H.-Y., Trachtenberg, F. L., & Vichinsky, E. P. (2011) · Blood · doi:10.1182/blood-2011-03-341909 · Cited by 91
An X chromosome gene regulates hematopoietic stem cell kinetics
Abkowitz, J. L., Taboada, M. R., Shelton, G. H., Catlin, S. N., Guttorp, P. M., & Kiklevich, J. V. (1998) · Proceedings of the National Academy of Sciences · doi:10.1073/pnas.95.7.3862 · Cited by 90
de Haan, G., & van Zant, G. (1999) · The FASEB Journal · doi:10.1096/fasebj.13.6.707 · Cited by 87
“activity that is inversely correlated with organismal life span (5, 6).”
BackgroundInfluentialUnbalanced X‐chromosome inactivation in haemopoietic cells from normal women
Tonon, L., Bergamaschi, G., Dellavecchia, C., Rosti, V., Lucotti, C., Malabarba, L., Novella, A., Vercesi, E., Frassoni, F., & Cazzola, M. (1998) · British Journal of Haematology · doi:10.1046/j.1365-2141.1998.00867.x · Cited by 86
“In addition, recent work with mice suggests that the number of stem cells actually increase with age, although stem cells from old mice have a lower cycling activity (de Haan et al, 1997; de Haan & van Zant, 1997).”
BackgroundRehn, M., Olsson, A., Reckzeh, K., Diffner, E., Carmeliet, P., Landberg, G., & Cammenga, J. (2011) · Blood · doi:10.1182/blood-2011-01-332890 · Cited by 88
Langer, J., Henckaerts, E., Orenstein, J., & Snoeck, H. (2004) · The Journal of Experimental Medicine · doi:10.1084/jem.20030980 · Cited by 73
“LSK cells from C57BL/6, DBA/2, and BALB/c mice, three mouse strains that display genetically determined variation in the HSC compartment (5, 6 ), were used for these experiments.”
Methodde Haan, G., Bystrykh, L. V., Weersing, E., Dontje, B., Geiger, H., Ivanova, N. B., Lemischka, I. R., Vellenga, E., & Zant, G. E. V. (2002) · Blood · doi:10.1182/blood-2002-03-0808 · Cited by 69
Quantitative trait loci regulating relative lymphocyte proportions in mouse peripheral blood
Chen, J., & Harrison, D. E. (2002) · Blood · doi:10.1182/blood.v99.2.561 · Cited by 66
Latchney, S. E., & Calvi, L. M. (2016) · Seminars in Hematology · doi:10.1053/j.seminhematol.2016.10.001 · Cited by 70
Yeoh, J. S. G., van Os, R. P., Weersing, E., Ausema, A., Dontje, B., Vellenga, E., & de Haan, G. (2006) · Stem Cells · doi:10.1634/stemcells.2005-0439 · Cited by 68
Does functional depletion of stem cells drive aging?
Schlessinger, D., & Zant, G. E. V. (2001) · Mechanisms of Ageing and Development · doi:10.1016/s0047-6374(01)00299-8 · Cited by 62
Regulation of hematopoietic stem cell aging in vivo by a distinct genetic element
Geiger, H., Rennebeck, G., & Zant, G. E. V. (2005) · Proceedings of the National Academy of Sciences · doi:10.1073/pnas.0408654102 · Cited by 61
Mechanisms Controlling Anaemia in Trypanosoma congolense Infected Mice
Noyes, H. A., Alimohammadian, M. H., Agaba, M. K., Brass, A., Fuchs, H., Gailus‐Durner, V., Hulme, H., Iraqi, F. A., Kemp, S. J., Rathkolb, B., et al. (2009) · PLoS ONE · doi:10.1371/journal.pone.0005170 · Cited by 61
“had not returned to baseline levels by day 17, consistent with suppressed haematopoiesis in C57BL/6 mice in later stages. It is interesting to note that the more severe chronic anaemia of C57BL/6 mice also correlates with the lower number of Cobblestone Area Forming Cells that are in S phase in the femur of 7 day old…”
BackgroundWaterstrat, A., Liang, Y., Swiderski, C. F., Shelton, B. J., & Zant, G. E. V. (2009) · Blood · doi:10.1182/blood-2008-03-143370 · Cited by 59
Senescence and functional failure in hematopoietic stem cells
Chen, J. (2004) · Experimental Hematology · doi:10.1016/j.exphem.2004.08.001 · Cited by 53
“found that aging has a major impact on the frequency and cell-cycle kinetics of primitive hematopoietic cell compartments, and that there was a significant negative correlation between maximal lifespan and hematopoietic cell proliferative activity in young mice [33,34].”
BackgroundThe kinetics of clonal dominance in myeloproliferative disorders
Catlin, S. N., Guttorp, P. M., & Abkowitz, J. L. (2005) · Blood · doi:10.1182/blood-2005-03-1240 · Cited by 54
de Haan, G., Ausema, A., Wilkens, M., Molineux, G., & Dontje, B. (2000) · British Journal of Haematology · doi:10.1046/j.1365-2141.2000.02252.x · Cited by 53
Henckaerts, E., Langer, J., & Snoeck, H. (2004) · Blood · doi:10.1182/blood-2003-12-4304 · Cited by 52
de Haan, G., Szilvassy, S. J., Meyerrose, T. E., Dontje, B., Grimes, B. A., & Zant, G. E. V. (2000) · Blood · doi:10.1182/blood.v96.4.1374 · Cited by 52
Stevens, C. E., Gladstone, J., Taylor, P. E., Scaradavou, A., Migliaccio, A. R., Visser, J. W. M., Dobrila, N. L., Carrier, C., Cabbad, M., Wernet, P., et al. (2002) · Blood · doi:10.1182/blood.v100.7.2662 · Cited by 50
A putative gene causes variability in lifespan among genotypically identical mice
de Haan, G., Gelman, R. S., Watson, A., Yunis, E. J., & Zant, G. E. V. (1998) · Nature Genetics · doi:10.1038/465 · Cited by 50
Maiuthed, A., Bhummaphan, N., Luanpitpong, S., Mutirangura, A., Aporntewan, C., Meeprasert, A., Rungrotmongkol, T., Rojanasakul, Y., & Pithi Chanvorachote, B. (2018) · Journal of Biological Chemistry · doi:10.1074/jbc.ra117.000287 · Cited by 44
“Various intrinsic and extrinsic stimuli and their cross-talk were documented as the important factors controlling the stemness of cancer cells (57, 58).”
BackgroundThe role of apoptosis in regulating hematopoietic stem cell numbers
Domen, J. (2001) · APOPTOSIS · doi:10.1023/a:1011347623402 · Cited by 44
Henckaerts, E., Geiger, H., Langer, J., Rebollo, P., Zant, G. E. V., & Snoeck, H. (2002) · Blood · doi:10.1182/blood.v99.11.3947 · Cited by 42
“In this study, we have identified 2 significant traits involving the hematopoietic stem and progenitor cell compartment that show quantitative variation: (1) responsiveness to early-acting hematopoietic cytokines and (2) absolute number of Lin Sca1 cells (both c-kit and c-kit subpopulations).”
Genetic control of hematopoietic stem cell frequency in mice is mostly cell autonomous
Müller‐Sieburg, C. E., Cho, R. H., Sieburg, H. B., Kupriyanov, S., & Riblet, R. J. (2000) · Blood · doi:10.1182/blood.v95.7.2446 · Cited by 41
Epigenetic Control of Hematopoietic Stem Cell Aging The Case of Ezh2
de Haan, G., & GERRITS, A. (2007) · Annals of the New York Academy of Sciences · doi:10.1196/annals.1392.008 · Cited by 42
Pten loss in the bone marrow leads to G-CSF–mediated HSC mobilization
Tesio, M., Oser, G., Baccelli, I., Blanco-Bose, W. E., Wu, H., Göthert, J. R., Kogan, S. C., & Trumpp, A. (2013) · The Journal of Experimental Medicine · doi:10.1084/jem.20122768 · Cited by 38
“K; Cross et al., 1995).”
Vazquez, S. E., Inlay, M. A., & Serwold, T. F. (2015) · Experimental Hematology · doi:10.1016/j.exphem.2015.04.001 · Cited by 37
Mobilization‐based transplantation of young‐donor hematopoietic stem cells extends lifespan in mice
Guderyon, M. J., Chen, C., Bhattacharjee, A., Ge, G., Fernandez, R. A., Gelfond, J., Gorena, K. M., Cheng, C. J. A., Li, Y., Nelson, J. F., et al. (2020) · Aging Cell · doi:10.1111/acel.13110 · Cited by 37
Hasegawa, M., Baldwin, T. M., Metcalf, D., & Foote, S. J. (2000) · Blood · doi:10.1182/blood.v95.5.1872.005k26_1872_1874 · Cited by 34
The Genetic Landscape of Hematopoietic Stem Cell Frequency in Mice
Zhou, X., Crow, A. L., Hartiala, J., Spindler, T. J., Ghazalpour, A., Barsky, L. W., Bennett, B. J., Parks, B. W., Eskin, E., Jain, R., et al. (2015) · Stem Cell Reports · doi:10.1016/j.stemcr.2015.05.008 · Cited by 29
Mouse Strain Determines Cardiac Growth Potential
Kiper, C., Grimes, B. A., van Zant, G. V., & Satin, J. (2013) · PLoS ONE · doi:10.1371/journal.pone.0070512 · Cited by 27
“DBA/2 mice had a greater number of primitive hematopoietic stem cells at a young age than C57BL/6 mice [22].”
BackgroundHenckaerts, E., Langer, J., Orenstein, J., & Snoeck, H. (2004) · The Journal of Immunology · doi:10.4049/jimmunol.173.4.2486 · Cited by 28
Genetic Control of Stem Cells: Implications for Aging
Zant, G. E. V. (2003) · International Journal of Hematology · doi:10.1007/bf02982600 · Cited by 28
“Studies in my laboratory [ 51 ,52,55] and by Morrison et al [54] in which a functional stem cell assay and a flow cytometric phenotype assay, respectively, were used showed that Stem Cell Genetics 33”
BackgroundMethodResultInfluentialZhou, T., Chen, P., Gu, J. H., Bishop, A. J. R., Scott, L., Hasty, P., & Rebel, V. I. (2015) · International Journal of Molecular Sciences · doi:10.3390/ijms16010966 · Cited by 26
“compared to young HSCs [5–13].”
Herbert, K. E., Walkley, C. R., Winkler, I. G., Hendy, J., Olsen, G. H., Yuan, Y.-D., Chandraratna, R. A. S., Prince, H. M., Lévesque, J.-P., & Purton, L. E. (2007) · Transplantation · doi:10.1097/01.tp.0000251376.75347.b4 · Cited by 26
“Genetic analyses have shown that the differing levels of CFU-GM mobilization between the C57BL/6J and BALB/c mice are linked to several discrete genetic loci within the genome of these inbred strains and is correlated with the size of their respective stem cell pools (41, 48, 49).”
BackgroundAutonomous behavior of hematopoietic stem cells
Kamminga, L. M., Akkerman, I., Weersing, E., Ausema, A., Dontje, B., Zant, G. E. V., & de Haan, G. (2000) · Experimental Hematology · doi:10.1016/s0301-472x(00)00543-9 · Cited by 26
The Cobblestone-Area-Forming Cell Assay
de Haan, G., & Ploemacher, R. (2003) · Humana Press eBooks · doi:10.1385/1-59259-140-x:143 · Cited by 23
Goebel, W. S., Yöder, M. C., Pech, N. K., & Dinauer, M. C. (2002) · Experimental Hematology · doi:10.1016/s0301-472x(02)00927-x · Cited by 23
“[17], who showed up to 20% donor chimerism in unconditioned BALB/c mice transplanted with 40 106 fresh marrow cells, we observed little donor chimerism in 100-cGy conditioned C57 hosts transplanted with up to 36 106 fresh marrow cells, which likely reflects strain-specific differences in sensitivity to radiation, as w…”
Primitive hematopoietic stem cell function in vivo is uniquely high in the CXB-12 mouse strain
Chen, J., Astle, C. M., Müller‐Sieburg, C. E., & Harrison, D. E. (2000) · Blood · doi:10.1182/blood.v96.13.4124 · Cited by 23
Isolation and Analysis of Hematopoietic Stem Cells from Mouse Embryos
Dzierzak, E. A., & Bruijn, M. F. T. R. D. (2003) · Humana Press eBooks · doi:10.1385/1-59259-140-x:001 · Cited by 22
A role for the Fas/Fas ligand apoptotic pathway in regulating myeloid progenitor cell kinetics
Alenzi, F. Q., Marley, S. B., Lewis, J. L., Chandrashekran, A., Warrens, A. Ν., Goldman, J. M., & Gordon, M. Y. (2002) · Experimental Hematology · doi:10.1016/s0301-472x(02)00957-8 · Cited by 21
“Mice are known to exhibit strain-related differences in hematopoietic progenitor cell numbers and kinetics [35–37] and it is possible that Fas-related effects may be more apparent against some genetic backgrounds than others.”
BackgroundRecent progress in identifying genes regulating hematopoietic stem cell function and fate
Jordan, C. T., & Zant, G. E. V. (1998) · Current Opinion in Cell Biology · doi:10.1016/s0955-0674(98)80112-9 · Cited by 21
Genetic Influences in Mouse Spermatogonial Stem Cell Self-Renewal
Kanatsu‐Shinohara, M., Ogonuki, N., Miki, H., Inoue, K., Morimoto, H., TAKASHIMA, S., Ogura, A., & Shinohara, T. (2010) · Journal of Reproduction and Development · doi:10.1262/jrd.09-153n · Cited by 20
“For example, studies in the hematopoietic system have revealed fundamental differences between the mechanisms that control the frequency of HSCs and those that regulate mature blood cell numbers [15].”
BackgroundResultInfluentialGenetic control of lifespan: studies from animal models
Zant, G. E. V., & de Haan, G. (1999) · Expert Reviews in Molecular Medicine · doi:10.1017/s1462399499001441 · Cited by 20
Stem cell traits in long-term co-culture revealed by time-lapse imaging
Song, Y., Bahnson, A. B., Hall, N. J., Yu, H., Shen, H., Koebler, D., Houck, R. K., Xie, Y., & Cheng, T. (2009) · Leukemia · doi:10.1038/leu.2009.191 · Cited by 19
“Rather, the appearance of CAs at different time points is correlated with the hierarchy of the hematopoietic cells as also indicated in previous studies by others (20).”
Aging Effects on Cardiac Progenitor Cell Physiology
Rota, M., Goichberg, P., Anversa, P., & Leri, A. (2015) · Comprehensive physiology · doi:10.1002/cphy.c140082 · Cited by 22
“The relationship between aging effects on hematopoietic stem cells (HSCs) and longevity in mice was shown more than 15 years ago: low HSC number and high hematopoietic cell turnover were found to correlate negatively with median lifespan in rodents (87).”
Gerrits, A., Dykstra, B. J., Otten, M., Bystrykh, L. V., & de Haan, G. (2008) · Immunogenetics · doi:10.1007/s00251-008-0305-3 · Cited by 18
“Genetical genomics”
Roberts, A. W., Hasegawa, M., Metcalf, D., & Foote, S. J. (2000) · Leukemia · doi:10.1038/sj.leu.2401735 · Cited by 16
Knaän‐Shanzer, S., Verlinden, S. F. F., van Beusechem, V. W., Bekkum, D. W. V., & Valerio, D. (1999) · Experimental Hematology · doi:10.1016/s0301-472x(99)00074-0 · Cited by 16
Terskikh, V. V., Vasil'ev, A. V., & Voroteliak, E. A. (2007) · PubMed · Cited by 15
Characterization of cytokine interactions by flow cytometry and factorial analysis
Case, J., Rice, A. M., Wood, J. A., Gaudry, L. E., Vowels, M. R., & Nordon, R. E. (2000) · Cytometry · doi:10.1002/1097-0320(20010101)43:1 · Cited by 14
Smith, A. L., Ellison, F. M., McCoy, J. P., & Chen, J. (2005) · The Journals of Gerontology Series A · doi:10.1093/gerona/60.4.448 · Cited by 14
“These strain differences were the groundwork for genetic analyses that defined several quantitative trait loci that regulate HSC senescence (4,8,9).”
BackgroundBrauner, P., Nibbelink, M. M., Flachs, P., Vítková, I., Kopecky, P., Mertelíková, I., Rossmeislová, L., Pénicaud, L., Casteilla, L., Plavka, R., et al. (2001) · Pediatric Research · doi:10.1203/00006450-200103000-00022 · Cited by 13
Herbert, K. E., Prince, H. M., Ritchie, D. S., & Seymour, J. F. (2009) · Expert Opinion on Biological Therapy · doi:10.1517/14712590903473123 · Cited by 13
“The underlying mechanism of poor mobilization in these individuals is unclear however mouse studies have demonstrated putative genes on chromosomes 2 and 11 that affect mobilization proficiency [38] and overall stem cell pool size [39-41].”
BackgroundAvagyan, S., Aguiló, F., Kamezaki, K., & Snoeck, H. (2011) · Blood · doi:10.1182/blood-2011-07-365080 · Cited by 12
Natural Genetic Diversity as a Means to Uncover Stem Cell Regulatory Pathways
Zant, G. E. V., & Liang, Y. (2009) · Annals of the New York Academy of Sciences · doi:10.1111/j.1749-6632.2009.04567.x · Cited by 12
Latexin is a newly discovered regulator of hematopoietic stem cells
de Haan, G. (2007) · Nature Genetics · doi:10.1038/ng0207-141 · Cited by 12
Herbert, K. E., Lévesque, J.-P., Haylock, D. N., & Prince, M. (2008) · Transplantation and Cellular Therapy · doi:10.1016/j.bbmt.2008.02.003 · Cited by 12
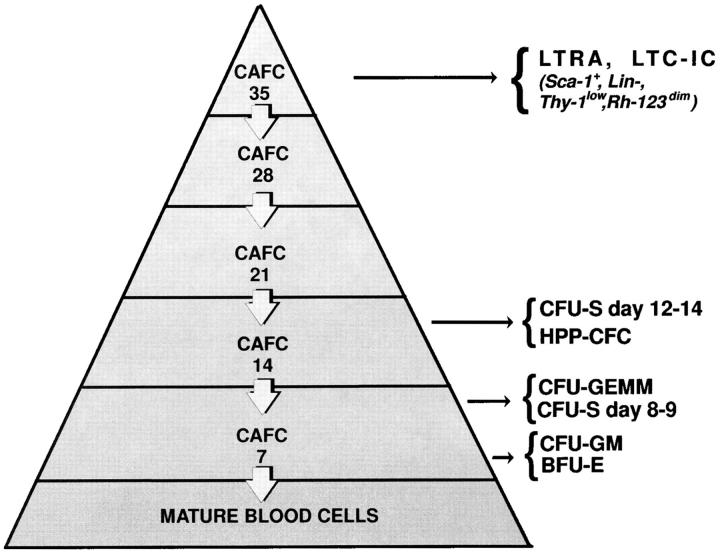
“The CAFC assay can be used as a limiting dilution assay for stem cells, and it has been shown that day 8 CAFC correlate with day 12 colony forming unit-spleen (CFU-S), whereas day 28 CAFC correlate with the more primitive pre-CFU-S [60].”
BackgroundInfluentialStem Cells and Genetics in the Study of Development, Aging, and Longevity
Zant, G. E. V. (2000) · Results and problems in cell differentiation · doi:10.1007/978-3-540-48003-7_11 · Cited by 12
Jawad, M., Cole, C., Zanker, A., Lo, P., Fitch, S. R., & Plumb, M. (2006) · International Journal of Radiation Biology · doi:10.1080/09553000600784161 · Cited by 10
Dangond, F., Foerznler, D., Weremowicz, S., Morton, C. C., Beier, D. R., & Gullans, S. R. (1999) · Molecular Cell Biology Research Communications · doi:10.1006/mcbr.1999.0156 · Cited by 9
Jawad, M., Giotopoulos, G., Fitch, S. R., Cole, C., Plumb, M., & Talbot, C. J. (2006) · Blood Cells Molecules and Diseases · doi:10.1016/j.bcmd.2006.10.009 · Cited by 9
“Similarly, QTL have been identified that determine mouse stem, progenitor and mature white blood cell numbers [10-18].”
BackgroundAvagyan, S., Glouchkova, L., Choi, J., & Snoeck, H. (2008) · The Journal of Immunology · doi:10.4049/jimmunol.181.9.5904 · Cited by 8
Andreeva, E. R., Andrianova, I. V., Gornostaeva, A. N., Gogiya, B. S., & Buravkova, L. B. (2018) · Cell and Tissue Research · doi:10.1007/s00441-017-2766-x · Cited by 8
Andreeva, E. R., Andrianova, I. V., Sotnezova, E. V., Gornostaeva, A. N., Khorkova, S., & Buravkova, L. B. (2018) · Journal of Bioscience and Bioengineering · doi:10.1016/j.jbiosc.2018.10.017 · Cited by 8
Yeoh, J. S. G., Ausema, A., Wierenga, P. K., de Haan, G., & van Os, R. P. (2007) · Bone Marrow Transplantation · doi:10.1038/sj.bmt.1705601 · Cited by 8
Terskikh, V. V., Vasiliev, A. V., & Vorotelyak, E. A. (2007) · Biology Bulletin · doi:10.1134/s1062359007030016 · Cited by 8
Mechanisms of Stem Cell Ageing
Waterstrat, A., Oakley, E. J., Miller, A. R., Swiderski, C. F., Liang, Y., & Zant, G. E. V. (2007) · Springer eBooks · doi:10.1007/978-3-540-73709-4_6 · Cited by 8
Polycomb group proteins in hematopoietic stem cell aging and malignancies
Klauke, K., & de Haan, G. (2011) · International Journal of Hematology · doi:10.1007/s12185-011-0857-0 · Cited by 8
“To uncover genes that are responsible for the differences in HSC frequency and turnover, gene expression profiling of recombinant inbred strains from DBA/2 and C57Bl/6 was conducted [87–90].”
Method
Metadata
- Authors
- Haan, G. D., & Zant, G. V.
- Affiliations
- University of Kentucky HealthCare (US)
- From the Blood and Marrow Transplant Program, Division of Hematology/Oncology, University of Kentucky Medical Center, Lexington, Kentucky 40536-0093
- ORCID
- Haan, Gerald de
- Venue
- The Journal of Experimental Medicine
- Publisher
- Rockefeller University Press
- Published
- 1997-08-18
- Volume
- 186
- Issue
- 4
- Pages
- 529-536
- ISSN
- 0022-1007 (ISSN-L)
- 1540-9538
- PMC
- PMC2199035
- OpenAlex
- W2115154817
- Cited by
- 134
- References
- 33
- Citations by year
- 2020: 2 · 2018: 4 · 2017: 1 · 2016: 2 · 2015: 6 · 2013: 3 · 2012: 3
- FWCI
- 5.39
- Type
- journal article
- Language
- en
- Open access
- bronze
- doi.org
- Locations
- The Journal of Experimental Medicine (publishedVersion)
- PubMed Central (publishedVersion, cc-by-nc-sa)
- PubMed (publishedVersion)
- UKnowledge (University of Kentucky) (submittedVersion, cc-by-nc-sa)
- Funders
- Nederlandse Organisatie voor Wetenschappelijk Onderzoek
- Topics
- Health Sciences › Medicine › Hematology › Hematopoietic Stem Cell Transplantation
- Health Sciences › Medicine › Hematology › Blood disorders and treatments
- Life Sciences › Biochemistry, Genetics and Molecular Biology › Cell Biology › Mesenchymal stem cell research
- Keywords
- hematopoietic stem cells, stem cell frequency, Flt3 ligand, stem cell quiescence, cell cycle kinetics, cobblestone area-forming cells, BXD recombinant inbred mice, linkage mapping, chromosome 18, EGR1, 5q- syndrome, mouse strain differences, mouse lifespan
- MeSH terms
- Animals, Cell Count, Cell Division, Chromosome Mapping, Female, Hematopoietic Stem Cells, Humans, Mice, Inbred Strains, Species Specificity, Mice
About these checks
Registry, retraction, Cites and statistics results are computed, not judged, with one exception: a printed reference that no index lists is read once by a model before it counts as a citation error. Claims are extracted by a model and kept only when their quote appears verbatim in the text; each cited source is then checked, with a model’s help, for whether it says what the claim relies on. Those verdicts can be wrong — read the claim’s quote and the cited source before relying on one.
Statistics and arithmetic are recomputed, not judged.
Confidence bands are shown only for fields calibrated on our annotated test set. None is calibrated yet, so no band is shown.
What counts as a claim ›How we measure confidence ›How we check this ›
Are you an author, or do you see a problem with this page? Request a review
