Cited by 193

The DOI matches its Crossref record.

Intestinal Mast Cell Progenitors Require CD49dβ7 (α4β7 Integrin) for Tissue-specific Homing

Gurish, Michael F., Tao, Hong, Abonia, J. Pablo, Arya, Anu, Friend, Daniel S., Parker, Christina M., Austen, K. Frank·2001·The Journal of Experimental Medicine

Abstract

Mast cells (MCs) are centrally important in allergic inflammation of the airways, as well as in the intestinal immune response to helminth infection. A single lineage of bone marrow (BM)-derived progenitors emigrates from the circulation and matures into phenotypically distinct MCs in different tissues. Because the mechanisms of MC progenitor (MCp) homing to peripheral tissues have not been evaluated, we used limiting dilution analysis to measure the concentration of MCp in various tissues of mice deficient for candidate homing molecules. MCp were almost completely absent in the small intestine but were present in the lung, spleen, BM, and large intestine of β7 integrin-deficient mice (on the C57BL/6 background), indicating that a β7 integrin is critical for homing of these cells to the small intestine. MCp concentrations were not altered in the tissues of mice deficient in the αE integrin (CD103), the β2 integrin (CD18), or the recombination activating gene (RAG)-2 gene either alone or in combination with the interleukin (IL)-receptor common γ chain. Therefore, it is the α4β7 integrin and not the αEβ7 integrin that is critical, and lymphocytes and natural killer cells play no role in directing MCp migration under basal conditions. When MCp in BALB/c mice were eliminated with sublethal doses of γ-radiation and then reconstituted with syngeneic BM, the administration of anti-α4β7 integrin, anti-α4 integrin, anti-β7 integrin, or anti–MAdCAM-1 monoclonal antibodies (mAbs) blocked the recovery of MCp in the small intestine. The blocking mAbs could be administered as late as 4 d after BM reconstitution with optimal inhibition, implying that the MCp must arise first in the BM, circulate in the vasculature, and then translocate into the intestine. Inasmuch as MCp are preserved in the lungs of β7 integrin-deficient and anti-α4β7 integrin-treated mice but not in the small intestine, α4β7 integrin is critical for tissue specific extravasation for localization of MCp in the small intestine, but not the lungs.

Overview

The claims and statistics of this paper haven’t been checked yet.

Run the check — free, no account needed. It reads the open-access text and checks the sources it cites.

A few free checks a day · papers already verified open instantly · results are public

Integrity signals

Registry

Crossref · 10.1084/jem.194.9.1243

Cites

Statistics

Figures

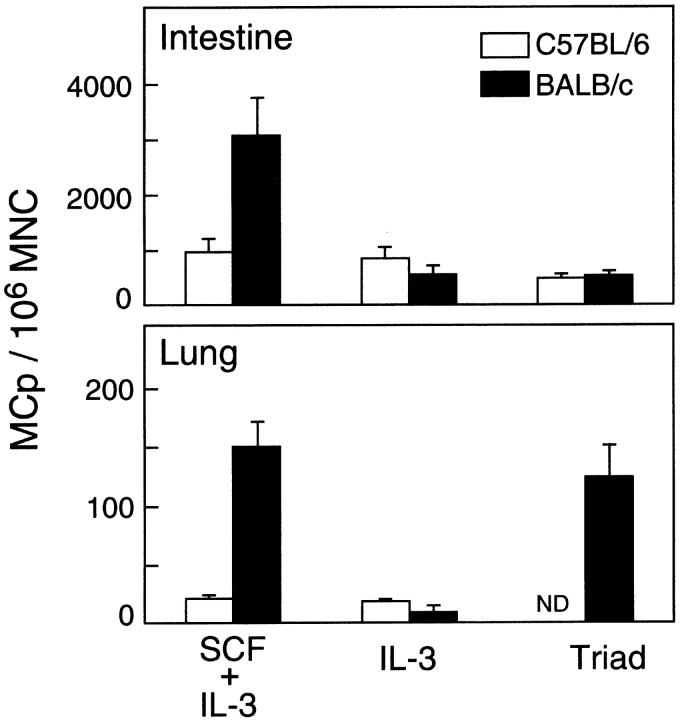
Figure 1. Concentrations of MCp in the small intestine and lung of C57BL/6 (white bars) and BALB/c (black bars) mice. MNCs were isolated from the intestine or the lung of normal C57BL/6J or BALB/c mice by enzymatic digestion. The MCp concentration is the number of MCp per 106 MNCs as determined by limiting dilution analysis with the cytokine combinations of SCF plus IL-3, IL-3 alone, or SCF plus IL-6 plus IL-10 (Triad). The values are the means ± SEM for five experiments. ND, not done.
Figure 1. Concentrations of MCp in the small intestine and lung of C57BL/6 (white bars) and BALB/c (black bars) mice. MNCs were isolated from the intestine or the lung of normal C57BL/6J or BALB/c mice by enzymatic digestion. The MCp concentration is the number of MCp per 106 MNCs as determined by limiting dilution analysis with the cytokine combinations of SCF plus IL-3, IL-3 alone, or SCF plus IL-6 plus IL-10 (Triad). The values are the means ± SEM for five experiments. ND, not done.CC BY-NC-SA · PubMed Central
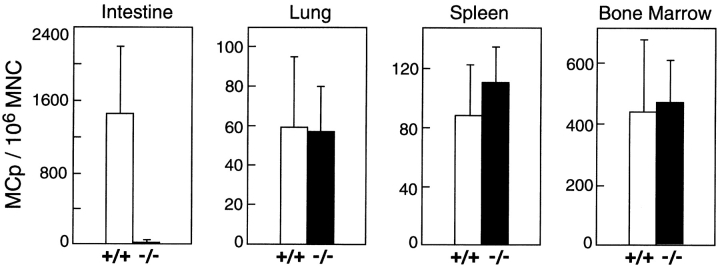
Figure 2. Concentrations of MCp in the small intestine, lung, spleen, and BM of wild-type (C57BL/6, +/+, white bars) control and β7 integrin-deficient mice (−/−, black bars) evaluated in parallel. The data are from three separate experiments and the values are the mean ± SEM. SCF plus IL-3 was used to determine MCp concentration, expressed as the number of MCp/106 MNCs.
Figure 2. Concentrations of MCp in the small intestine, lung, spleen, and BM of wild-type (C57BL/6, +/+, white bars) control and β7 integrin-deficient mice (−/−, black bars) evaluated in parallel. The data are from three separate experiments and the values are the mean ± SEM. SCF plus IL-3 was used to determine MCp concentration, expressed as the number of MCp/106 MNCs.CC BY-NC-SA · PubMed Central
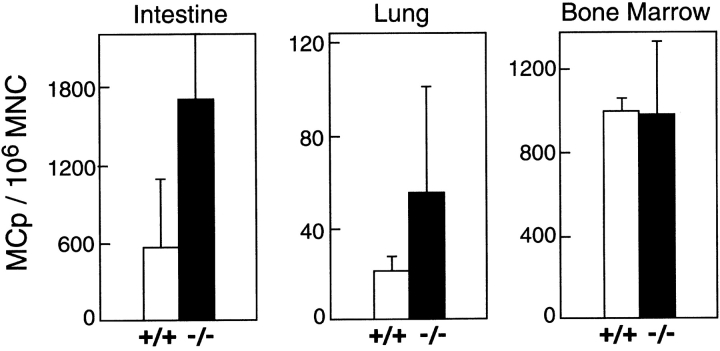
Figure 3. Concentrations of MCp in the small intestine, lung, and BM of wild-type (C57BL/6, +/+, white bars) controls and RAG-2/IL-receptor common γ-chain (γc) double-deficient mice (−/−, black bars). The data are the mean ± 1/2 range of MCp/106 MNCs from two experiments using SCF plus IL-3 in which concentrations in wild-type and deficient mice were determined in parallel.
Figure 3. Concentrations of MCp in the small intestine, lung, and BM of wild-type (C57BL/6, +/+, white bars) controls and RAG-2/IL-receptor common γ-chain (γc) double-deficient mice (−/−, black bars). The data are the mean ± 1/2 range of MCp/106 MNCs from two experiments using SCF plus IL-3 in which concentrations in wild-type and deficient mice were determined in parallel.CC BY-NC-SA · PubMed Central
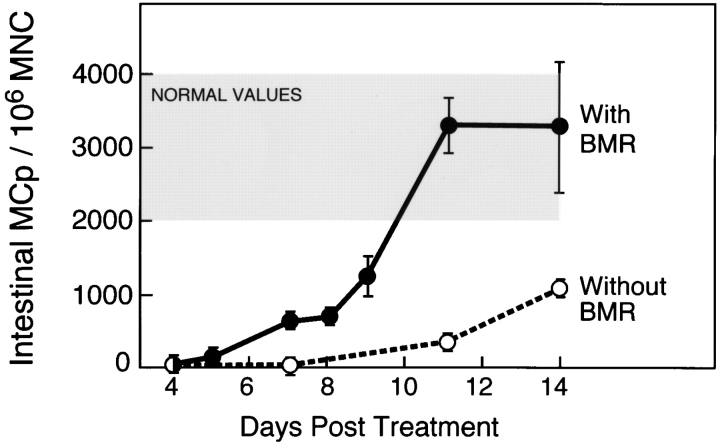
Figure 4. Recovery of MCp in the small intestine of BALB/c mice after sublethal irradiation with (filled circles) or without (open circles) BM reconstitution (BMR). Values for MCp concentrations without BM reconstitution are the mean ± 1/2 range of two experiments. Values for animals receiving BM reconstitution are the mean ± SEM of the following number of experiments: day 7, n = 12; day 8, n = 9; day 9, n = 6; day 11, n = 5; day 14, n = 4. MCp concentrations were determined with SCF plus IL-3. The shaded area represents the mean ± SEM concentration of MCp in normal BALB/c small intestine (from Fig. 1, SCF plus IL-3).
Figure 4. Recovery of MCp in the small intestine of BALB/c mice after sublethal irradiation with (filled circles) or without (open circles) BM reconstitution (BMR). Values for MCp concentrations without BM reconstitution are the mean ± 1/2 range of two experiments. Values for animals receiving BM reconstitution are the mean ± SEM of the following number of experiments: day 7, n = 12; day 8, n = 9; day 9, n = 6; day 11, n = 5; day 14, n = 4. MCp concentrations were determined with SCF plus IL-3. The shaded area represents the mean ± SEM concentration of MCp in normal BALB/c small intestine (from Fig. 1, SCF plus IL-3).CC BY-NC-SA · PubMed Central
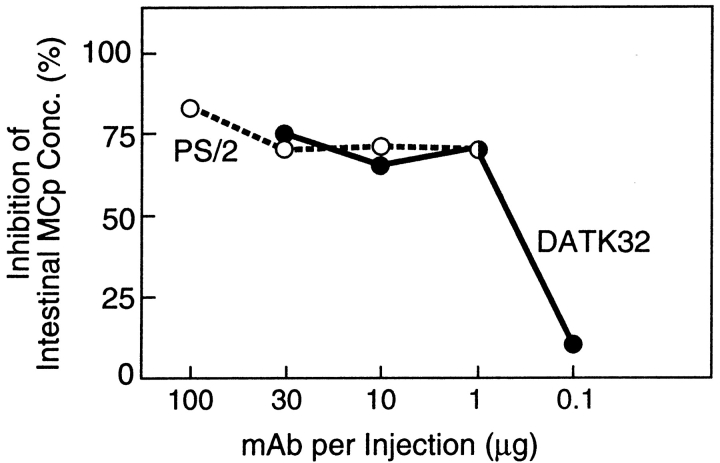
Figure 5. Effect of the blocking anti-integrin mAb, PS/2 (anti-α4, rat IgG2b, open circles) and DATK32 (anti-α4β7, rat IgG2a, filled circles), on the recovery of MCp in the small intestine of BALB/c mice. MCp concentrations were determined 9 d after sublethal irradiation and BM reconstitution and are expressed as the percent inhibition of MCp concentrations in the intestine relative to mice treated with a control mAb (rat anti–mouse IgD, IgG2a) or HBSS. mAb was diluted in HBSS and administered intraperitoneally every other day starting 4 h after BM reconstitution. The results are the average inhibition for two or three experiments with the following n values: For PS/2, 100 μg, n = 2; 30 μg, n = 3, 10 μg and 1 μg, n = 1; for DATK32, 30 μg, n = 3, for 10 μg, 1 μg, and 0.1 μg, n = 1. The average concentration of intestinal MCp for mice given the control mAb or HBSS was 903 ± 311 MCp/106 MNCs (mean ± SEM, n = 5).
Figure 5. Effect of the blocking anti-integrin mAb, PS/2 (anti-α4, rat IgG2b, open circles) and DATK32 (anti-α4β7, rat IgG2a, filled circles), on the recovery of MCp in the small intestine of BALB/c mice. MCp concentrations were determined 9 d after sublethal irradiation and BM reconstitution and are expressed as the percent inhibition of MCp concentrations in the intestine relative to mice treated with a control mAb (rat anti–mouse IgD, IgG2a) or HBSS. mAb was diluted in HBSS and administered intraperitoneally every other day starting 4 h after BM reconstitution. The results are the average inhibition for two or three experiments with the following n values: For PS/2, 100 μg, n = 2; 30 μg, n = 3, 10 μg and 1 μg, n = 1; for DATK32, 30 μg, n = 3, for 10 μg, 1 μg, and 0.1 μg, n = 1. The average concentration of intestinal MCp for mice given the control mAb or HBSS was 903 ± 311 MCp/106 MNCs (mean ± SEM, n = 5).CC BY-NC-SA · PubMed Central
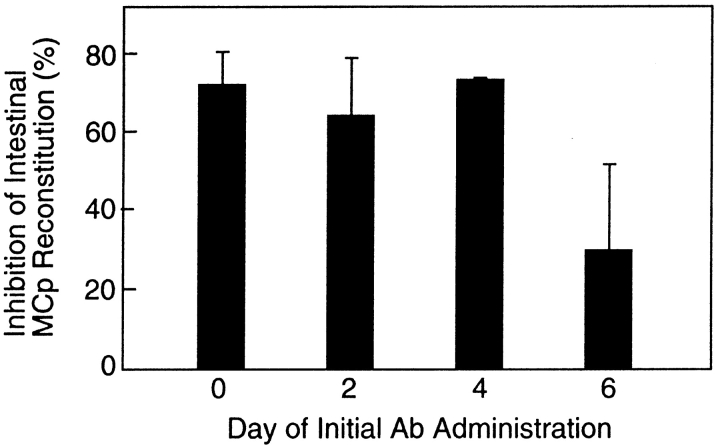
Figure 6. Effect of delaying the time of initial administration of the blocking mAb DATK32 (anti-α4β7 integrin) on the recovery of MCp in the small intestine of BALB/c mice. The MCp concentrations were determined 7 d after sublethal irradiation and BM reconstitution and are expressed as the percent inhibition of MCp concentrations in the intestine relative to the mice treated with the isotype-matched rat anti–mouse IgD mAb. The control mice had an average MCp concentration of 632 ± 206 MCp/106 MNCs (mean ± SEM, n = 6). Experimental values are the mean ± SEM of four (day 0 and day 2) or two (day 4 and day 6) experiments.
Figure 6. Effect of delaying the time of initial administration of the blocking mAb DATK32 (anti-α4β7 integrin) on the recovery of MCp in the small intestine of BALB/c mice. The MCp concentrations were determined 7 d after sublethal irradiation and BM reconstitution and are expressed as the percent inhibition of MCp concentrations in the intestine relative to the mice treated with the isotype-matched rat anti–mouse IgD mAb. The control mice had an average MCp concentration of 632 ± 206 MCp/106 MNCs (mean ± SEM, n = 6). Experimental values are the mean ± SEM of four (day 0 and day 2) or two (day 4 and day 6) experiments.CC BY-NC-SA · PubMed Central
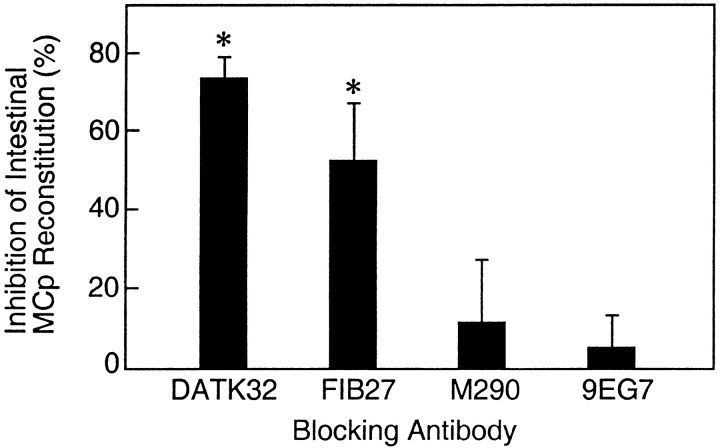
Figure 7. Comparison of the inhibition by mAb to α4β7, β7, αE, or β1 integrins of the recovery of MCp in the small intestine of BALB/c mice. Animals received 30 μg of the indicated mAb, DATK32, FIB27, M290, or 9EG7, directed against α4β7, β7, αE, or β1 integrins, respectively, starting 0 or 2 d after sublethal irradiation and BM reconstitution. Values represent the mean ± SEM percent inhibition relative to control animals treated in parallel. MCp concentrations were analyzed 7 or 8 d after sublethal irradiation and BM reconstitution. Means are from seven (DATK32), three (FIB27, M290), or four (9EG7) experiments. The mean MCp concentration for the control mice was 622 ± 65 MCp/106 MNCs (mean ± SEM). Asterisks indicate statistically significant inhibition relative to mice injected with anti-β1 integrin mAb (P < 0.03).
Figure 7. Comparison of the inhibition by mAb to α4β7, β7, αE, or β1 integrins of the recovery of MCp in the small intestine of BALB/c mice. Animals received 30 μg of the indicated mAb, DATK32, FIB27, M290, or 9EG7, directed against α4β7, β7, αE, or β1 integrins, respectively, starting 0 or 2 d after sublethal irradiation and BM reconstitution. Values represent the mean ± SEM percent inhibition relative to control animals treated in parallel. MCp concentrations were analyzed 7 or 8 d after sublethal irradiation and BM reconstitution. Means are from seven (DATK32), three (FIB27, M290), or four (9EG7) experiments. The mean MCp concentration for the control mice was 622 ± 65 MCp/106 MNCs (mean ± SEM). Asterisks indicate statistically significant inhibition relative to mice injected with anti-β1 integrin mAb (P < 0.03).CC BY-NC-SA · PubMed Central
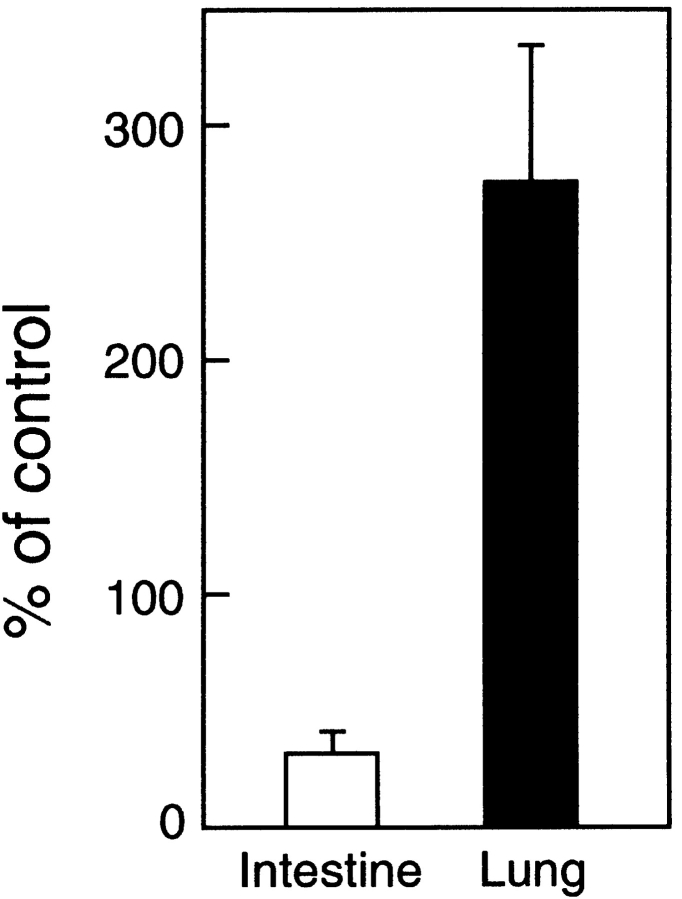
Figure 8. Inhibition by mAb to α4β7 integrin of the recovery of MCp in the small intestine of BALB/c mice is accompanied by increased MCp in the lung. Animals received 30 μg of the mAb, DATK32, directed against the α4β7 integrin, or a control injection of HBSS or isotype matched rat mAb, starting 2 d after sublethal irradiation and BM reconstitution. Values represent the mean ± SEM (n = 4) of the MCp concentration in the indicated tissues expressed as a percentage of the value obtained from control animals treated in parallel. MCp concentrations were analyzed 7 d after sublethal irradiation and BM reconstitution. The MCp concentrations for the control mice were 1,068 ± 390 and 252 ± 51 MCp/106 MNCs (mean ± SEM) for the intestine and lung, respectively.
Figure 8. Inhibition by mAb to α4β7 integrin of the recovery of MCp in the small intestine of BALB/c mice is accompanied by increased MCp in the lung. Animals received 30 μg of the mAb, DATK32, directed against the α4β7 integrin, or a control injection of HBSS or isotype matched rat mAb, starting 2 d after sublethal irradiation and BM reconstitution. Values represent the mean ± SEM (n = 4) of the MCp concentration in the indicated tissues expressed as a percentage of the value obtained from control animals treated in parallel. MCp concentrations were analyzed 7 d after sublethal irradiation and BM reconstitution. The MCp concentrations for the control mice were 1,068 ± 390 and 252 ± 51 MCp/106 MNCs (mean ± SEM) for the intestine and lung, respectively.CC BY-NC-SA · PubMed Central

Verification

Claims the paper makes

The claims and statistics of this paper haven’t been checked yet.

Run the check — free, no account needed. It reads the open-access text and checks the sources it cites.

A few free checks a day · papers already verified open instantly · results are public

Claims other papers make about this one

Each is checked against this paper’s own text: does it say what the citing paper says it does?

Self-check

Percentages, sums and reported differences re-computed from the paper’s own numbers.

The self-check needs the paper’s full text.

Citations

Cites

No references could be resolved yet.

Research works printed but not linked: 52

  1. 2000, J. Allergy Clin. Immunol., 105, 847, 10.1067/mai.2000.106485 · DOI
  2. 1997, Physiol. Rev., 77, 1033, 10.1152/physrev.1997.77.4.1033 · DOI
  3. 1995, Immunity., 3, 1, 10.1016/1074-7613(95)90152-3 · DOI
  4. 1996, J. Cell Biol., 135, 279, 10.1083/jcb.135.1.279 · DOI
  5. 1996, Nature., 381, 77, 10.1038/381077a0 · DOI
  6. 1996, Nature., 381, 75, 10.1038/381075a0 · DOI
  7. 1976, Nature, 264, 258, 10.1038/264258a0 · DOI
  8. 1991, J. Immunol., 147, 1387, 10.4049/jimmunol.147.4.1387 · DOI
  9. 2000, J. Immunol, 164, 2046, 10.4049/jimmunol.164.4.2046 · DOI
  10. 1998, Nature., 392, 90, 10.1038/32190 · DOI
  11. 1984, Immunology., 53, 337
  12. 1987, Jpn. J. Vet. Res., 35, 195
  13. 1993, Parasite Immunol., 15, 55, 10.1111/j.1365-3024.1993.tb00572.x · DOI
  14. 1979, Blood., 53, 492, 10.1182/blood.V53.3.492.492 · DOI
  15. 1987, Am. J. Pathol., 127, 191
  16. 1983, J. Immunol., 130, 558, 10.4049/jimmunol.130.2.558 · DOI
  17. 1984, J. Exp. Med., 160, 12, 10.1084/jem.160.1.12 · DOI
  18. 1983, J. Immunol., 131, 923, 10.4049/jimmunol.131.2.923 · DOI
  19. 1987, Immunology., 60, 565
  20. 1996, Science., 271, 818, 10.1126/science.271.5250.818 · DOI · Paper page
  21. 1995, Blood., 85, 1334, 10.1182/blood.V85.5.1334.bloodjournal8551334 · DOI
  22. 1995, Blood., 85, 57, 10.1182/blood.V85.1.57.bloodjournal85157 · DOI
  23. 1999, J. Immunol., 162, 6641, 10.4049/jimmunol.162.11.6641 · DOI
  24. 1991, J. Immunol., 146, 1527, 10.4049/jimmunol.146.5.1527 · DOI
  25. 1998, J. Immunol., 161, 5143, 10.4049/jimmunol.161.10.5143 · DOI
  26. 1990, Eur. J. Immunol., 20, 2201, 10.1002/eji.1830201008 · DOI
  27. 1994, J. Exp. Med., 180, 67, 10.1084/jem.180.1.67 · DOI
  28. 1985, J. Cell. Physiol., 122, 187, 10.1002/jcp.1041220204 · DOI
  29. 1996, Nature., 382, 366, 10.1038/382366a0 · DOI
  30. 1999, J. Exp. Med., 189, 1631, 10.1084/jem.189.10.1631 · DOI
  31. 1996, Immunity., 5, 263, 10.1016/S1074-7613(00)80321-0 · DOI
  32. 1995, Immunity., 3, 99, 10.1016/1074-7613(95)90162-0 · DOI
  33. 1995, Immunity., 2, 223, 10.1016/1074-7613(95)90047-0 · DOI
  34. 1992, Cell., 68, 855, 10.1016/0092-8674(92)90029-C · DOI · Paper page
  35. 1979, Nature., 281, 154, 10.1038/281154a0 · DOI
  36. 1983, Rad. Res., 93, 147, 10.2307/3575950 · DOI · Paper page
  37. 1994, J. Immunol., 153, 3847, 10.4049/jimmunol.153.9.3847 · DOI
  38. 1991, Eur. J. Immunol., 21, 2591, 10.1002/eji.1830211041 · DOI
  39. 1993, Cell., 74, 185, 10.1016/0092-8674(93)90305-A · DOI · Paper page
  40. 1996, Eur. J. Immunol., 26, 897, 10.1002/eji.1830260427 · DOI
  41. 1994, J. Immunol., 152, 3282, 10.4049/jimmunol.152.7.3282 · DOI
  42. 1977, Parasitology., 74, 215, 10.1017/S0031182000047843 · DOI
  43. 1997, Parasitology., 115(Suppl), S33
  44. 2000, Eur. J. Immunol., 30, 1656, 10.1002/1521-4141(200006)30:6<1656::AID-IMMU1656>3.0.CO;2-Z · DOI
  45. 1994, Am. J. Pathol., 144, 321
  46. 1994, J. Immunol., 153, 2194, 10.4049/jimmunol.153.5.2194 · DOI
  47. 1997, J. Clin. Invest., 99, 1721, 10.1172/JCI119336 · DOI
  48. 1998, Am. J. Physiol., 275, C1291, 10.1152/ajpcell.1998.275.5.C1291 · DOI
  49. 1999, Int. J. Biochem. Cell Biol., 31, 1037, 10.1016/S1357-2725(99)00076-X · DOI
  50. 1995, Immunology., 86, 427
  51. 1991, Proc. Natl. Acad. Sci. USA., 88, 6382, 10.1073/pnas.88.14.6382 · DOI
  52. 1990, Blood., 75, 1637, 10.1182/blood.V75.8.1637.1637 · DOI

Cited by

Sorted by citations

Metadata

Authors
Gurish, M. F., Tao, H., Abonia, J. P., Arya, A., Friend, D. S., Parker, C. M., & Austen, K. F.
Affiliations
  • 1Department of Medicine, Harvard Medical School, Boston, MA 02115
  • 2Department of Pathology, Harvard Medical School, Boston, MA 02115
Venue
The Journal of Experimental Medicine
Published
2001-10-29
Volume
194
Issue
9
Pages
1243-1252
ISSN
  • 1540-9538
  • 0022-1007
Cited by
193
References
0
Language
en

About these checks

Registry, retraction, Cites and statistics results are computed, not judged, with one exception: a printed reference that no index lists is read once by a model before it counts as a citation error. Claims are extracted by a model and kept only when their quote appears verbatim in the text; each cited source is then checked, with a model’s help, for whether it says what the claim relies on. Those verdicts can be wrong — read the claim’s quote and the cited source before relying on one.

Statistics and arithmetic are recomputed, not judged.

Confidence bands are shown only for fields calibrated on our annotated test set. None is calibrated yet, so no band is shown.

What counts as a claim ›How we measure confidence ›How we check this ›

Are you an author, or do you see a problem with this page? Request a review