Cited by 545Heat shock proteins researchCell death mechanisms and regulationAutophagy in Disease and Therapy

The DOI matches its Crossref record; 42 of the 42 references it cites were found in a registry or an index.

Heat Shock Protein 70 Promotes Cell Survival by Inhibiting Lysosomal Membrane Permeabilization

Open access
Nylandsted, Jesper, Gyrd-Hansen, Mads, Danielewicz, Agnieszka, Fehrenbacher, Nicole, Lademann, Ulrik, Høyer-Hansen, Maria, Weber, Ekkehard, Multhoff, Gabriele, Rohde, Mikkel, Jäättelä, Marja·2004·The Journal of Experimental Medicine

Abstract

Heat shock protein 70 (Hsp70) is a potent survival protein whose depletion triggers massive caspase-independent tumor cell death. Here, we show that Hsp70 exerts its prosurvival function by inhibiting lysosomal membrane permeabilization. The cell death induced by Hsp70 depletion was preceded by the release of lysosomal enzymes into the cytosol and inhibited by pharmacological inhibitors of lysosomal cysteine proteases. Accordingly, the Hsp70-mediated protection against various death stimuli in Hsp70-expressing human tumor cells as well as in immortalized Hsp70 transgenic murine fibroblasts occurred at the level of the lysosomal permeabilization. On the contrary, Hsp70 failed to inhibit the cytochrome c–induced, apoptosome-dependent caspase activation in vitro and Fas ligand–induced, caspase-dependent apoptosis in immortalized fibroblasts. Immunoelectron microscopy revealed that endosomal and lysosomal membranes of tumor cells contained Hsp70. Permeabilization of purified endo/lysosomes by digitonin failed to release Hsp70, suggesting that it is physically associated with the membranes. Finally, Hsp70 positive lysosomes displayed increased size and resistance against chemical and physical membrane destabilization. These data identify Hsp70 as the first survival protein that functions by inhibiting the death-associated permeabilization of lysosomes.

Overview

The claims and statistics of this paper haven’t been checked yet.

Run the check — free, no account needed. It reads the open-access text and checks the sources it cites.

A few free checks a day · papers already verified open instantly · results are public

Integrity signals

Registry

Crossref · 10.1084/jem.20040531

Cites

42 of 42 references verified0 citation errors · 0 not checkable

Statistics

Figures

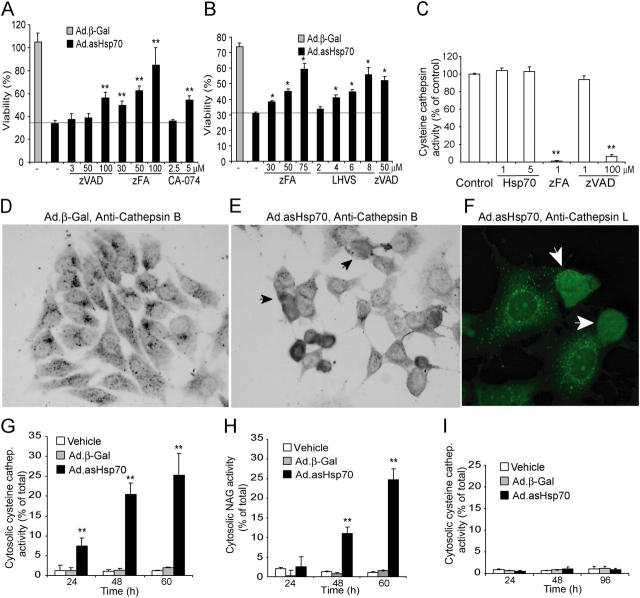
Figure 1. Ad.asHsp70 induces LMP and cathepsin-mediated PCD. (A and B) MCF-7 (A) and MDA-MB-468 (B) breast cancer cells were left untreated or infected with Ad.β-Gal or Ad.asHsp70. 6 h later, cells were trypsinized and plated on a 96-well plate at a density of 6,000 cells/well. After an additional 6 h (MCF-7) or 18 h (MDA-MB-468), the indicated protease inhibitors at indicated concentrations were added, and 72 h after the infection, the survival of the cells was determined by the MTT assay. The survival of Ad.β-Gal–treated cells is expressed as a percentage of noninfected cells and that of Ad.asHsp70-infected cells as a percentage of Ad.β-Gal–infected cells treated with the same inhibitors. (C) The cysteine cathepsin activity in WEHI-S cell lysates (4 × 10⁵ cells/ml) containing indicated concentrations of recombinant Hsp70 were measured using zFR-AFC as a fluorogenic probe. The specificity of the assay for cysteine cathepsins was demonstrated by the ability of 1 μM zFA-fmk, but not 1 μM zVAD-fmk, to attenuate the protease activity. (D–F) MCF-7 cells were stained with antibodies against human cathepsin B (D and E) or L (F) 65 h after the infection with Ad.β-Gal (D) or Ad.asHsp70 (E and F) and visualized using biotinylated (D and E) or FITC-coupled (F) secondary antibodies. Representative fields are shown, and cells with cathepsins released into the cytosol are marked with arrows. (G–I) MCF-7 (G and H) and HBL-100 (I) cells were infected with Ad.β-Gal or Ad.asHsp70, and the cysteine cathepsin (G and I) and NAG (H) activities of digitonin-extracted cytosols and total cellular lysates were analyzed at the indicated time points. The results are expressed as percentages of the cytosolic activity of the total activity and corrected for the LDH activity. The values represent means of triplicate determinations. *, P < 0.02l; **, P < 0.01. All experiments were repeated two to four times with essentially similar results.
Figure 1. Ad.asHsp70 induces LMP and cathepsin-mediated PCD. (A and B) MCF-7 (A) and MDA-MB-468 (B) breast cancer cells were left untreated or infected with Ad.β-Gal or Ad.asHsp70. 6 h later, cells were trypsinized and plated on a 96-well plate at a density of 6,000 cells/well. After an additional 6 h (MCF-7) or 18 h (MDA-MB-468), the indicated protease inhibitors at indicated concentrations were added, and 72 h after the infection, the survival of the cells was determined by the MTT assay. The survival of Ad.β-Gal–treated cells is expressed as a percentage of noninfected cells and that of Ad.asHsp70-infected cells as a percentage of Ad.β-Gal–infected cells treated with the same inhibitors. (C) The cysteine cathepsin activity in WEHI-S cell lysates (4 × 10⁵ cells/ml) containing indicated concentrations of recombinant Hsp70 were measured using zFR-AFC as a fluorogenic probe. The specificity of the assay for cysteine cathepsins was demonstrated by the ability of 1 μM zFA-fmk, but not 1 μM zVAD-fmk, to attenuate the protease activity. (D–F) MCF-7 cells were stained with antibodies against human cathepsin B (D and E) or L (F) 65 h after the infection with Ad.β-Gal (D) or Ad.asHsp70 (E and F) and visualized using biotinylated (D and E) or FITC-coupled (F) secondary antibodies. Representative fields are shown, and cells with cathepsins released into the cytosol are marked with arrows. (G–I) MCF-7 (G and H) and HBL-100 (I) cells were infected with Ad.β-Gal or Ad.asHsp70, and the cysteine cathepsin (G and I) and NAG (H) activities of digitonin-extracted cytosols and total cellular lysates were analyzed at the indicated time points. The results are expressed as percentages of the cytosolic activity of the total activity and corrected for the LDH activity. The values represent means of triplicate determinations. *, P < 0.02l; **, P < 0.01. All experiments were repeated two to four times with essentially similar results.CC BY-NC-SA · PubMed Central
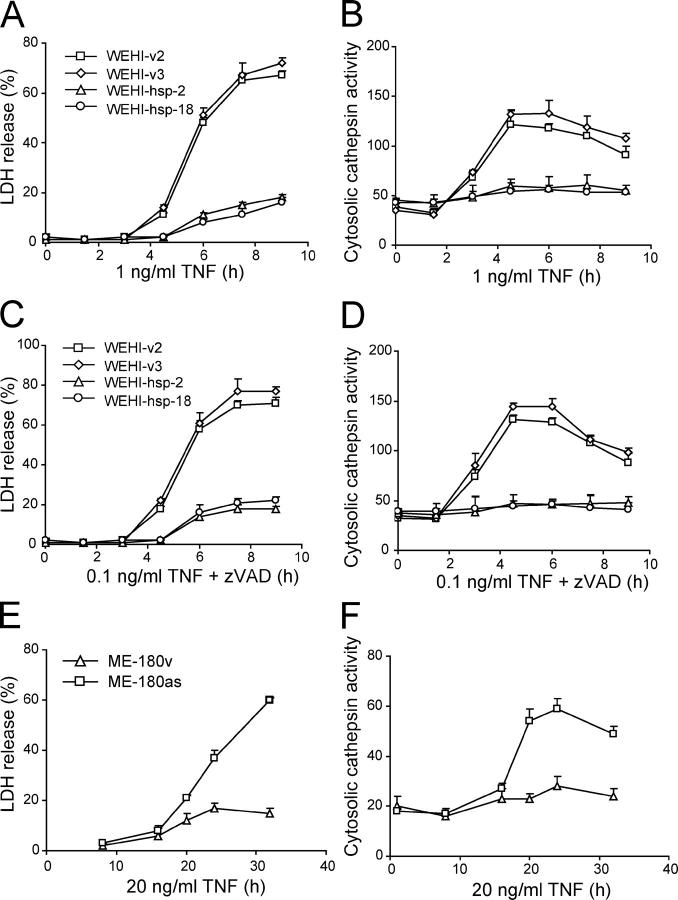
Figure 2. Hsp70 inhibits TNF-induced lysosomal release of cysteine cathepsins in tumor cells. Vector and Hsp70-transfected WEHI-S clones (A–D) or vector- and asHsp70-transfected ME-180 cells (E and F) were treated as indicated and analyzed for the cytosolic cysteine cathepsin activity (arbitrary units) as a measure of LMP (B, D, and F) and for the released LDH activity (percentage of total activity) as a measure of cytotoxicity (A, C, and E). The values represent means of a triplicate determination ± SD. The experiments were repeated twice with essentially similar results.
Figure 2. Hsp70 inhibits TNF-induced lysosomal release of cysteine cathepsins in tumor cells. Vector and Hsp70-transfected WEHI-S clones (A–D) or vector- and asHsp70-transfected ME-180 cells (E and F) were treated as indicated and analyzed for the cytosolic cysteine cathepsin activity (arbitrary units) as a measure of LMP (B, D, and F) and for the released LDH activity (percentage of total activity) as a measure of cytotoxicity (A, C, and E). The values represent means of a triplicate determination ± SD. The experiments were repeated twice with essentially similar results.CC BY-NC-SA · PubMed Central
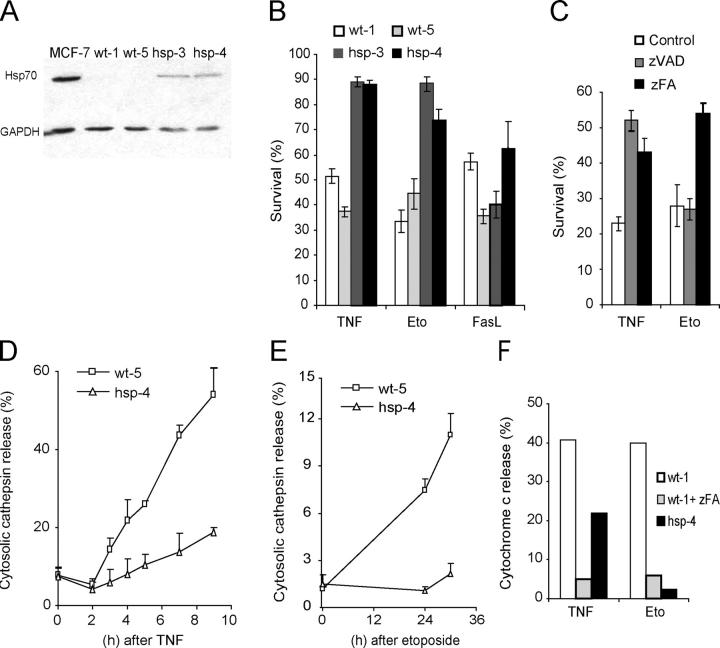
Figure 3. Hsp70 inhibits TNF- and etoposide-induced death upstream of LMP and mitochondrial outer membrane permeabilization in iMEFs. (A) An immunoblot demonstrating the moderate expression level of the Hsp70 transgene in iMEFs originating from Hsp70 transgenic animals (hsp-3 and -4). iMEFs from wild-type animals (wt-1 and -5) express barely detectable levels of Hsp70 (visible in longer exposure). Proteins from MCF-7 cells serve as a positive control, and immunoblot for GAPDH demonstrates the fairly equal loading of the protein. (B and C) The sensitivity of the iMEFs to TNF (1 ng/ml murine TNF plus 4 μM CHX for 18 h), etoposide (Eto; 50 μM for 48 h), and Fas ligand (2.5% Fas ligand–containing supernatant plus 4 μM CHX for 18 h) in the absence or presence of 10 μM zVAD-fmk (zVAD) or 50 μM zFA-fmk (zFA) was evaluated by MTT reduction assay, and the survival is expressed as the percentage of untreated cells. (D and E) iMEFs were treated with 1 ng/ml TNF plus 4 μM CHX (D) or 50 μM etoposide (E) for indicated times and analyzed for the cytosolic cysteine cathepsin activity as a measure of LMP. The values represent percentages of total activity. (F) iMEFs were grown on coverslips, treated with 1 ng/ml TNF plus 4 μM CHX for 8 h or 50 μM etoposide for 48 h, fixed, and analyzed for cytochrome c release by immunostaining. When indicated cells were pretreated for 1 h with 50 μM zFA-fmk (zFA). A minimum of 500 cells were counted, and the values represent the percentages of cells with diffuse (extra-mitochondrial) cytochrome c staining. (B–E) The values represent the means of a triplicate determination ± SD. All assays were repeated at least once with essentially similar results, and additional experiments with five (C) or two (D–F) independent iMEF clones gave similar results.
Figure 3. Hsp70 inhibits TNF- and etoposide-induced death upstream of LMP and mitochondrial outer membrane permeabilization in iMEFs. (A) An immunoblot demonstrating the moderate expression level of the Hsp70 transgene in iMEFs originating from Hsp70 transgenic animals (hsp-3 and -4). iMEFs from wild-type animals (wt-1 and -5) express barely detectable levels of Hsp70 (visible in longer exposure). Proteins from MCF-7 cells serve as a positive control, and immunoblot for GAPDH demonstrates the fairly equal loading of the protein. (B and C) The sensitivity of the iMEFs to TNF (1 ng/ml murine TNF plus 4 μM CHX for 18 h), etoposide (Eto; 50 μM for 48 h), and Fas ligand (2.5% Fas ligand–containing supernatant plus 4 μM CHX for 18 h) in the absence or presence of 10 μM zVAD-fmk (zVAD) or 50 μM zFA-fmk (zFA) was evaluated by MTT reduction assay, and the survival is expressed as the percentage of untreated cells. (D and E) iMEFs were treated with 1 ng/ml TNF plus 4 μM CHX (D) or 50 μM etoposide (E) for indicated times and analyzed for the cytosolic cysteine cathepsin activity as a measure of LMP. The values represent percentages of total activity. (F) iMEFs were grown on coverslips, treated with 1 ng/ml TNF plus 4 μM CHX for 8 h or 50 μM etoposide for 48 h, fixed, and analyzed for cytochrome c release by immunostaining. When indicated cells were pretreated for 1 h with 50 μM zFA-fmk (zFA). A minimum of 500 cells were counted, and the values represent the percentages of cells with diffuse (extra-mitochondrial) cytochrome c staining. (B–E) The values represent the means of a triplicate determination ± SD. All assays were repeated at least once with essentially similar results, and additional experiments with five (C) or two (D–F) independent iMEF clones gave similar results.CC BY-NC-SA · PubMed Central
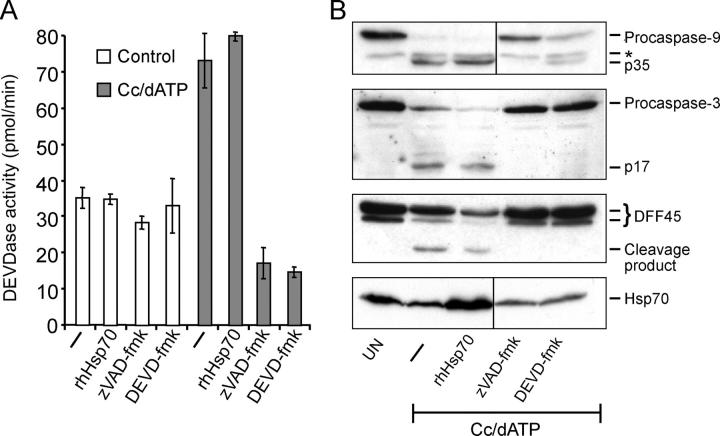
Figure 4. Hsp70 does not inhibit the apoptosome-mediated activation of caspases. Cytosolic extracts prepared from HeLa cells were incubated for 90 min with 1 μM cytochrome c and 1 mM dATP (Cc/dATP) in the presence or absence of 2 μM of recombinant human Hsp70, 1 μM zVAD-fmk, or 0.1 μM DEVD-fmk. (A) Caspase-3–like activity was assessed by spectrofluorometric quantification of DEVD-AFC cleavage and presented as pmol per min. (B) Thereafter, samples were analyzed by immunoblotting using antibodies specific against the indicated proteins. *, a background band. Vertical lines indicate that intervening lanes have been spliced out. The experiment was repeated twice with similar results.
Figure 4. Hsp70 does not inhibit the apoptosome-mediated activation of caspases. Cytosolic extracts prepared from HeLa cells were incubated for 90 min with 1 μM cytochrome c and 1 mM dATP (Cc/dATP) in the presence or absence of 2 μM of recombinant human Hsp70, 1 μM zVAD-fmk, or 0.1 μM DEVD-fmk. (A) Caspase-3–like activity was assessed by spectrofluorometric quantification of DEVD-AFC cleavage and presented as pmol per min. (B) Thereafter, samples were analyzed by immunoblotting using antibodies specific against the indicated proteins. *, a background band. Vertical lines indicate that intervening lanes have been spliced out. The experiment was repeated twice with similar results.CC BY-NC-SA · PubMed Central
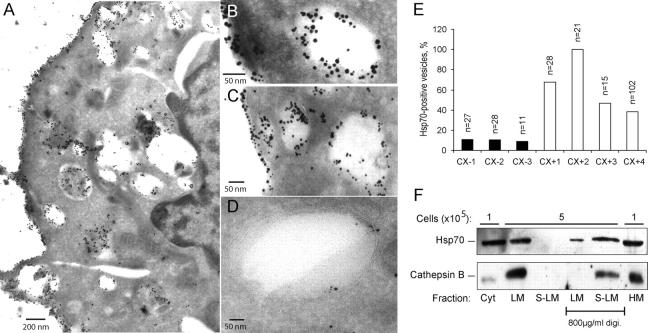
Figure 5. Hsp70 is localized on lysosomal membranes. Representative cryo-ultramicrotomy images of Hsp70 membrane positive CX+ (A–C) and membrane negative CX− (D) tumor cells labeled either with a murine anti-Hsp70 antibody alone (A) or together with rabbit anti-cathepsin D antibodies (B–D) are shown. (A) Localization of Hsp70 (10 nm gold particles) can be detected in the cytosol, plasma membrane and intracellular vesicles of CX+ tumor cells. (B and C) Colocalization of Hsp70 (visualized by 10-nm gold particles) and cathepsin D (visualized by 5-nm gold particles) in intracellular vesicles and on the plasma membrane can be detected in CX+ cells. (D) In CX− tumor cells, only minimal amounts of Hsp70 were detectable in cathepsin D positive vesicles. (E) The percentage of Hsp70 positive vesicles of all cathepsin D positive vesicles was calculated in pictures of 3 CX− and 4 CX+ cells. The number of cathepsin D positive vesicles/picture is indicated (top of bars). (F) iMEF-hsp-4 cells were fractionated as described in Materials and Methods, and the proteins from the indicated fractions originating from the indicated amount of cells were analyzed by immunoblotting with rabbit and goat antibodies against Hsp70 and cathepsin B, respectively. Where indicated, the samples were incubated with a buffer containing 800 μg/ml digitonin to permeabilize the membranes. Cyt, cytoplasm; HM, heavy membrane; LM, light membrane; S-LM, supernatant of the LM.
Figure 5. Hsp70 is localized on lysosomal membranes. Representative cryo-ultramicrotomy images of Hsp70 membrane positive CX+ (A–C) and membrane negative CX− (D) tumor cells labeled either with a murine anti-Hsp70 antibody alone (A) or together with rabbit anti-cathepsin D antibodies (B–D) are shown. (A) Localization of Hsp70 (10 nm gold particles) can be detected in the cytosol, plasma membrane and intracellular vesicles of CX+ tumor cells. (B and C) Colocalization of Hsp70 (visualized by 10-nm gold particles) and cathepsin D (visualized by 5-nm gold particles) in intracellular vesicles and on the plasma membrane can be detected in CX+ cells. (D) In CX− tumor cells, only minimal amounts of Hsp70 were detectable in cathepsin D positive vesicles. (E) The percentage of Hsp70 positive vesicles of all cathepsin D positive vesicles was calculated in pictures of 3 CX− and 4 CX+ cells. The number of cathepsin D positive vesicles/picture is indicated (top of bars). (F) iMEF-hsp-4 cells were fractionated as described in Materials and Methods, and the proteins from the indicated fractions originating from the indicated amount of cells were analyzed by immunoblotting with rabbit and goat antibodies against Hsp70 and cathepsin B, respectively. Where indicated, the samples were incubated with a buffer containing 800 μg/ml digitonin to permeabilize the membranes. Cyt, cytoplasm; HM, heavy membrane; LM, light membrane; S-LM, supernatant of the LM.CC BY-NC-SA · PubMed Central
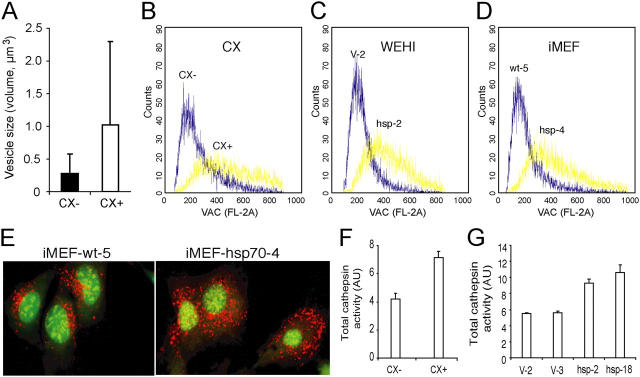
Figure 6. Hsp70 increases the volume of the acidic compartment and total cellular cysteine cathepsin activity. (A) The diameters of cathepsin D positive vesicles in representative cryo-ultramicrotomy images (magnification, 23,000) of CX+ (n = 19) and CX− (n = 13) tumor cells labeled with cathepsin D antibody were measured. The values present theoretical volumes of the vesicles calculated with the formula 4/3 × πr3 ± SD. P < 0.05. (B–E) CX+ and CX− (B), WEHI-hsp-2 and WEHI-V-2 (C), and iMEF-hsp-4 and iMEF-wt-5 (D and E) cells were labeled with acridine orange, and the total volume of the acidic compartment (VAC) was measured by flow cytometry (B–D) or visualized by confocal microscopy (E). (F and G) The total cysteine cathepsin activities in cell lysates of CX+ and CX− cells (F) and vector-transfected (V-2 and V-3) and Hsp70-transfected (Hsp-2 and Hsp-18) WEHI-S clones (G) were measured as described in Materials and Methods. The values represent means of triplicate determinations. All experiments were repeated two to four times with essentially similar results.
Figure 6. Hsp70 increases the volume of the acidic compartment and total cellular cysteine cathepsin activity. (A) The diameters of cathepsin D positive vesicles in representative cryo-ultramicrotomy images (magnification, 23,000) of CX+ (n = 19) and CX− (n = 13) tumor cells labeled with cathepsin D antibody were measured. The values present theoretical volumes of the vesicles calculated with the formula 4/3 × πr3 ± SD. P < 0.05. (B–E) CX+ and CX− (B), WEHI-hsp-2 and WEHI-V-2 (C), and iMEF-hsp-4 and iMEF-wt-5 (D and E) cells were labeled with acridine orange, and the total volume of the acidic compartment (VAC) was measured by flow cytometry (B–D) or visualized by confocal microscopy (E). (F and G) The total cysteine cathepsin activities in cell lysates of CX+ and CX− cells (F) and vector-transfected (V-2 and V-3) and Hsp70-transfected (Hsp-2 and Hsp-18) WEHI-S clones (G) were measured as described in Materials and Methods. The values represent means of triplicate determinations. All experiments were repeated two to four times with essentially similar results.CC BY-NC-SA · PubMed Central
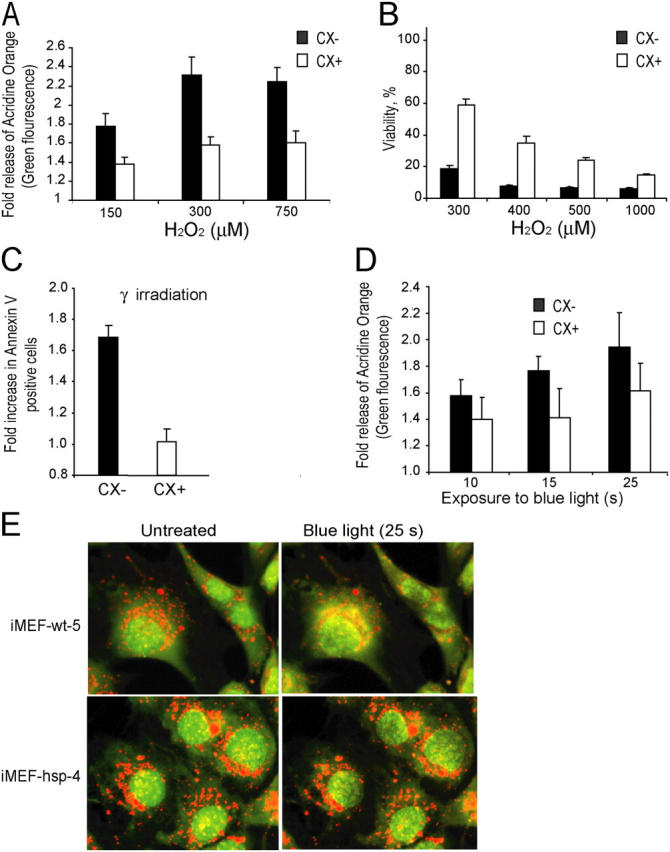
Figure 7. Hsp70 protects lysosomal membranes against permeabilization induced by oxidative stress or photolysis. (A–D) CX− (black bars) and CX+ (white bars) cells were treated for 30 min (A) or 24 h (B) with indicated concentrations of H2O2, exposed to 2 × 10 Gy γ-irradiation (C) or indicated times of blue light (D). Cells prestained with acridine orange were analyzed immediately afterwards (A) or 45 min after the treatment (D) for lysosomal leakage by flow cytometry (green fluorescence). The values represent the fold increases in the mean intensity of the green fluorescence. (B) The viability of the cells was analyzed 24 h after the treatment by the MTT reduction assay and is expressed as the percentage of untreated cells. (C) The number of apoptotic cells was analyzed by annexin V staining and is expressed as fold increase as compared with the untreated cells. (E) Wild-type and Hsp70-expressing iMEFs prestained with acridine orange were exposed to the 488-nm laser of the confocal microscope (10-s preexposure and 15-s imaging). Representative cells are shown. Notice the better preservation of the lysosomes in Hsp70-expressing cells. The experiments were repeated twice with similar results. The values represent averages ± SD of three independent experiments (A–D) or averages of 12 measurements.
Figure 7. Hsp70 protects lysosomal membranes against permeabilization induced by oxidative stress or photolysis. (A–D) CX− (black bars) and CX+ (white bars) cells were treated for 30 min (A) or 24 h (B) with indicated concentrations of H2O2, exposed to 2 × 10 Gy γ-irradiation (C) or indicated times of blue light (D). Cells prestained with acridine orange were analyzed immediately afterwards (A) or 45 min after the treatment (D) for lysosomal leakage by flow cytometry (green fluorescence). The values represent the fold increases in the mean intensity of the green fluorescence. (B) The viability of the cells was analyzed 24 h after the treatment by the MTT reduction assay and is expressed as the percentage of untreated cells. (C) The number of apoptotic cells was analyzed by annexin V staining and is expressed as fold increase as compared with the untreated cells. (E) Wild-type and Hsp70-expressing iMEFs prestained with acridine orange were exposed to the 488-nm laser of the confocal microscope (10-s preexposure and 15-s imaging). Representative cells are shown. Notice the better preservation of the lysosomes in Hsp70-expressing cells. The experiments were repeated twice with similar results. The values represent averages ± SD of three independent experiments (A–D) or averages of 12 measurements.CC BY-NC-SA · PubMed Central

Verification

Claims the paper makes

The claims and statistics of this paper haven’t been checked yet.

Run the check — free, no account needed. It reads the open-access text and checks the sources it cites.

A few free checks a day · papers already verified open instantly · results are public

Claims other papers make about this one

Each is checked against this paper’s own text: does it say what the citing paper says it does?

Self-check

Percentages, sums and reported differences re-computed from the paper’s own numbers.

The self-check needs the paper’s full text.

Citations

Cites

Show all 42 references

Research works printed but not linked: 7

  1. 2001, Nat. Rev. Mol. Cell Biol., 2, 589
  2. 2002, Cancer Res., 62, 7139
  3. 1998, Int. J. Cancer., 73, 468
  4. 1996, Transgenics., 2, 111
  5. 2004, Cancer Res., In press
  6. 2001, Redox Rep., 6, 91, 10.1179/135100001101536094 · DOI
  7. 2003, Haematologica., 88, 474

Cited by

Sorted by citations

See all 545

Metadata

Authors
Nylandsted, J., Gyrd-Hansen, M., Danielewicz, A., Fehrenbacher, N., Lademann, U., Høyer-Hansen, M., Weber, E., Multhoff, G., Rohde, M., & Jäättelä, M.
Affiliations
  • Danish Cancer Society (DK)
  • 1Department of Apoptosis, Institute for Cancer Biology, Danish Cancer Society, DK-2100 Copenhagen, Denmark
  • Martin Luther University Halle-Wittenberg (DE)
  • University Hospital Regensburg (DE)
Venue
The Journal of Experimental Medicine
Published
2004-08-16
Volume
200
Issue
4
Pages
425-435
ISSN
  • 0022-1007 (ISSN-L)
  • 1540-9538
OpenAlex
W2108205327
Cited by
545
References
42
Citations by year
2026: 6 · 2025: 15 · 2024: 13 · 2023: 20 · 2022: 17 · 2021: 29 · 2020: 20 · 2019: 13 · 2018: 22 · 2017: 23 · 2016: 30 · 2015: 35 · 2014: 33 · 2013: 45 · 2012: 20
FWCI
10.32
Type
journal article
Language
en
Open access
Locations
  • The Journal of Experimental Medicine (publishedVersion)
  • PubMed Central (publishedVersion, cc-by-nc-sa)
  • PubMed (publishedVersion)
  • University of Regensburg Publication Server (University of Regensburg) (acceptedVersion)
Funders
  • Kræftens Bekæmpelse
  • Sundhed og Sygdom, Det Frie Forskningsråd
  • European Commission
  • Medical Research Council
Topics
  • Life Sciences › Biochemistry, Genetics and Molecular Biology › Molecular Biology › Heat shock proteins research
  • Life Sciences › Biochemistry, Genetics and Molecular Biology › Molecular Biology › Cell death mechanisms and regulation
  • Life Sciences › Biochemistry, Genetics and Molecular Biology › Cell Biology › Autophagy in Disease and Therapy
Keywords
HSP70, lysosomal membrane permeabilization, cell survival, lysosomal cysteine proteases, lysosomal enzyme release, caspase-independent cell death, apoptosis, endosomal membrane, cancer cell death
MeSH terms
Animals, Cathepsins, Cell Membrane Permeability, Cell Survival, HeLa Cells, Humans, Lysosomes, Tumor Cells, Cultured, Immunoblotting, Microscopy, Immunoelectron, Apoptosis, HSP70 Heat-Shock Proteins, Caspases, Mice

About these checks

Registry, retraction, Cites and statistics results are computed, not judged, with one exception: a printed reference that no index lists is read once by a model before it counts as a citation error. Claims are extracted by a model and kept only when their quote appears verbatim in the text; each cited source is then checked, with a model’s help, for whether it says what the claim relies on. Those verdicts can be wrong — read the claim’s quote and the cited source before relying on one.

Statistics and arithmetic are recomputed, not judged.

Confidence bands are shown only for fields calibrated on our annotated test set. None is calibrated yet, so no band is shown.

What counts as a claim ›How we measure confidence ›How we check this ›

Are you an author, or do you see a problem with this page? Request a review