Cited by 285T-cell and B-cell ImmunologyPsoriasis: Treatment and PathogenesisCytokine Signaling Pathways and Interactions

The DOI matches its Crossref record; 38 of the 38 references it cites were found in a registry or an index.

Independent roles for IL-2 and GATA-3 in stimulating naive CD4+ T cells to generate a Th2-inducing cytokine environment

Open access
Yamane, Hidehiro, Zhu, Jinfang, Paul, William E.·2005·The Journal of Experimental Medicine

Abstract

T cell receptor (TCR) signaling plays an important role in early interleukin (IL)-4 production by naive CD4+ T cells. This "antigen-stimulated" early IL-4 is sufficient for in vitro Th2 differentiation. Here, we provide evidence that early IL-4 production by naive CD4+ T cells stimulated with cognate peptide requires TCR-induced early GATA-3 expression and IL-2 receptor signaling, both of which are controlled by the degree of activation of extracellular signal-regulated kinase (ERK). Stimulation of naive CD4+ T cells from TCR transgenic mice with low concentrations of peptide-induced IL-2-dependent STAT5 phosphorylation, IL-4-independent early GATA-3 expression, and IL-4 production. Neutralization of IL-2 abolished early IL-4 production without affecting early GATA-3 expression. In addition, naive CD4+ T cells from GATA-3 conditional KO mice failed to produce early IL-4 in response to TCR/CD28 stimulation. Stimulation with high concentrations of peptide abrogated early GATA-3 expression and IL-2-dependent STAT5 phosphorylation, and resulted in the failure to produce early IL-4. This high concentration-mediated suppression of early IL-4 production was reversed by blockade of the ERK pathway. A MEK inhibition rescued early GATA-3 expression and responsiveness to IL-2; these cells were now capable of producing early IL-4 and undergoing subsequent Th2 differentiation.

Overview

The claims and statistics of this paper haven’t been checked yet.

Run the check — free, no account needed. It reads the open-access text and checks the sources it cites.

A few free checks a day · papers already verified open instantly · results are public

Integrity signals

Registry

Crossref · 10.1084/jem.20051304

Cites

38 of 38 references verified0 citation errors · 0 not checkable

Statistics

Figures

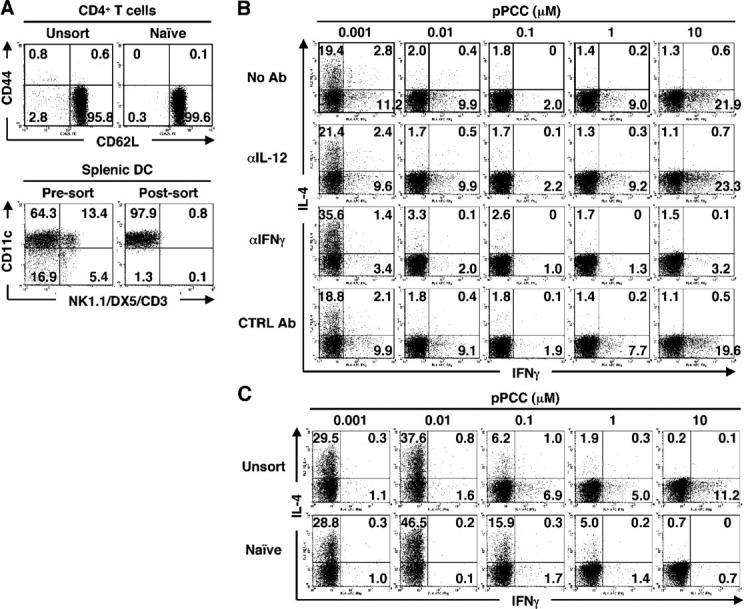
Figure 1. Peptide concentration regulates priming of naive CD4+T cells to develop into IL-4–producing cells. (A) Surface phenotypes of line 94 CD4+ T cells and of splenic DCs used for experiments. In this and in subsequent figures, the numbers in quadrants indicate the percent of cells in the given quadrant. (B) Naive line 94 CD4+ T cells were stimulated with splenic DCs and 0.001–10 μM pPCC in the presence or absence of anti–IL-12 (10 μg/ml), anti–IFN-γ (10 μg/ml), or rat IgG1 (10 μg/ml) plus rat IgG2a (10 μg/ml) as isotype controls. Intracellular staining for IL-4 and IFN-γ was performed. (C) Unsorted or naive line 94 CD4+ T cells were stimulated with P13.9 cells in the presence of 0.001–10 μM pPCC. Intracellular staining for IL-4 and IFN-γ was carried out after restimulation. All experiments were performed at least three times with consistent results.
Figure 1. Peptide concentration regulates priming of naive CD4+T cells to develop into IL-4–producing cells. (A) Surface phenotypes of line 94 CD4+ T cells and of splenic DCs used for experiments. In this and in subsequent figures, the numbers in quadrants indicate the percent of cells in the given quadrant. (B) Naive line 94 CD4+ T cells were stimulated with splenic DCs and 0.001–10 μM pPCC in the presence or absence of anti–IL-12 (10 μg/ml), anti–IFN-γ (10 μg/ml), or rat IgG1 (10 μg/ml) plus rat IgG2a (10 μg/ml) as isotype controls. Intracellular staining for IL-4 and IFN-γ was performed. (C) Unsorted or naive line 94 CD4+ T cells were stimulated with P13.9 cells in the presence of 0.001–10 μM pPCC. Intracellular staining for IL-4 and IFN-γ was carried out after restimulation. All experiments were performed at least three times with consistent results.CC BY-NC-SA · PubMed Central
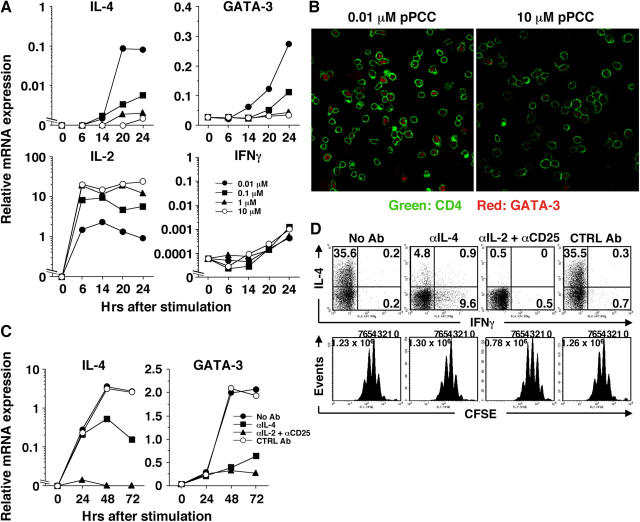
Figure 2. Peptide concentration-dependent inhibition of early IL-4 and GATA-3 mRNA expression. (A) Naive line 94 CD4+ T cells were stimulated with P13.9 cells in the presence of 0.001–10 μM of pPCC. Total RNA was harvested at indicated time points and relative mRNA levels for IL-4, GATA-3, IL-2, and IFN-γ were analyzed by real-time PCR. (B) Naive line 94 CD4+ T cells were stimulated with 0.01 or 10 μM pPCC on P13.9 cells. Cells were harvested 20 h after stimulation, and CD4 and GATA-3 were visualized by confocal microscopy. (C) Naive line 94 CD4+ T cells were stimulated with 0.01 μM pPCC on P13.9 cells in the presence or absence of anti–IL-4 (10 μg/ml), anti–IL-2 (10 μg/ml) plus anti-CD25 (10 μg/ml), or rat IgG1 (10 μg/ml) plus rat IgG2a (10 μg/ml) as isotype controls. Total RNA was harvested at indicated time points, and relative mRNA levels for IL-4 and GATA-3 were analyzed by a real-time PCR. (D) CFSE-labeled naive line 94 CD4+ T cells were stimulated as described in C. Intracellular IL-4 and IFN-γ were stained after restimulation. All experiments were carried out at least three times with consistent results.
Figure 2. Peptide concentration-dependent inhibition of early IL-4 and GATA-3 mRNA expression. (A) Naive line 94 CD4+ T cells were stimulated with P13.9 cells in the presence of 0.001–10 μM of pPCC. Total RNA was harvested at indicated time points and relative mRNA levels for IL-4, GATA-3, IL-2, and IFN-γ were analyzed by real-time PCR. (B) Naive line 94 CD4+ T cells were stimulated with 0.01 or 10 μM pPCC on P13.9 cells. Cells were harvested 20 h after stimulation, and CD4 and GATA-3 were visualized by confocal microscopy. (C) Naive line 94 CD4+ T cells were stimulated with 0.01 μM pPCC on P13.9 cells in the presence or absence of anti–IL-4 (10 μg/ml), anti–IL-2 (10 μg/ml) plus anti-CD25 (10 μg/ml), or rat IgG1 (10 μg/ml) plus rat IgG2a (10 μg/ml) as isotype controls. Total RNA was harvested at indicated time points, and relative mRNA levels for IL-4 and GATA-3 were analyzed by a real-time PCR. (D) CFSE-labeled naive line 94 CD4+ T cells were stimulated as described in C. Intracellular IL-4 and IFN-γ were stained after restimulation. All experiments were carried out at least three times with consistent results.CC BY-NC-SA · PubMed Central
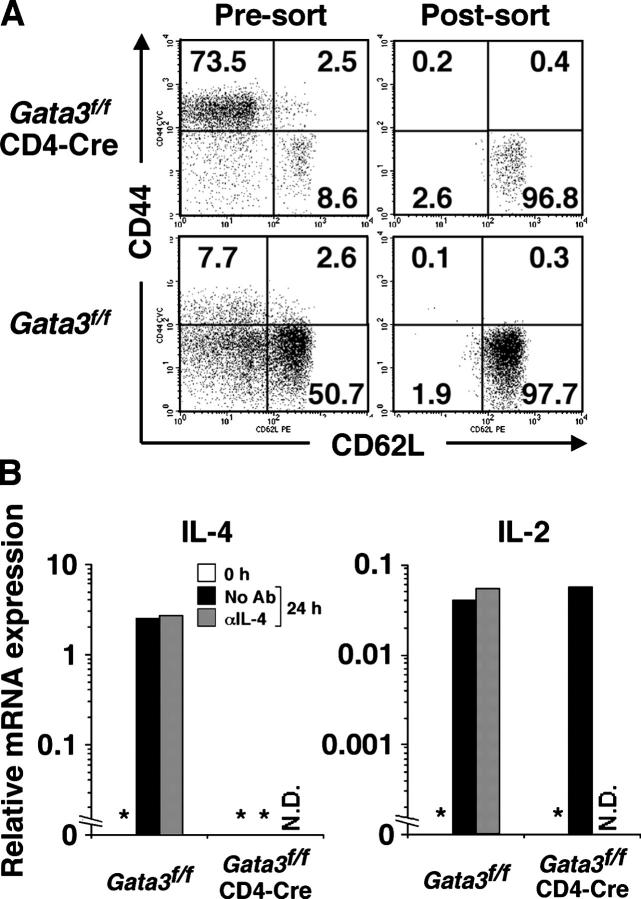
Figure 3. Naive CD4+ T cells lacking Gata3 gene fail to produce early IL-4. (A) CD44 and CD62L expression by unsorted and FACS-sorted CD4+ T cells from Gata3 f/f mice and Gata3 f/fCD4-Cre mice. (B) Naive CD4+ T cells from Gata3 f/f mice and Gata3 f/fCD4-Cre mice were stimulated with immobilized anti-CD3 (1 μg/ml) and anti-CD28 (3 μg/ml) in the presence or absence of 10 μg/ml anti–IL-4. Cells were harvested 24 h after stimulation and relative mRNA levels for IL-4 and IL-2 were measured by real-time PCR. *not detectable, N.D., not done. The experiment was performed twice with consistent results.
Figure 3. Naive CD4+ T cells lacking Gata3 gene fail to produce early IL-4. (A) CD44 and CD62L expression by unsorted and FACS-sorted CD4+ T cells from Gata3 f/f mice and Gata3 f/fCD4-Cre mice. (B) Naive CD4+ T cells from Gata3 f/f mice and Gata3 f/fCD4-Cre mice were stimulated with immobilized anti-CD3 (1 μg/ml) and anti-CD28 (3 μg/ml) in the presence or absence of 10 μg/ml anti–IL-4. Cells were harvested 24 h after stimulation and relative mRNA levels for IL-4 and IL-2 were measured by real-time PCR. *not detectable, N.D., not done. The experiment was performed twice with consistent results.CC BY-NC-SA · PubMed Central
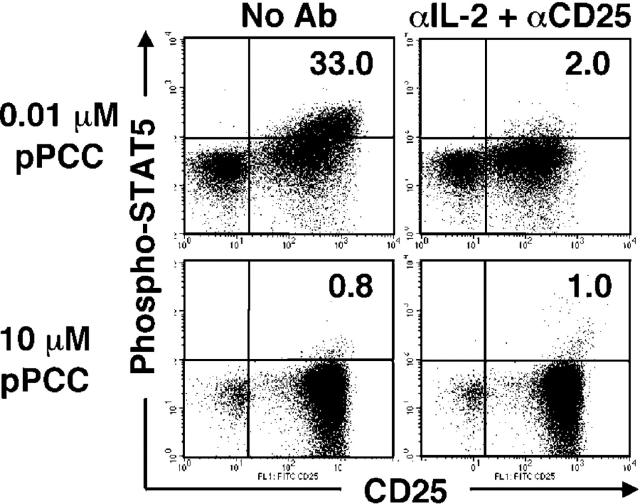
Figure 4 Stimulation with high concentrations of peptide renders T cells unresponsive to IL-2. Naive line 94 CD4+ T cells were stimulated with 0.01 or 10 μM pPCC on P13.9 cells in the presence or absence of anti–IL-2 (10 μg/ml) and anti-CD25 (10 μg/ml). Cells were harvested 24 h after stimulation; fixed; permeabilized; and then stained for CD4, CD25, and phospho-STAT5. The number in the upper right quadrant indicates the proportion of phospho-STAT5+ cells within CD25+ cells that arose as a result of activation. The experiment was performed three times with consistent results.
Figure 4 Stimulation with high concentrations of peptide renders T cells unresponsive to IL-2. Naive line 94 CD4+ T cells were stimulated with 0.01 or 10 μM pPCC on P13.9 cells in the presence or absence of anti–IL-2 (10 μg/ml) and anti-CD25 (10 μg/ml). Cells were harvested 24 h after stimulation; fixed; permeabilized; and then stained for CD4, CD25, and phospho-STAT5. The number in the upper right quadrant indicates the proportion of phospho-STAT5+ cells within CD25+ cells that arose as a result of activation. The experiment was performed three times with consistent results.CC BY-NC-SA · PubMed Central
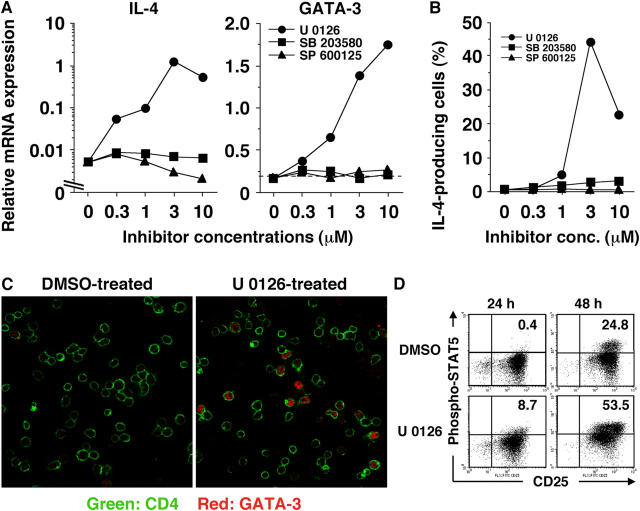
Figure 5. Activation of the ERK pathway is responsible for high peptide concentration–mediated suppression of IL-4 production. (A) Naive line 94 CD4+ T cells that were pretreated with different concentrations of U 0126, SB 203580, or SP 600125 were stimulated with P13.9 cells that had been preloaded with 10 μM pPCC. Cells were harvested 24 h after stimulation, and the relative mRNA levels for IL-4 and GATA-3 were measured by real-time PCR. (B) Naive line 94 CD4+ T cells were stimulated as described in A. Intracellular staining for IL-4 and IFN-γ was carried out after restimulation. (C) Naive line 94 CD4+ T cells were pretreated with U 0126 (3 μM) or DMSO and stimulated with P13.9 cells that were preloaded with 10 μM pPCC. Cells were harvested 20 h after stimulation, and CD4 and GATA-3 were visualized by confocal microscopy. (D) Naive line 94 CD4+ T cells were stimulated as in (C). Cells were harvested 24 and 48 h after stimulation; fixed; permeabilized; and then stained for CD4, CD25, and phospho-STAT5. The number in the upper right quadrant indicates the proportion of phospho-STAT5+ cells within CD25+ cells that arose as a result of activation. Quadrant location was determined based on the dot plot analysis for the cells that were stimulated in the presence of anti–IL-2 (10 μg/ml) and anti-CD25 (10 μg/ml). All experiments were carried out at least three times with consistent results.
Figure 5. Activation of the ERK pathway is responsible for high peptide concentration–mediated suppression of IL-4 production. (A) Naive line 94 CD4+ T cells that were pretreated with different concentrations of U 0126, SB 203580, or SP 600125 were stimulated with P13.9 cells that had been preloaded with 10 μM pPCC. Cells were harvested 24 h after stimulation, and the relative mRNA levels for IL-4 and GATA-3 were measured by real-time PCR. (B) Naive line 94 CD4+ T cells were stimulated as described in A. Intracellular staining for IL-4 and IFN-γ was carried out after restimulation. (C) Naive line 94 CD4+ T cells were pretreated with U 0126 (3 μM) or DMSO and stimulated with P13.9 cells that were preloaded with 10 μM pPCC. Cells were harvested 20 h after stimulation, and CD4 and GATA-3 were visualized by confocal microscopy. (D) Naive line 94 CD4+ T cells were stimulated as in (C). Cells were harvested 24 and 48 h after stimulation; fixed; permeabilized; and then stained for CD4, CD25, and phospho-STAT5. The number in the upper right quadrant indicates the proportion of phospho-STAT5+ cells within CD25+ cells that arose as a result of activation. Quadrant location was determined based on the dot plot analysis for the cells that were stimulated in the presence of anti–IL-2 (10 μg/ml) and anti-CD25 (10 μg/ml). All experiments were carried out at least three times with consistent results.CC BY-NC-SA · PubMed Central
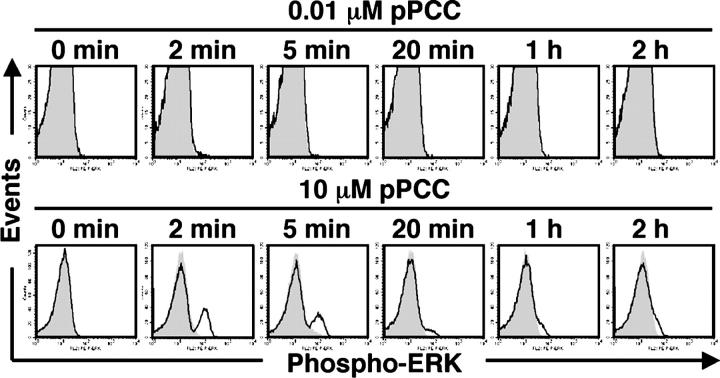
Figure 6 Intense phosphorylation of ERK induced by high concentrations of peptide. Line 94 CD4+ T cells were pretreated with U 0126 (3 μM) or DMSO and stimulated with P13.9 cells that were preloaded with 0.01 or 10 μM pPCC. Cells were fixed at indicated time points, and intracellular staining for phospho-ERK was performed. The levels of phospho-ERK in U 0126- and DMSO-pretreated cells are shown in shaded and open line graphs, respectively. The experiment was carried out three times with consistent results.
Figure 6 Intense phosphorylation of ERK induced by high concentrations of peptide. Line 94 CD4+ T cells were pretreated with U 0126 (3 μM) or DMSO and stimulated with P13.9 cells that were preloaded with 0.01 or 10 μM pPCC. Cells were fixed at indicated time points, and intracellular staining for phospho-ERK was performed. The levels of phospho-ERK in U 0126- and DMSO-pretreated cells are shown in shaded and open line graphs, respectively. The experiment was carried out three times with consistent results.CC BY-NC-SA · PubMed Central
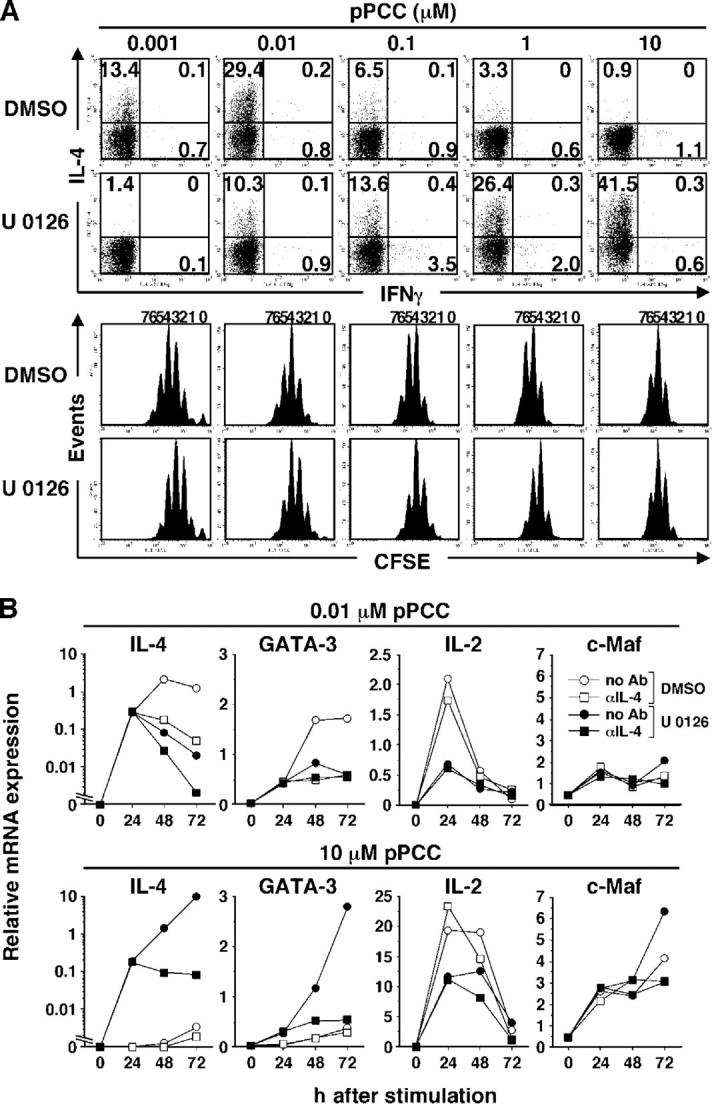
Figure 7. U 0126 allows IL-4 priming in response to high concentrations of pPCC but blocks such priming in response to low concentrations. (A) CFSE-labeled naive line 94 CD4+ T cells were pretreated with U 0126 (3 μM) or DMSO, and stimulated with P13.9 cells that were preloaded with 0.001–10 μM pPCC. Intracellular IL-4 and IFN-γ were stained after restimulation. (B) U 0126 (3 μM)- or DMSO-pretreated naive line 94 CD4+ T cells were stimulated with P13.9 cells that were preloaded with 0.01 or 10 μM pPCC in the presence or absence of 10 μg/ml anti–IL-4. Total RNA was isolated at indicated time points, and relative mRNA levels for IL-4, GATA-3, IL-2, and c-Maf were analyzed by real-time PCR. All experiments were carried out three times with consistent results.
Figure 7. U 0126 allows IL-4 priming in response to high concentrations of pPCC but blocks such priming in response to low concentrations. (A) CFSE-labeled naive line 94 CD4+ T cells were pretreated with U 0126 (3 μM) or DMSO, and stimulated with P13.9 cells that were preloaded with 0.001–10 μM pPCC. Intracellular IL-4 and IFN-γ were stained after restimulation. (B) U 0126 (3 μM)- or DMSO-pretreated naive line 94 CD4+ T cells were stimulated with P13.9 cells that were preloaded with 0.01 or 10 μM pPCC in the presence or absence of 10 μg/ml anti–IL-4. Total RNA was isolated at indicated time points, and relative mRNA levels for IL-4, GATA-3, IL-2, and c-Maf were analyzed by real-time PCR. All experiments were carried out three times with consistent results.CC BY-NC-SA · PubMed Central
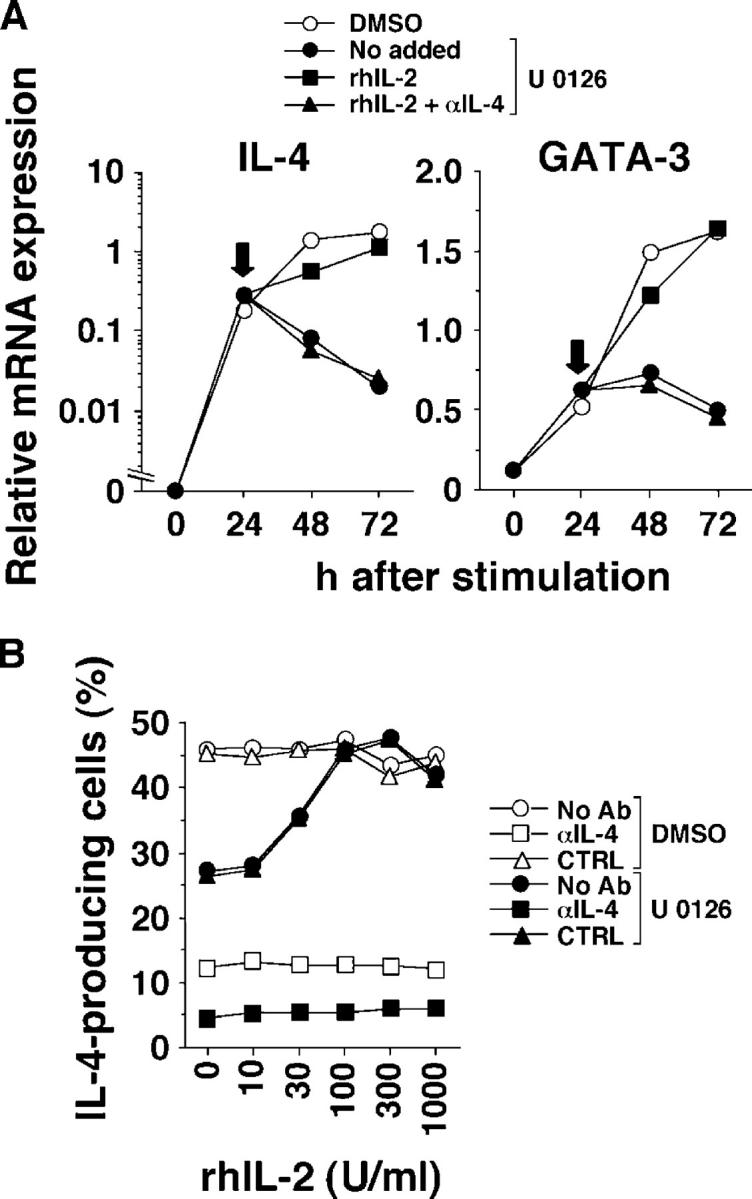
Figure 8. Exogenous IL-2 rescues U 0126-mediated suppression of Th2 priming at low peptide concentration. (A) U 0126 (3 μM)- or DMSO-pretreated naive line 94 CD4+ T cells were stimulated with P13.9 cells that were preloaded with 0.01 μM pPCC. At 24 h of stimulation (indicated by arrows), 100 U/ml rhIL-2 with or without 10 μg/ml anti–IL-4 were added to the cultures. Cells were harvested at indicated time points, and relative mRNA levels for IL-4 and GATA-3 were analyzed by real-time PCR. (B) Naive line 94 CD4+ T cells were stimulated as described in (A). Different concentrations of rhIL-2 with or without 10 μg/ml anti–IL-4 or rat IgG1 were added to the culture at 24 h. Intracellular IL-4 and IFN-γ were stained following restimulation. The frequency of IL-4–producing cells is shown. Both experiments were repeated three times with similar results.
Figure 8. Exogenous IL-2 rescues U 0126-mediated suppression of Th2 priming at low peptide concentration. (A) U 0126 (3 μM)- or DMSO-pretreated naive line 94 CD4+ T cells were stimulated with P13.9 cells that were preloaded with 0.01 μM pPCC. At 24 h of stimulation (indicated by arrows), 100 U/ml rhIL-2 with or without 10 μg/ml anti–IL-4 were added to the cultures. Cells were harvested at indicated time points, and relative mRNA levels for IL-4 and GATA-3 were analyzed by real-time PCR. (B) Naive line 94 CD4+ T cells were stimulated as described in (A). Different concentrations of rhIL-2 with or without 10 μg/ml anti–IL-4 or rat IgG1 were added to the culture at 24 h. Intracellular IL-4 and IFN-γ were stained following restimulation. The frequency of IL-4–producing cells is shown. Both experiments were repeated three times with similar results.CC BY-NC-SA · PubMed Central
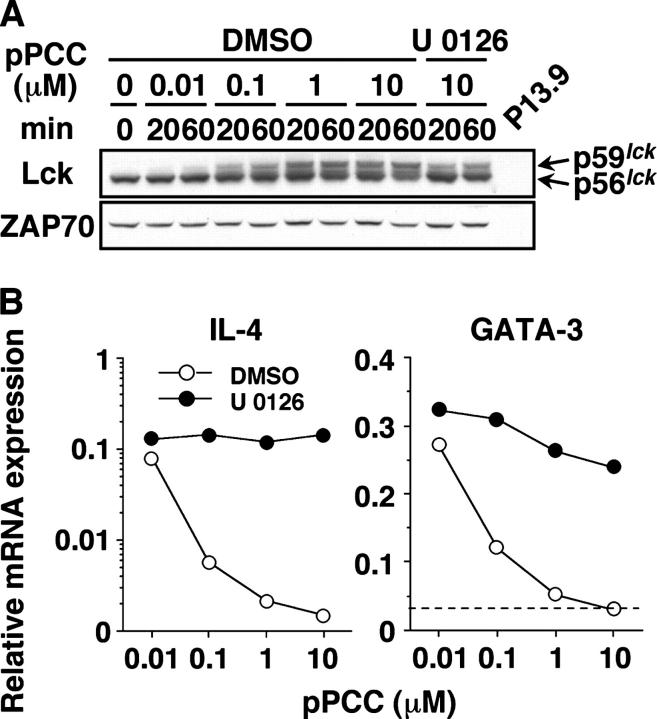
Figure 9. Diminution in TCR-induced Lck activation by blocking the ERK pathway does not account for the restoration of early IL-4 mRNA expression at high peptide concentration. (A) Whole cell lysates from DMSO-treated naive line 94 CD4+ T cells that had been stimulated with various concentrations of pPCC on P13.9 cells, or those that were pretreated with 3 μM U 0126 and stimulated with 10 μM pPCC, were analyzed for Lck by Western blot. Comparable levels of ZAP70 indicate the equal loading of each sample. (B) U 0126 (3 μM)- or DMSO-pretreated naive line 94 CD4+ T cells were stimulated with 0.01–10 μM pPCC on P13.9 cells. Total RNA was isolated 24 h after stimulation, and relative mRNA levels for IL-4 and GATA-3 were analyzed by real-time PCR. Both experiments were carried out three times with consistent results.
Figure 9. Diminution in TCR-induced Lck activation by blocking the ERK pathway does not account for the restoration of early IL-4 mRNA expression at high peptide concentration. (A) Whole cell lysates from DMSO-treated naive line 94 CD4+ T cells that had been stimulated with various concentrations of pPCC on P13.9 cells, or those that were pretreated with 3 μM U 0126 and stimulated with 10 μM pPCC, were analyzed for Lck by Western blot. Comparable levels of ZAP70 indicate the equal loading of each sample. (B) U 0126 (3 μM)- or DMSO-pretreated naive line 94 CD4+ T cells were stimulated with 0.01–10 μM pPCC on P13.9 cells. Total RNA was isolated 24 h after stimulation, and relative mRNA levels for IL-4 and GATA-3 were analyzed by real-time PCR. Both experiments were carried out three times with consistent results.CC BY-NC-SA · PubMed Central

Verification

Claims the paper makes

The claims and statistics of this paper haven’t been checked yet.

Run the check — free, no account needed. It reads the open-access text and checks the sources it cites.

A few free checks a day · papers already verified open instantly · results are public

Claims other papers make about this one

Each is checked against this paper’s own text: does it say what the citing paper says it does?

Self-check

Percentages, sums and reported differences re-computed from the paper’s own numbers.

The self-check needs the paper’s full text.

Citations

Cites

Show all 38 references

Research works printed but not linked: 1

  1. 2005, J. Clin. Invest., 115, 459, 10.1172/JCI200522462 · DOI

Cited by

Sorted by citations

See all 285

Metadata

Authors
Yamane, H., Zhu, J., & Paul, W. E.
Affiliations
National Institutes of Health (US)
Venue
The Journal of Experimental Medicine
Published
2005-09-19
Volume
202
Issue
6
Pages
793-804
ISSN
  • 0022-1007 (ISSN-L)
  • 1540-9538
OpenAlex
W2128181270
Cited by
285
References
38
Citations by year
2026: 3 · 2025: 7 · 2024: 10 · 2023: 11 · 2022: 11 · 2021: 15 · 2020: 8 · 2019: 10 · 2018: 13 · 2017: 18 · 2016: 13 · 2015: 18 · 2014: 28 · 2013: 16 · 2012: 19
FWCI
3.91
Type
journal article
Language
en
Open access
Locations
  • The Journal of Experimental Medicine (publishedVersion)
  • Europe PMC (PubMed Central) (publishedVersion, cc-by-nc-sa)
  • PubMed Central (publishedVersion, cc-by-nc-sa)
  • PubMed (publishedVersion)
Topics
  • Life Sciences › Immunology and Microbiology › Immunology › T-cell and B-cell Immunology
  • Life Sciences › Immunology and Microbiology › Immunology › Psoriasis: Treatment and Pathogenesis
  • Life Sciences › Immunology and Microbiology › Immunology › Cytokine Signaling Pathways and Interactions
Keywords
interleukin-2, GATA3, naive CD4+ T cells, Th2 differentiation, IL-4 production, T cell receptor signaling, ERK signaling, STAT5 phosphorylation, MEK inhibition, CD28 costimulation, TCR transgenic mice, cytokine environment
MeSH terms
Animals, Butadienes, Cells, Cultured, Dendritic Cells, DNA-Binding Proteins, Fluoresceins, Interferon-gamma, Interleukin-2, Lymphocyte Activation, Mice, Inbred A, Mice, Inbred C57BL, Mice, Transgenic, Milk Proteins, Nitriles, Peptides, Phosphorylation, RNA, Messenger, Succinimides, CD4-Positive T-Lymphocytes, Trans-Activators, Interleukin-4, Cytokines, Mice, Knockout, Th2 Cells, Coculture Techniques, MAP Kinase Kinase Kinases, STAT5 Transcription Factor, GATA3 Transcription Factor, Mice

About these checks

Registry, retraction, Cites and statistics results are computed, not judged, with one exception: a printed reference that no index lists is read once by a model before it counts as a citation error. Claims are extracted by a model and kept only when their quote appears verbatim in the text; each cited source is then checked, with a model’s help, for whether it says what the claim relies on. Those verdicts can be wrong — read the claim’s quote and the cited source before relying on one.

Statistics and arithmetic are recomputed, not judged.

Confidence bands are shown only for fields calibrated on our annotated test set. None is calibrated yet, so no band is shown.

What counts as a claim ›How we measure confidence ›How we check this ›

Are you an author, or do you see a problem with this page? Request a review