Cited by 176Cytokine Signaling Pathways and InteractionsRheumatoid Arthritis Research and TherapiesT-cell and B-cell Immunology

The DOI matches its Crossref record; 49 of the 49 references it cites were found in a registry or an index.

Autoimmune arthritis associated with mutated interleukin (IL)-6 receptor gp130 is driven by STAT3/IL-7-dependent homeostatic proliferation of CD4+ T cells

Open access

Abstract

Mice homozygous for the F759 mutation in the gp130 interleukin (IL)-6 receptor subunit have enhanced gp130-mediated signal transducer and activator of transcription (STAT)3 activation and spontaneously developed a lymphocyte-mediated rheumatoid arthritis-like joint disease. Here, we show that the development of the disease is dependent on both major histocompatibility complex (MHC) II–restricted CD4+ T cells and IL-6 family cytokines. In spite of the necessity for CD4+ T cells, the gp130 mutation was only required in nonhemtopoietic cells for the disease. The gp130 mutation resulted in enhanced production of IL-7. Conditional knockout of STAT3 in nonlymphoid cells showed that the enhancement of IL-7 production was dependent on STAT3 activation by IL-6 family cytokines. Homeostatic proliferation of CD4+ T cells was enhanced in gp130 mutant mice and acceleration of homeostatic proliferation enhanced the disease, whereas the inhibition of homeostatic proliferation suppressed the disease. Anti–IL-7 antibody treatment inhibited not only the enhanced homeostatic proliferation, but also the disease in gp130 mutant mice. Thus, our results show that autoimmune disease in gp130 mutant mice is caused by increased homeostatic proliferation of CD4+ T cells, which is due to elevated production of IL-7 by nonhematopoietic cells as a result of IL-6 family cytokine-gp130-STAT3 signaling.

Overview

The claims and statistics of this paper haven’t been checked yet.

Run the check — free, no account needed. It reads the open-access text and checks the sources it cites.

A few free checks a day · papers already verified open instantly · results are public

Integrity signals

Registry

Crossref · 10.1084/jem.20052187

Cites

49 of 49 references verified0 citation errors · 0 not checkable

Statistics

Figures

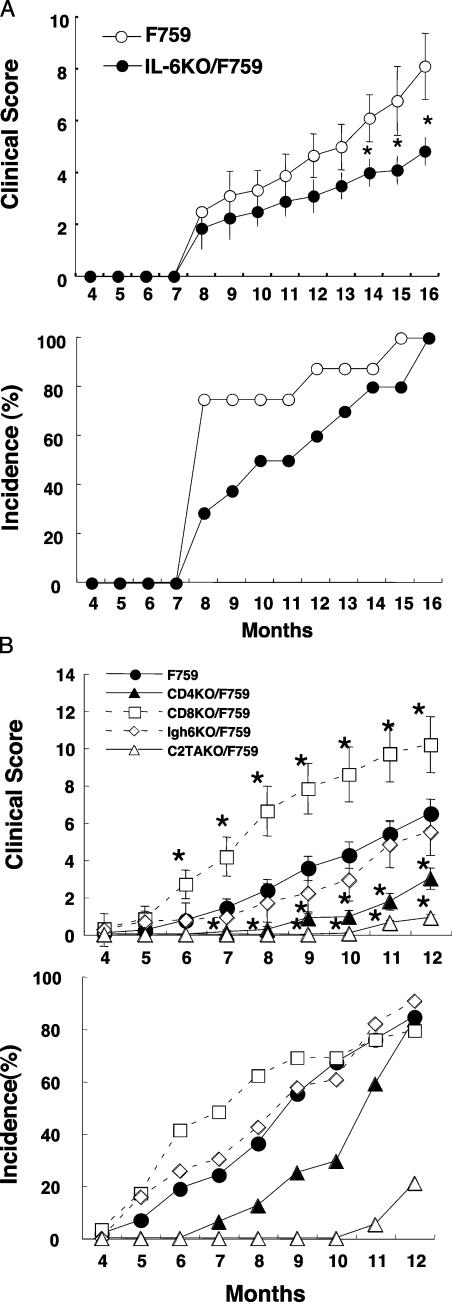
Figure 1. The arthritis of F759 is dependent on IL-6 and MHCII-restricted CD4+ T cells. (A) Clinical score and incidence of arthritis in IL-6KO/F759 (closed circles, n = 10) and IL-6KO hetero/F759 or F759 (open circles, n = 10). (top) Data are the mean ± SEM of the arthritis scores. (bottom) Incidence of arthritis with a score >4.0. The p-value was calculated by Student's t test. Clinical scores of 14–16-mo-old IL-6KO/F759 were significantly lower than the control. (*, P < 0.05) (B) Clinical scores and incidences of arthritis in Igh6KO/F759 (open diamonds, n = 25), CD8KO/F759 (open squares, n = 30), CD4KO/F759 (closed triangles, n = 21), C2TAKO/F759 (open triangles, n = 19), and F759 (closed circles, n = 80). (top) Data are the mean ± SEM of the arthritis scores. (bottom) Incidence of arthritis with a score >2.0. Clinical scores of 6-12-mo-old CD8KO/F759 were significantly higher (*, P < 0.05). Scores of 5–12-mo-old CD4KO/F759 and C2TAKO/F759 were significantly lower. (*, P < 0.05).
Figure 1. The arthritis of F759 is dependent on IL-6 and MHCII-restricted CD4+ T cells. (A) Clinical score and incidence of arthritis in IL-6KO/F759 (closed circles, n = 10) and IL-6KO hetero/F759 or F759 (open circles, n = 10). (top) Data are the mean ± SEM of the arthritis scores. (bottom) Incidence of arthritis with a score >4.0. The p-value was calculated by Student's t test. Clinical scores of 14–16-mo-old IL-6KO/F759 were significantly lower than the control. (*, P < 0.05) (B) Clinical scores and incidences of arthritis in Igh6KO/F759 (open diamonds, n = 25), CD8KO/F759 (open squares, n = 30), CD4KO/F759 (closed triangles, n = 21), C2TAKO/F759 (open triangles, n = 19), and F759 (closed circles, n = 80). (top) Data are the mean ± SEM of the arthritis scores. (bottom) Incidence of arthritis with a score >2.0. Clinical scores of 6-12-mo-old CD8KO/F759 were significantly higher (*, P < 0.05). Scores of 5–12-mo-old CD4KO/F759 and C2TAKO/F759 were significantly lower. (*, P < 0.05).CC BY-NC-SA · PubMed Central
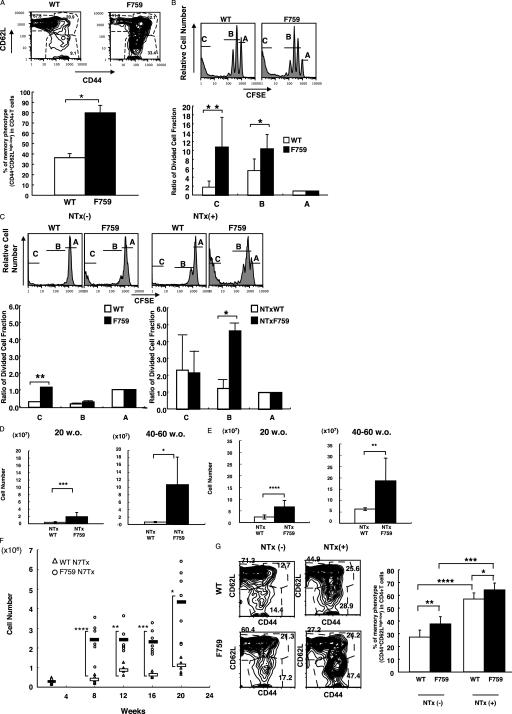
Figure 2. Increase in CD44highCD4+ T cells, lymphadenopathy, splenomegaly, and enhanced homeostatic proliferation in the periphery of F759. (A) FACS profiles of CD4+ T cells isolated from sLNs of F759 and control mice (8–10 mo old). These experiments were performed three times independently; representative data are shown. The percentage of CD44highCD4+ T cells (CD62Lhigh and CD62Llow) is shown with error bars indicating 1 SD. The p-value was calculated by Student's t test (*, P = 0.0000025). (B) CD44lowCD4+ T cells were sorted from C57BL/6/SJL mice, labeled with CFSE, and injected into irradiated wild type or C57BL/6/F759. FACS profiles of the CD45.1+CD4+T cells in the sLNs and spleen are shown. These experiments were performed five times independently and representative data are shown. The relative amount of CFSEhigh (most slowly dividing [A]), CFSEmiddle [B], and CFSElow (most rapidly dividing [C]) cells, with the value for CFSEhigh defined as 1, is shown with error bars indicating 1 SD. The p-value was calculated by Student's t test (*, P = 0.00037 and **, P = 0.000002). (C) CD44lowCD4+ T cells from C57BL/6/SJL were CFSE labeled and injected into nonthymectomized and N7Txed C57BL/6 or C57BL/6/F759 neonates. FACS profiles of CD45.1+CD4+ T cells from the sLNs and spleen are shown. These experiments were performed three times independently and representative data are shown. The relative amount of CFSEhigh (A), CFSEmiddle (B), and CFSElow (C) cells, with the value for CFSEhigh defined as 1, is shown with error bars indicating 1 SD. The p-value was calculated by Student's t test (*, P = 0.0017 and **, P = 0.0008). (D and E) The sLNs (D) and spleen (E) were from and the total cell numbers were calculated. The mean is shown with error bars indicating 1 SD. The p-value was calculated by Student's t test (*, P = 0.0042; **, P = 0.0038; ***, P = 0.00034; and ****, P = 0.00027). (F) The sLNs and spleen were harvested from NT7xed C57BL/6 and C56BL/6/F759. The numbers of CD4+ T cells were calculated from FACS analyses (open circles; N7Txed F759 and open triangles; N7Txed wild type). The mean is shown as open (N7Txed wild type) and closed (N7Txed F759) bars. The p-value was calculated by Student's t test (*, P = 0.0065; **, P = 0.0068; ***, P = 0.00034; and ****, P = 0.00021). (G) Neonatal thymectomy increased the CD44high memory/activated CD4+ T cells in the spleen of NTx F759. FACS profiles of CD4+ T cells isolated from the spleen of N7Txed or sham-N7Txed F759 and wild-type mice (2 wk old). These experiments were performed twice independently (total 12 samples each) and representative data are shown. The percentage of CD44highCD4+ T cells (CD62Lhigh and CD62Llow) is shown with error bars indicating 1 SD. The p-value was calculated by Student's t test (*, P = 0.024; **, P = 0.0032; ***, P = 0.00000039; and ****, P = 0.0000002).
Figure 2. Increase in CD44highCD4+ T cells, lymphadenopathy, splenomegaly, and enhanced homeostatic proliferation in the periphery of F759. (A) FACS profiles of CD4+ T cells isolated from sLNs of F759 and control mice (8–10 mo old). These experiments were performed three times independently; representative data are shown. The percentage of CD44highCD4+ T cells (CD62Lhigh and CD62Llow) is shown with error bars indicating 1 SD. The p-value was calculated by Student's t test (*, P = 0.0000025). (B) CD44lowCD4+ T cells were sorted from C57BL/6/SJL mice, labeled with CFSE, and injected into irradiated wild type or C57BL/6/F759. FACS profiles of the CD45.1+CD4+T cells in the sLNs and spleen are shown. These experiments were performed five times independently and representative data are shown. The relative amount of CFSEhigh (most slowly dividing [A]), CFSEmiddle [B], and CFSElow (most rapidly dividing [C]) cells, with the value for CFSEhigh defined as 1, is shown with error bars indicating 1 SD. The p-value was calculated by Student's t test (*, P = 0.00037 and **, P = 0.000002). (C) CD44lowCD4+ T cells from C57BL/6/SJL were CFSE labeled and injected into nonthymectomized and N7Txed C57BL/6 or C57BL/6/F759 neonates. FACS profiles of CD45.1+CD4+ T cells from the sLNs and spleen are shown. These experiments were performed three times independently and representative data are shown. The relative amount of CFSEhigh (A), CFSEmiddle (B), and CFSElow (C) cells, with the value for CFSEhigh defined as 1, is shown with error bars indicating 1 SD. The p-value was calculated by Student's t test (*, P = 0.0017 and **, P = 0.0008). (D and E) The sLNs (D) and spleen (E) were from and the total cell numbers were calculated. The mean is shown with error bars indicating 1 SD. The p-value was calculated by Student's t test (*, P = 0.0042; **, P = 0.0038; ***, P = 0.00034; and ****, P = 0.00027). (F) The sLNs and spleen were harvested from NT7xed C57BL/6 and C56BL/6/F759. The numbers of CD4+ T cells were calculated from FACS analyses (open circles; N7Txed F759 and open triangles; N7Txed wild type). The mean is shown as open (N7Txed wild type) and closed (N7Txed F759) bars. The p-value was calculated by Student's t test (*, P = 0.0065; **, P = 0.0068; ***, P = 0.00034; and ****, P = 0.00021). (G) Neonatal thymectomy increased the CD44high memory/activated CD4+ T cells in the spleen of NTx F759. FACS profiles of CD4+ T cells isolated from the spleen of N7Txed or sham-N7Txed F759 and wild-type mice (2 wk old). These experiments were performed twice independently (total 12 samples each) and representative data are shown. The percentage of CD44highCD4+ T cells (CD62Lhigh and CD62Llow) is shown with error bars indicating 1 SD. The p-value was calculated by Student's t test (*, P = 0.024; **, P = 0.0032; ***, P = 0.00000039; and ****, P = 0.0000002).CC BY-NC-SA · PubMed Central
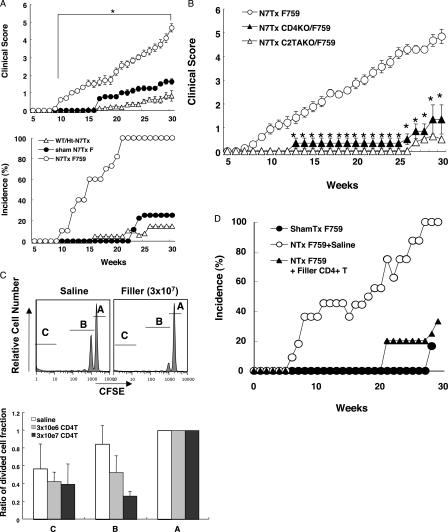
Figure 3. CD4+ T cell homeostatic proliferation played a critical role for the disease development in F759. (A) Clinical score and incidence of arthritis in N7Txed F759 (open circles, n = 30), F759 hetero or N7Txed wild-type (open triangles, n = 24), and sham-Txed F759 (closed circles, n = 20). (top) Data are the means ± SEM of the arthritis scores. (bottom) Incidence of arthritis with a score >2.0. Clinical scores of 10–30-wk-old N7TxF759 were significantly higher than the sham N7Tx ones (*, P < 0.05). (B) Data are the means ± SEM of the arthritis score in N7Txed F759 (open circles, n = 12), N7Txed CD4KO/F759 (closed triangles, n = 12), and N7Txed C2TAKO/F759 (open triangles, n = 12). Clinical scores of N7Txed CD4KO/F759 and N7Txed C2TAKO/F759 (13–30 wk old) were significantly milder than N7Txed F759 ones (*, P < 0.05). (C) CD44lowCD4+ T cells from C57BL/6/SJL were labeled with CFSE and injected i.v. with or without filler T cells injected i.p. into N7Txed C57BL/6/F759 neonates. FACS profiles of CD45.1+CD4+ T cells from sLNs and spleen are shown. These experiments were performed three times independently and representative data are shown. The relative amount of CFSEhigh (A), CFSEmiddle (B), and CFSElow (C) cells, with the value for CFSEhigh defined as 1, is shown with error bars indicating 1 SD. (D) Incidence of arthritis with a score >2.0 in N7Txed F759 plus saline (open circles, n = 14), N7Txed F759 plus i.p. injection of filler T cells (closed triangles, n = 14) and sham-N7Txed F759 (closed circles, n = 15).
Figure 3. CD4+ T cell homeostatic proliferation played a critical role for the disease development in F759. (A) Clinical score and incidence of arthritis in N7Txed F759 (open circles, n = 30), F759 hetero or N7Txed wild-type (open triangles, n = 24), and sham-Txed F759 (closed circles, n = 20). (top) Data are the means ± SEM of the arthritis scores. (bottom) Incidence of arthritis with a score >2.0. Clinical scores of 10–30-wk-old N7TxF759 were significantly higher than the sham N7Tx ones (*, P < 0.05). (B) Data are the means ± SEM of the arthritis score in N7Txed F759 (open circles, n = 12), N7Txed CD4KO/F759 (closed triangles, n = 12), and N7Txed C2TAKO/F759 (open triangles, n = 12). Clinical scores of N7Txed CD4KO/F759 and N7Txed C2TAKO/F759 (13–30 wk old) were significantly milder than N7Txed F759 ones (*, P < 0.05). (C) CD44lowCD4+ T cells from C57BL/6/SJL were labeled with CFSE and injected i.v. with or without filler T cells injected i.p. into N7Txed C57BL/6/F759 neonates. FACS profiles of CD45.1+CD4+ T cells from sLNs and spleen are shown. These experiments were performed three times independently and representative data are shown. The relative amount of CFSEhigh (A), CFSEmiddle (B), and CFSElow (C) cells, with the value for CFSEhigh defined as 1, is shown with error bars indicating 1 SD. (D) Incidence of arthritis with a score >2.0 in N7Txed F759 plus saline (open circles, n = 14), N7Txed F759 plus i.p. injection of filler T cells (closed triangles, n = 14) and sham-N7Txed F759 (closed circles, n = 15).CC BY-NC-SA · PubMed Central
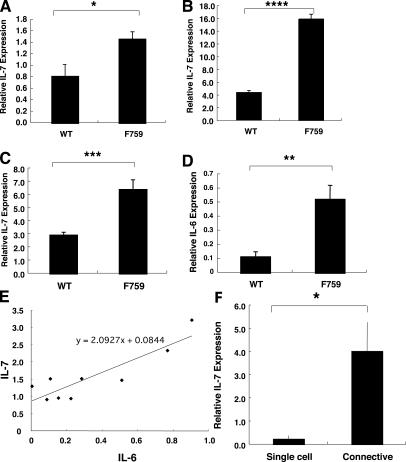
Figure 4. Increased IL-7 expression in nonhematopoietic cells in F759. (A) The sLNs were harvested from wild-type C57BL/6 and C57BL/6/F759. Real-time PCR for IL-7 was performed. (B) The sLNs were harvested from wild-type C57BL/6 and C57BL/6/F759 10 d after irradiation. Real-time PCR was performed for IL-7. (C and D) The sLNs were harvested from N7Txed wild-type C57BL/6 and C57BL/6/F759 10 d after N7Tx. Real-time PCR was performed for IL-7 (C) and IL-6 (D). The mean is shown with error bars indicating 1 SD. The p-value was calculated by Student's t test (*, P = 0.0021; **, P = 0.011; ***, P = 0.00041; and ****, P = 0.000000003). These experiments were performed three times independently and representative data are shown. (E) The correlation between relative IL-7 and IL-6 expression in N7Txed wild-type or F759 is shown. The correlation efficiency was 0.88. (F) The sLNs were harvested from C57BL/6/F759. The cell strainer pass-through and the retained fractions were prepared. Real-time PCR was performed for IL-7. The mean is shown with error bars indicating 1 SD. The p-value was calculated by Student's t test (*, P = 0.0021). These experiments were performed three times independently and representative data are shown.
Figure 4. Increased IL-7 expression in nonhematopoietic cells in F759. (A) The sLNs were harvested from wild-type C57BL/6 and C57BL/6/F759. Real-time PCR for IL-7 was performed. (B) The sLNs were harvested from wild-type C57BL/6 and C57BL/6/F759 10 d after irradiation. Real-time PCR was performed for IL-7. (C and D) The sLNs were harvested from N7Txed wild-type C57BL/6 and C57BL/6/F759 10 d after N7Tx. Real-time PCR was performed for IL-7 (C) and IL-6 (D). The mean is shown with error bars indicating 1 SD. The p-value was calculated by Student's t test (*, P = 0.0021; **, P = 0.011; ***, P = 0.00041; and ****, P = 0.000000003). These experiments were performed three times independently and representative data are shown. (E) The correlation between relative IL-7 and IL-6 expression in N7Txed wild-type or F759 is shown. The correlation efficiency was 0.88. (F) The sLNs were harvested from C57BL/6/F759. The cell strainer pass-through and the retained fractions were prepared. Real-time PCR was performed for IL-7. The mean is shown with error bars indicating 1 SD. The p-value was calculated by Student's t test (*, P = 0.0021). These experiments were performed three times independently and representative data are shown.CC BY-NC-SA · PubMed Central
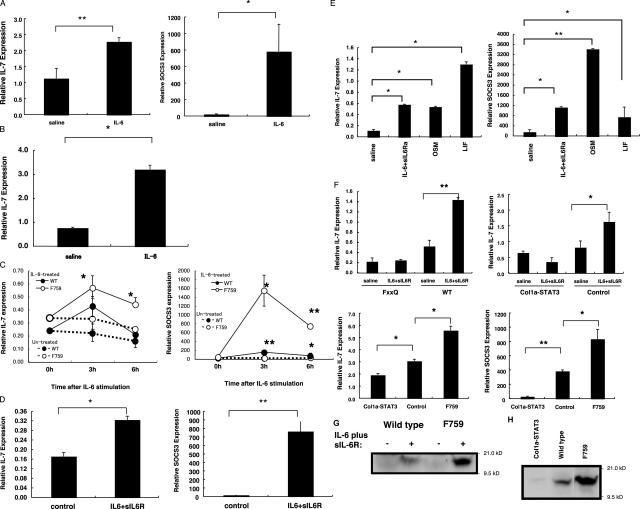
Figure 5. IL-6 injection induced IL-7 in vivo and gp130-STAT3 directly induced IL-7 in the fibroblasts of F759. (A) IL-6KO/F759 (nonirradiated) with i.v. injection IL-6 was prepared. Real-time PCR for IL-7 or SOCS3 was performed using RNA from the sLNs of the IL-6KO/F759. These experiments were performed two times independently and the sum of the data is shown. (B) IL-6 KO mice with irradiation 24 h before the i.v. injection of IL-6 was prepared. Real-time PCR for IL-7 was performed using RNA from the sLNs. These experiments were performed three times independently and representative data are shown. The p-value was calculated by Student's t test (in A: *, P = 0.034; **, P = 0.018). In B, *, P = 0.016. (C) Splenic fibroblasts were prepared and stimulated with IL-6. Real-time PCR was performed for IL-7 and SOCS3. The mean is shown with error bars indicating 1 SD. Student's t test was done between IL-6–treated and untreated cells. The p-value was calculated by Student's t test (*, P < 0.05 and **, P < 0.01). These experiments were performed three times independently and representative data are shown. (D) Splenic fibroblasts prepared from wild-type neonates were stimulated with IL-6 plus sIL-6R. Real-time PCR was performed for IL-7 and SOCS3. The mean is shown with error bars indicating 1 SD. The p-value was calculated by Student's t test (*, P = 0.010 and **, P = 0.014). These experiments were performed three times independently and representative data are shown. (E) Splenic fibroblasts from F759 were stimulated with IL-6 plus sIL-6R, OSM, and LIF. Real-time PCR was performed for IL-7 and SOCS3. The mean is shown with error bars indicating 1 SD. The p-value was calculated by Student's t test (*, P < 0.05 and **, P < 0.01). These experiments were performed three times independently and representative data are shown. (F, top left) MEF were prepared from FxxQ or wild-type fetus were stimulated with IL-6 plus sIL-6R. Real-time PCR was performed for IL-7. The mean is shown with error bars indicating 1 SD. The p-value was calculated by Student's t test (**, P < 0.01). These experiments were performed three times independently and representative data are shown. (top right) Col1a-STAT3, control (STAT3flox/flox or type I-collagen-Cre/STAT3flox/+), and F759 were irradiated, and the sLNs were harvested and cultured with IL-6 plus sIL-6R. Real-time PCR for IL-7 was performed using sLNs. The mean is shown with error bars indicating 1 SD. The p-value was calculated by Student's t test (*, P < 0.05). These experiments were performed three times independently and representative data are shown. (bottom) Col1a-STAT3, control, and F759 were irradiated. Real-time PCR for IL-7 or SOCS3 was performed using the lymph nodes. The mean is shown with error bars indicating 1 SD. The p-value was calculated by Student's t test (*, P < 0.05; **, P < 0.01). These experiments were performed three times independently and representative data are shown. (G) MEF were prepared from F759 or wild-type fetus were stimulated with IL-6 plus sIL-6R. Their protein fractions were prepared and applied on SDS-page followed by Western blotting of IL-7. (H) The sLNs irradiated Col1a-STAT3, wild-type, and F759 were harvested. Their protein fractions were prepared and applied on SDS-page followed by Western blotting of IL-7.
Figure 5. IL-6 injection induced IL-7 in vivo and gp130-STAT3 directly induced IL-7 in the fibroblasts of F759. (A) IL-6KO/F759 (nonirradiated) with i.v. injection IL-6 was prepared. Real-time PCR for IL-7 or SOCS3 was performed using RNA from the sLNs of the IL-6KO/F759. These experiments were performed two times independently and the sum of the data is shown. (B) IL-6 KO mice with irradiation 24 h before the i.v. injection of IL-6 was prepared. Real-time PCR for IL-7 was performed using RNA from the sLNs. These experiments were performed three times independently and representative data are shown. The p-value was calculated by Student's t test (in A: *, P = 0.034; **, P = 0.018). In B, *, P = 0.016. (C) Splenic fibroblasts were prepared and stimulated with IL-6. Real-time PCR was performed for IL-7 and SOCS3. The mean is shown with error bars indicating 1 SD. Student's t test was done between IL-6–treated and untreated cells. The p-value was calculated by Student's t test (*, P < 0.05 and **, P < 0.01). These experiments were performed three times independently and representative data are shown. (D) Splenic fibroblasts prepared from wild-type neonates were stimulated with IL-6 plus sIL-6R. Real-time PCR was performed for IL-7 and SOCS3. The mean is shown with error bars indicating 1 SD. The p-value was calculated by Student's t test (*, P = 0.010 and **, P = 0.014). These experiments were performed three times independently and representative data are shown. (E) Splenic fibroblasts from F759 were stimulated with IL-6 plus sIL-6R, OSM, and LIF. Real-time PCR was performed for IL-7 and SOCS3. The mean is shown with error bars indicating 1 SD. The p-value was calculated by Student's t test (*, P < 0.05 and **, P < 0.01). These experiments were performed three times independently and representative data are shown. (F, top left) MEF were prepared from FxxQ or wild-type fetus were stimulated with IL-6 plus sIL-6R. Real-time PCR was performed for IL-7. The mean is shown with error bars indicating 1 SD. The p-value was calculated by Student's t test (**, P < 0.01). These experiments were performed three times independently and representative data are shown. (top right) Col1a-STAT3, control (STAT3flox/flox or type I-collagen-Cre/STAT3flox/+), and F759 were irradiated, and the sLNs were harvested and cultured with IL-6 plus sIL-6R. Real-time PCR for IL-7 was performed using sLNs. The mean is shown with error bars indicating 1 SD. The p-value was calculated by Student's t test (*, P < 0.05). These experiments were performed three times independently and representative data are shown. (bottom) Col1a-STAT3, control, and F759 were irradiated. Real-time PCR for IL-7 or SOCS3 was performed using the lymph nodes. The mean is shown with error bars indicating 1 SD. The p-value was calculated by Student's t test (*, P < 0.05; **, P < 0.01). These experiments were performed three times independently and representative data are shown. (G) MEF were prepared from F759 or wild-type fetus were stimulated with IL-6 plus sIL-6R. Their protein fractions were prepared and applied on SDS-page followed by Western blotting of IL-7. (H) The sLNs irradiated Col1a-STAT3, wild-type, and F759 were harvested. Their protein fractions were prepared and applied on SDS-page followed by Western blotting of IL-7.CC BY-NC-SA · PubMed Central
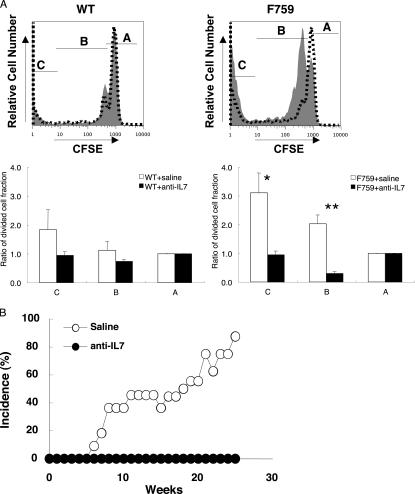
Figure 6. IL-7 expression was involved in the enhanced CD4+ T cell HP and was necessary for development of the disease in F759 neonates. (A) CD44lowCD4+ T cells were sorted from C57BL/6/SJL mice, labeled with CFSE, and injected into N7Txed C57BL/6 or C57BL/6/F759 neonates 8 d after birth. Anti–IL-7 antibody (dotted lines) or control IgG2b antibody (shaded profiles, 0.1 mg/each) was i.p. injected. The sLNs and spleen were harvested 14 d after T cell injection and FACS profiles of CD45.1+CD4+ T cells are shown. These experiments were performed three times independently and representative data are shown. The relative amount of CFSEhigh (A), CFSEmiddle (B), and CFSElow (C) cells, with the value for CFSEhigh defined as 1, is shown with error bars indicating 1 SD. The p-value was calculated by Student's t test (*; P = 0.012; **, P = 0.00023). (B) Incidence of arthritis with a score >2.0 in N7Txed F759 plus saline (open circles) or N7Txed F759 plus anti–IL-7 antibody (closed circles).
Figure 6. IL-7 expression was involved in the enhanced CD4+ T cell HP and was necessary for development of the disease in F759 neonates. (A) CD44lowCD4+ T cells were sorted from C57BL/6/SJL mice, labeled with CFSE, and injected into N7Txed C57BL/6 or C57BL/6/F759 neonates 8 d after birth. Anti–IL-7 antibody (dotted lines) or control IgG2b antibody (shaded profiles, 0.1 mg/each) was i.p. injected. The sLNs and spleen were harvested 14 d after T cell injection and FACS profiles of CD45.1+CD4+ T cells are shown. These experiments were performed three times independently and representative data are shown. The relative amount of CFSEhigh (A), CFSEmiddle (B), and CFSElow (C) cells, with the value for CFSEhigh defined as 1, is shown with error bars indicating 1 SD. The p-value was calculated by Student's t test (*; P = 0.012; **, P = 0.00023). (B) Incidence of arthritis with a score >2.0 in N7Txed F759 plus saline (open circles) or N7Txed F759 plus anti–IL-7 antibody (closed circles).CC BY-NC-SA · PubMed Central

Verification

Claims the paper makes

The claims and statistics of this paper haven’t been checked yet.

Run the check — free, no account needed. It reads the open-access text and checks the sources it cites.

A few free checks a day · papers already verified open instantly · results are public

Claims other papers make about this one

Each is checked against this paper’s own text: does it say what the citing paper says it does?

Self-check

Percentages, sums and reported differences re-computed from the paper’s own numbers.

The self-check needs the paper’s full text.

Citations

Cites

Show all 49 references

Research works printed but not linked: 3

  1. 2004, J. Clin. Invest., 114, 582, 10.1172/JCI200421795 · DOI
  2. 2003, Nat. Immunol., 4, 891
  3. 2004, Blood., 104, 2794

Cited by

Sorted by citations

See all 176

Metadata

Authors
Sawa, S.-I., Kamimura, D., Jin, G.-H., Morikawa, H., Kamon, H., Nishihara, M., Ishihara, K., Murakami, M., & Hirano, T.
Affiliations
  • 1Laboratory of Developmental Immunology, Graduate School of Frontier Bioscience and Graduate School of Medicine, Osaka University, Osaka 565-0871, Japan
  • RIKEN (JP)
  • The University of Osaka (JP)
Venue
The Journal of Experimental Medicine
Published
2006-05-22
Volume
203
Issue
6
Pages
1459-1470
ISSN
  • 0022-1007 (ISSN-L)
  • 1540-9538
OpenAlex
W2133947803
Cited by
176
References
49
Citations by year
2026: 7 · 2025: 4 · 2024: 3 · 2023: 5 · 2022: 6 · 2021: 4 · 2020: 3 · 2019: 7 · 2018: 7 · 2017: 8 · 2016: 6 · 2015: 16 · 2014: 8 · 2013: 9 · 2012: 19
FWCI
6.43
Type
journal article
Language
en
Open access
Locations
  • The Journal of Experimental Medicine (publishedVersion)
  • Europe PMC (PubMed Central) (publishedVersion, cc-by-nc-sa)
  • PubMed Central (publishedVersion, cc-by-nc-sa)
  • PubMed (publishedVersion)
Funders
Ministry of Education, Culture, Sports, Science and Technology
Topics
  • Life Sciences › Immunology and Microbiology › Immunology › Cytokine Signaling Pathways and Interactions
  • Health Sciences › Medicine › Rheumatology › Rheumatoid Arthritis Research and Therapies
  • Life Sciences › Immunology and Microbiology › Immunology › T-cell and B-cell Immunology
Keywords
autoimmune arthritis, gp130, IL-6 receptor, STAT3, IL-7, IL-6 family cytokines, MHC class II-restricted T cells, non-hematopoietic cells
MeSH terms
Animals, Arthritis, Autoimmune Diseases, Disease Models, Animal, Flow Cytometry, Homeostasis, Homozygote, Humans, Lymphocyte Activation, Mice, Inbred C57BL, Mutation, Thymectomy, CD4-Positive T-Lymphocytes, Interleukin-7, STAT3 Transcription Factor, Cytokine Receptor gp130, Mice

About these checks

Registry, retraction, Cites and statistics results are computed, not judged, with one exception: a printed reference that no index lists is read once by a model before it counts as a citation error. Claims are extracted by a model and kept only when their quote appears verbatim in the text; each cited source is then checked, with a model’s help, for whether it says what the claim relies on. Those verdicts can be wrong — read the claim’s quote and the cited source before relying on one.

Statistics and arithmetic are recomputed, not judged.

Confidence bands are shown only for fields calibrated on our annotated test set. None is calibrated yet, so no band is shown.

What counts as a claim ›How we measure confidence ›How we check this ›

Are you an author, or do you see a problem with this page? Request a review