Cited by 120

The DOI matches its Crossref record; 1 of the 1 references it cites were found in a registry or an index.

Myosin IIA is required for cytolytic granule exocytosis in human NK cells

Andzelm, Milena M., Chen, Xi, Krzewski, Konrad, Orange, Jordan S., Strominger, Jack L.·2007·The Journal of Experimental Medicine

Abstract

Natural killer (NK) cell cytotoxicity involves the formation of an activating immunological synapse (IS) between the effector and target cell through which granzymes and perforin contained in lytic granules are delivered to the target cell via exocytosis. Inhibition of nonmuscle myosin II in human NK cells with blebbistatin or ML-9 impaired neither effector–target cell conjugation nor formation of a mature activating NK cell IS (NKIS; formation of an actin ring and polarization of the microtubule-organizing center and cytolytic granules to the center of the ring). However, membrane fusion of lytic granules, granzyme secretion, and NK cell cytotoxicity were all effectively blocked. Specific knockdown of the myosin IIA heavy chain by RNA interference impaired cytotoxicity, membrane fusion of lytic granules, and granzyme secretion. Thus, myosin IIA is required for a critical step between NKIS formation and granule exocytosis.

Overview

The claims and statistics of this paper haven’t been checked yet.

Run the check — free, no account needed. It reads the open-access text and checks the sources it cites.

A few free checks a day · papers already verified open instantly · results are public

Integrity signals

Registry

Crossref · 10.1084/jem.20071143

Cites

1 of 1 references verified0 citation errors · 0 not checkable

Statistics

Figures

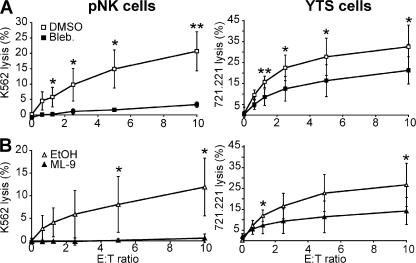
Figure 1. Inhibition of myosin II blocks NK cell cytotoxicity. pNK cells and YTS cells were pretreated with inhibitors, and their killing ability was assayed using 51Cr release from K562 or 721.221 target cells, respectively. DMSO was used as a solvent for blebbistatin (Bleb; A) and EtOH was used as a solvent for ML-9 (B), and they are the control curves for their respective inhibitors. Both solvents showed nonspecific effects on cytotoxicity. Specifically, at an E/T ratio of 10:1 DMSO at the concentration used reduced killing of pNK cells by 18% and of YTS cells by 0%, whereas EtOH at the concentration used reduced killing of pNK cells by 52% and of YTS cells by 15%. Each curve represents the mean ± the SD of three independent experiments. *, P < 0.05 and **, P < 0.01 by Student's t test.
Figure 1. Inhibition of myosin II blocks NK cell cytotoxicity. pNK cells and YTS cells were pretreated with inhibitors, and their killing ability was assayed using 51Cr release from K562 or 721.221 target cells, respectively. DMSO was used as a solvent for blebbistatin (Bleb; A) and EtOH was used as a solvent for ML-9 (B), and they are the control curves for their respective inhibitors. Both solvents showed nonspecific effects on cytotoxicity. Specifically, at an E/T ratio of 10:1 DMSO at the concentration used reduced killing of pNK cells by 18% and of YTS cells by 0%, whereas EtOH at the concentration used reduced killing of pNK cells by 52% and of YTS cells by 15%. Each curve represents the mean ± the SD of three independent experiments. *, P < 0.05 and **, P < 0.01 by Student's t test.CC BY-NC-SA · PubMed Central
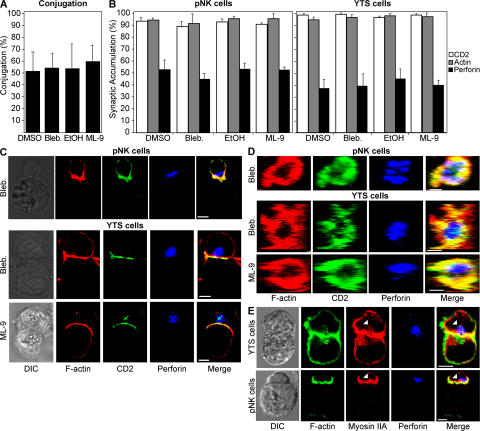
Figure 2. Myosin II inhibition does not affect conjugation or mature lytic synapse formation. (A) YTS-GFP cells were incubated with 721.221-RFP cells, and conjugation was quantified by FACS. Conjugates were defined as the percentage of GFP, RFP double-positive events measured by FACS compared with those seen with YTS-GFP cells alone. (B) The accumulation of F-actin, perforin, and CD2-GFP (YTS cells) or CD2-FITC (pNK cells) at the IS of an effector–target conjugate pair was evaluated for 50 conjugates in each experiment. Values are expressed as the percentage of synapses at which fluorescence was accumulated. Bar graphs represent the mean ± the SD of three independent experiments. (C) pNK cells are shown conjugated with K562 cells (top), and YTS-CD2-GFP cells are shown conjugated with 721.221 cells (bottom). NK cells are the top cells and target cells are the bottom cells in the conjugate pair. Differential interference contrast images are in the left column and fluorescent images are in the right columns. A merged overlay of all fluorescent channels is in the fifth column. (D) Representative lytic synapses were evaluated throughout their volume, and the z, x plane was reconstructed. The first row shows a lytic synapse in a pNK cell conjugated with a K562 cell. The bottom two rows show lytic synapses between YTS-CD2-GFP cells and 721.221 cells. The final column is a merged overlay of the fluorescent channels from the first three columns. The different inhibitor treatment for each row is indicated on the left of both C and D. In the case of both C and D, vehicle control images were identical in each case to those where NK cells were treated with inhibitors (solvent control for C and D are found in Fig. S1). (E) Myosin IIA colocalizes with F-actin and perforin. Representative conjugate pairs of both a YTS cell and a 721.221 target cell (top), as well as a pNK cell with a K562 cell (bottom) are shown, in the same format as C. Myosin II is found to associate with F-actin, as well as granules (white arrowhead). Bars, 5 μm.
Figure 2. Myosin II inhibition does not affect conjugation or mature lytic synapse formation. (A) YTS-GFP cells were incubated with 721.221-RFP cells, and conjugation was quantified by FACS. Conjugates were defined as the percentage of GFP, RFP double-positive events measured by FACS compared with those seen with YTS-GFP cells alone. (B) The accumulation of F-actin, perforin, and CD2-GFP (YTS cells) or CD2-FITC (pNK cells) at the IS of an effector–target conjugate pair was evaluated for 50 conjugates in each experiment. Values are expressed as the percentage of synapses at which fluorescence was accumulated. Bar graphs represent the mean ± the SD of three independent experiments. (C) pNK cells are shown conjugated with K562 cells (top), and YTS-CD2-GFP cells are shown conjugated with 721.221 cells (bottom). NK cells are the top cells and target cells are the bottom cells in the conjugate pair. Differential interference contrast images are in the left column and fluorescent images are in the right columns. A merged overlay of all fluorescent channels is in the fifth column. (D) Representative lytic synapses were evaluated throughout their volume, and the z, x plane was reconstructed. The first row shows a lytic synapse in a pNK cell conjugated with a K562 cell. The bottom two rows show lytic synapses between YTS-CD2-GFP cells and 721.221 cells. The final column is a merged overlay of the fluorescent channels from the first three columns. The different inhibitor treatment for each row is indicated on the left of both C and D. In the case of both C and D, vehicle control images were identical in each case to those where NK cells were treated with inhibitors (solvent control for C and D are found in Fig. S1). (E) Myosin IIA colocalizes with F-actin and perforin. Representative conjugate pairs of both a YTS cell and a 721.221 target cell (top), as well as a pNK cell with a K562 cell (bottom) are shown, in the same format as C. Myosin II is found to associate with F-actin, as well as granules (white arrowhead). Bars, 5 μm.CC BY-NC-SA · PubMed Central
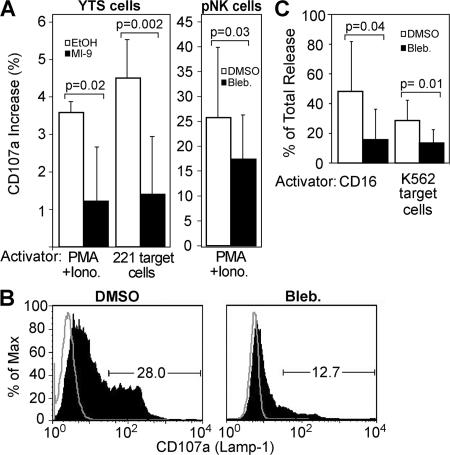
Figure 3. Myosin II inhibitors block lytic granule exocytosis. (A) pNK and YTS cells were activated with either their respective target cells or PMA and ionomycin (Iono). The percentage of increase in CD107a surface expression was evaluated by FACS and expressed as the increase over identically treated (including with appropriate inhibitors) unstimulated cells. Thus, unstimulated cells were used as a baseline to account for any nonspecific stimulation of antibody endocytosis or granule exocytosis over the incubation time, as well as any antibody endocytosis nonspecifically induced by cell treatment. Unstimulated cells also accounted for any potential shifts in fluorescence caused by drug color. Bar graphs represent the mean ± the SD of three independent experiments. (B) A representative histogram of CD107a surface expression from pNK cells stimulated with PMA/ionomycin ± blebbistatin. The percentage of pNK cells expressing a high level of CD107a was gated, and values are shown on the graph. The percentage of Max indicates the number of events at each given fluorescence intensity, where the intensity with the greatest number of cells has been normalized to be 100%. (C) pNK cells were stimulated by plate-bound anti-CD16 or K562 target cells, and their supernatant was used in a serine esterase assay. Results are expressed as a percentage of total release from cells pretreated with inhibitors or appropriate controls to account for possible background effects on the colorimetric assay caused by either intrinsic compound color or direct effects on serine esterase activity. Bar graphs represent the mean ± the SD of four to five independent experiments. Paired and unpaired Student's t tests were performed to obtain P values.
Figure 3. Myosin II inhibitors block lytic granule exocytosis. (A) pNK and YTS cells were activated with either their respective target cells or PMA and ionomycin (Iono). The percentage of increase in CD107a surface expression was evaluated by FACS and expressed as the increase over identically treated (including with appropriate inhibitors) unstimulated cells. Thus, unstimulated cells were used as a baseline to account for any nonspecific stimulation of antibody endocytosis or granule exocytosis over the incubation time, as well as any antibody endocytosis nonspecifically induced by cell treatment. Unstimulated cells also accounted for any potential shifts in fluorescence caused by drug color. Bar graphs represent the mean ± the SD of three independent experiments. (B) A representative histogram of CD107a surface expression from pNK cells stimulated with PMA/ionomycin ± blebbistatin. The percentage of pNK cells expressing a high level of CD107a was gated, and values are shown on the graph. The percentage of Max indicates the number of events at each given fluorescence intensity, where the intensity with the greatest number of cells has been normalized to be 100%. (C) pNK cells were stimulated by plate-bound anti-CD16 or K562 target cells, and their supernatant was used in a serine esterase assay. Results are expressed as a percentage of total release from cells pretreated with inhibitors or appropriate controls to account for possible background effects on the colorimetric assay caused by either intrinsic compound color or direct effects on serine esterase activity. Bar graphs represent the mean ± the SD of four to five independent experiments. Paired and unpaired Student's t tests were performed to obtain P values.CC BY-NC-SA · PubMed Central
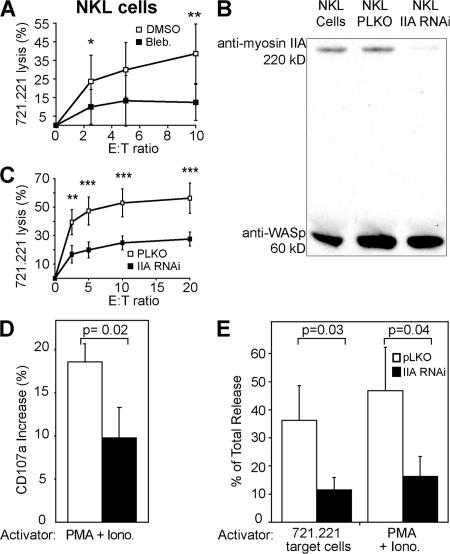
Figure 4. Knockdown of myosin IIA in NKL cells impairs cytotoxicity and granule exocytosis. (A) NKL cells were pretreated with blebbistatin, and killing ability was assayed using 51Cr release from 721.221 target cells. (B) Relative protein levels were assessed after RNAi of myosin IIA by Western blot with WASp content as the control. (C) Killing ability of NKL cells with myosin IIA knockdown was assayed using the same 51Cr release assay. NKL cells infected with the pLKO vector only were used as a control. *, P < 0.1, **, P < 0.04, and **, P < 0.02 by Student's t test for both graphs. (D) The percentage of increase in CD107a surface expression was evaluated by FACS and expressed as the increase over identically treated cells, but with no stimulation by PMA and ionomycin (Iono). (E) NKL cells were stimulated by PMA and ionomycin or 721.221 target cells, and their supernatant was used in a serine esterase assay. Results are expressed as a percentage of total release. All data represent the mean ± the SD of three independent experiments. Unpaired Student's t tests were performed to obtain P values.
Figure 4. Knockdown of myosin IIA in NKL cells impairs cytotoxicity and granule exocytosis. (A) NKL cells were pretreated with blebbistatin, and killing ability was assayed using 51Cr release from 721.221 target cells. (B) Relative protein levels were assessed after RNAi of myosin IIA by Western blot with WASp content as the control. (C) Killing ability of NKL cells with myosin IIA knockdown was assayed using the same 51Cr release assay. NKL cells infected with the pLKO vector only were used as a control. *, P < 0.1, **, P < 0.04, and **, P < 0.02 by Student's t test for both graphs. (D) The percentage of increase in CD107a surface expression was evaluated by FACS and expressed as the increase over identically treated cells, but with no stimulation by PMA and ionomycin (Iono). (E) NKL cells were stimulated by PMA and ionomycin or 721.221 target cells, and their supernatant was used in a serine esterase assay. Results are expressed as a percentage of total release. All data represent the mean ± the SD of three independent experiments. Unpaired Student's t tests were performed to obtain P values.CC BY-NC-SA · PubMed Central

Verification

Claims the paper makes

The claims and statistics of this paper haven’t been checked yet.

Run the check — free, no account needed. It reads the open-access text and checks the sources it cites.

A few free checks a day · papers already verified open instantly · results are public

Claims other papers make about this one

Each is checked against this paper’s own text: does it say what the citing paper says it does?

Self-check

Percentages, sums and reported differences re-computed from the paper’s own numbers.

The self-check needs the paper’s full text.

Citations

Cites

Research works printed but not linked: 26

  1. 2003, Proc. Natl. Acad. Sci. USA., 100, 7767, 10.1073/pnas.1336920100 · DOI
  2. 2003, Proc. Natl. Acad. Sci. USA., 100, 14151, 10.1073/pnas.1835830100 · DOI
  3. 2005, Proc. Natl. Acad. Sci. USA., 102, 15563, 10.1073/pnas.0507835102 · DOI
  4. 2000, Biochim. Biophys. Acta., 1496, 3, 10.1016/S0167-4889(00)00005-7 · DOI
  5. 1998, Science., 282, 2266, 10.1126/science.282.5397.2266 · DOI
  6. 2002, J. Muscle Res. Cell Motil., 23, 305, 10.1023/A:1022047102064 · DOI
  7. 2003, Science., 299, 1743, 10.1126/science.1081412 · DOI · Paper page
  8. 2004, Nat. Immunol., 5, 531
  9. 1989, Int. J. Immunopharmacol., 11, 185, 10.1016/0192-0561(89)90070-2 · DOI
  10. 2006, J. Cell Biol., 173, 121, 10.1083/jcb.200509076 · DOI
  11. 2002, Proc. Natl. Acad. Sci. USA., 99, 11351, 10.1073/pnas.162376099 · DOI
  12. 2005, Trends Cell Biol., 15, 644, 10.1016/j.tcb.2005.10.003 · DOI
  13. 2005, Blood., 106, 577
  14. 2002, Neurochem. Res., 27, 1305, 10.1023/A:1021615530960 · DOI
  15. 2000, Nat. Immunol., 1, 23, 10.1038/76877 · DOI
  16. 2004, J. Immunol. Methods., 294, 15, 10.1016/j.jim.2004.08.008 · DOI
  17. 1992, J. Leukoc. Biol., 52, 483, 10.1002/jlb.52.5.483 · DOI
  18. 2005, J. Exp. Med., 202, 1001, 10.1084/jem.20051143 · DOI · Paper page
  19. 2004, Mol. Biol. Cell., 15, 688, 10.1091/mbc.e03-06-0430 · DOI
  20. 2004, J. Biol. Chem., 279, 27450, 10.1074/jbc.M311462200 · DOI
  21. 1995, J. Physiol. (Paris)., 89, 83, 10.1016/0928-4257(96)80555-9 · DOI
  22. 1994, J. Neurosci., 14, 7695, 10.1523/JNEUROSCI.14-12-07695.1994 · DOI
  23. 2001, J. Cell Biol., 152, 825, 10.1083/jcb.152.4.825 · DOI
  24. 2003, Cell., 115, 461, 10.1016/S0092-8674(03)00855-9 · DOI
  25. 2006, Blood., 108, 2316
  26. 1996, Exp. Hematol., 24, 406

Cited by

See all 120

Metadata

Authors
Andzelm, M. M., Chen, X., Krzewski, K., Orange, J. S., & Strominger, J. L.
Affiliations
1Department of Molecular and Cellular Biology, Harvard University, Cambridge, MA 02138
Venue
The Journal of Experimental Medicine
Published
2007-09-17
Volume
204
Issue
10
Pages
2285-2291
ISSN
  • 1540-9538
  • 0022-1007
Cited by
120
References
1
Language
en

About these checks

Registry, retraction, Cites and statistics results are computed, not judged, with one exception: a printed reference that no index lists is read once by a model before it counts as a citation error. Claims are extracted by a model and kept only when their quote appears verbatim in the text; each cited source is then checked, with a model’s help, for whether it says what the claim relies on. Those verdicts can be wrong — read the claim’s quote and the cited source before relying on one.

Statistics and arithmetic are recomputed, not judged.

Confidence bands are shown only for fields calibrated on our annotated test set. None is calibrated yet, so no band is shown.

What counts as a claim ›How we measure confidence ›How we check this ›

Are you an author, or do you see a problem with this page? Request a review