Cited by 411

The DOI matches its Crossref record; 1 of the 1 references it cites were found in a registry or an index.

In vivo switch to IL-10–secreting T regulatory cells in high dose allergen exposure

Meiler, Flurina, Zumkehr, Judith, Klunker, Sven, Rückert, Beate, Akdis, Cezmi A., Akdis, Mübeccel·2008·The Journal of Experimental Medicine

Abstract

High dose bee venom exposure in beekeepers by natural bee stings represents a model to understand mechanisms of T cell tolerance to allergens in healthy individuals. Continuous exposure of nonallergic beekeepers to high doses of bee venom antigens induces diminished T cell–related cutaneous late-phase swelling to bee stings in parallel with suppressed allergen-specific T cell proliferation and T helper type 1 (Th1) and Th2 cytokine secretion. After multiple bee stings, venom antigen–specific Th1 and Th2 cells show a switch toward interleukin (IL) 10–secreting type 1 T regulatory (Tr1) cells. T cell regulation continues as long as antigen exposure persists and returns to initial levels within 2 to 3 mo after bee stings. Histamine receptor 2 up-regulated on specific Th2 cells displays a dual effect by directly suppressing allergen-stimulated T cells and increasing IL-10 production. In addition, cytotoxic T lymphocyte–associated antigen 4 and programmed death 1 play roles in allergen-specific T cell suppression. In contrast to its role in mucosal allergen tolerance, transforming growth factor β does not seem to be an essential player in skin-related allergen tolerance. Thus, rapid switch and expansion of IL-10–producing Tr1 cells and the use of multiple suppressive factors represent essential mechanisms in immune tolerance to a high dose of allergens in nonallergic individuals.

Overview

The claims and statistics of this paper haven’t been checked yet.

Run the check — free, no account needed. It reads the open-access text and checks the sources it cites.

A few free checks a day · papers already verified open instantly · results are public

Integrity signals

Registry

Crossref · 10.1084/jem.20080193

Cites

1 of 1 references verified0 citation errors · 0 not checkable

Statistics

Figures

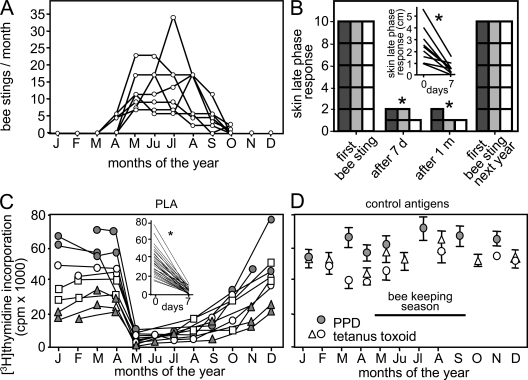
Figure 1. Decreased antigen-specific T cell response and cutaneous late-phase response after natural high dose antigen exposure. (A) The number of bee stings per month in nine beekeepers is. (B) Decreased cutaneous late-phase response after bee stings returns to initial levels upon no exposure. Five beekeepers who showed large cutaneous late-phase responses at the beginning of each beekeeping season were followed for 3 yr (2003–2005). The lesion size was graded as follows: 2, >3 cm; 1, 0–3 cm; and 0, no swelling (dark gray bar, 2003; gray bar, 2004; open bar, 2005). The scale of 10 demonstrates that in all of the five beekeepers, the skin lesion size was >3 cm at the beginning of each season. (inset) The direct measurement of cutaneous late-phase response lesion size in nine beekeepers in 2007 before and 7 d after bee stings. (C) PLA-induced [3H]thymidine incorporation in PBMCs after 5 d in two beekeepers followed for three years (gray circles and triangles) and two beekeepers followed for two consecutive years (open squares and circles; 67 peripheral blood samples). (inset) PLA-induced [3H]thymidine incorporation significantly decreased in all 29 experiments before and 7 d after bee stings between 2001 and 2007. (D) T cell proliferation against control antigens (PPD and TT) did not show any change in three beekeepers throughout the year. *, P < 0.001.
Figure 1. Decreased antigen-specific T cell response and cutaneous late-phase response after natural high dose antigen exposure. (A) The number of bee stings per month in nine beekeepers is. (B) Decreased cutaneous late-phase response after bee stings returns to initial levels upon no exposure. Five beekeepers who showed large cutaneous late-phase responses at the beginning of each beekeeping season were followed for 3 yr (2003–2005). The lesion size was graded as follows: 2, >3 cm; 1, 0–3 cm; and 0, no swelling (dark gray bar, 2003; gray bar, 2004; open bar, 2005). The scale of 10 demonstrates that in all of the five beekeepers, the skin lesion size was >3 cm at the beginning of each season. (inset) The direct measurement of cutaneous late-phase response lesion size in nine beekeepers in 2007 before and 7 d after bee stings. (C) PLA-induced [3H]thymidine incorporation in PBMCs after 5 d in two beekeepers followed for three years (gray circles and triangles) and two beekeepers followed for two consecutive years (open squares and circles; 67 peripheral blood samples). (inset) PLA-induced [3H]thymidine incorporation significantly decreased in all 29 experiments before and 7 d after bee stings between 2001 and 2007. (D) T cell proliferation against control antigens (PPD and TT) did not show any change in three beekeepers throughout the year. *, P < 0.001.CC BY-NC-SA · PubMed Central
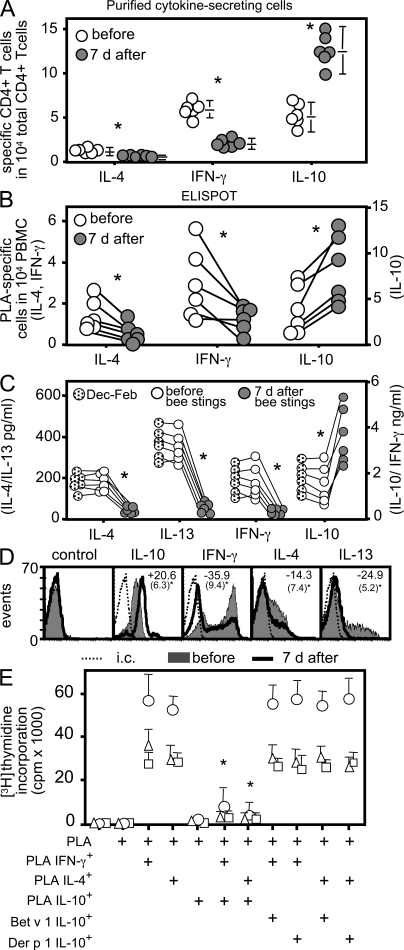
Figure 2. Increased allergen-specific Tr1 cells and decreased Th1 and Th2 cells after bee stings. (A) PLA-specific IL-4–, IL-10–, and IFN-γ–secreting CD4+ T cells were purified 12 h after PLA stimulation, and their frequencies were calculated in six beekeepers before the beginning of beekeeping season and after 7 d. They received an average of 13 bee stings. Data are expressed as means + SEM. (B) Frequency of PLA-stimulated cytokine-secreting cells in six beekeepers by ELISPOT assay. (C) Secreted cytokines in PLA-stimulated PBMC cultures were measured by ELISA (IL-4 after 24 h, and IL-13, IFN-γ, and IL-10 after 5 d). (D) PBMCs from beekeepers were stimulated with PLA for 10 d, and intracytoplasmic cytokines were determined 12 h after anti-CD2/-CD3/-CD28 mAb stimulation. The mean percent difference (standard deviations are in parentheses) of eight experiments is shown before and 7 d after multiple bee stings inside each histogram. (E) PLA-specific IL-4–, IL-10–, and IFN-γ–secreting and Der p 1– and Bet v 1–specific IL-10–secreting T cells were purified from beekeepers after multiple bee stings. Their frequency was calculated in CD4+ T cells, and PBMCs were immediately reconstituted by increasing their frequency in cultures by 10 times. Cells were stimulated with PLA, and [3H]thymidine incorporation was determined after 5 d. Three experiments are shown. Data are expressed as means + SEM. *, P < 0.001. i.c., intracutaneous.
Figure 2. Increased allergen-specific Tr1 cells and decreased Th1 and Th2 cells after bee stings. (A) PLA-specific IL-4–, IL-10–, and IFN-γ–secreting CD4+ T cells were purified 12 h after PLA stimulation, and their frequencies were calculated in six beekeepers before the beginning of beekeeping season and after 7 d. They received an average of 13 bee stings. Data are expressed as means + SEM. (B) Frequency of PLA-stimulated cytokine-secreting cells in six beekeepers by ELISPOT assay. (C) Secreted cytokines in PLA-stimulated PBMC cultures were measured by ELISA (IL-4 after 24 h, and IL-13, IFN-γ, and IL-10 after 5 d). (D) PBMCs from beekeepers were stimulated with PLA for 10 d, and intracytoplasmic cytokines were determined 12 h after anti-CD2/-CD3/-CD28 mAb stimulation. The mean percent difference (standard deviations are in parentheses) of eight experiments is shown before and 7 d after multiple bee stings inside each histogram. (E) PLA-specific IL-4–, IL-10–, and IFN-γ–secreting and Der p 1– and Bet v 1–specific IL-10–secreting T cells were purified from beekeepers after multiple bee stings. Their frequency was calculated in CD4+ T cells, and PBMCs were immediately reconstituted by increasing their frequency in cultures by 10 times. Cells were stimulated with PLA, and [3H]thymidine incorporation was determined after 5 d. Three experiments are shown. Data are expressed as means + SEM. *, P < 0.001. i.c., intracutaneous.CC BY-NC-SA · PubMed Central
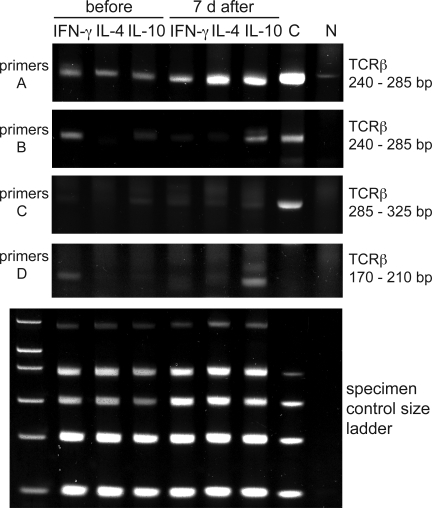
Figure 3. Clonality and switch to IL-10–secreting T cells after bee stings. TCRVβ gene clonality was analyzed in PLA-specific IL-4–, IL-10–, and IFN-γ–secreting T cells before and 7 d after multiple bee stings. A clonal sample (C) and a nonclonal sample (N) were included as controls. The PCR products of three different test tubes were run on three different gels, and a band that results from a clonal sample appears in a range from 240 to 285 bp (primers A, tube 1), from 240 to 285 bp (primers B, tube 2), and from 285 to 325 bp and from 170 to 210 bp (primers C and D, tube 3). The specimen control size ladder master mix generates a series of amplicons to ensure that the quality and quantity of input DNA were sufficient for the test. Heteroduplex analysis of the PCR products (except for the specimen control size ladder) on 6% TBE polyacrylamide gels stained with ethidium bromide is shown. One representative out of three experiments is shown.
Figure 3. Clonality and switch to IL-10–secreting T cells after bee stings. TCRVβ gene clonality was analyzed in PLA-specific IL-4–, IL-10–, and IFN-γ–secreting T cells before and 7 d after multiple bee stings. A clonal sample (C) and a nonclonal sample (N) were included as controls. The PCR products of three different test tubes were run on three different gels, and a band that results from a clonal sample appears in a range from 240 to 285 bp (primers A, tube 1), from 240 to 285 bp (primers B, tube 2), and from 285 to 325 bp and from 170 to 210 bp (primers C and D, tube 3). The specimen control size ladder master mix generates a series of amplicons to ensure that the quality and quantity of input DNA were sufficient for the test. Heteroduplex analysis of the PCR products (except for the specimen control size ladder) on 6% TBE polyacrylamide gels stained with ethidium bromide is shown. One representative out of three experiments is shown.CC BY-NC-SA · PubMed Central
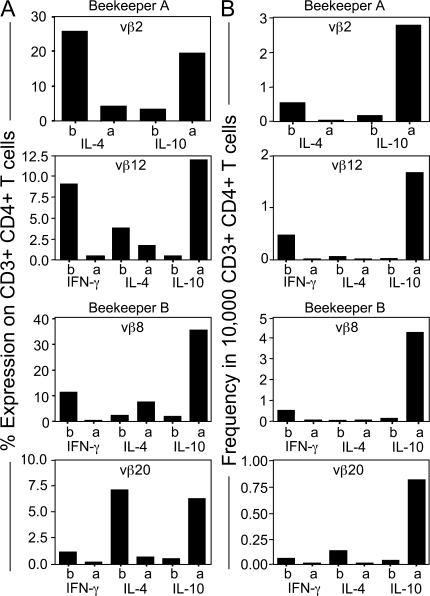
Figure 4. PLA-specific CD4+ IL-4– and IFN-γ–secreting CD4+ T cells switch to IL-10–secreting T cells. (A) Two beekeepers were analyzed for TCRVβ chain expression in purified PLA-specific IL-4–, IL-10–, and IFN-γ–secreting T cells by gating CD3+CD4+ T cells by flow cytometry. (B) PLA-specific IL-10–, IFN-γ–, and IL-4–secreting T cells were purified from two beekeepers before and 7 d after multiple bee stings. They were stimulated either with PLA (beekeeper A Vβ2) or anti-CD3 mAb (all of the other panels) in the presence of irradiated autologous PBMCs and were expanded with IL-2 for 12 d. The entire panel of TCR mAbs was used for staining. A significant switch in TCRVβ2 and 12% (beekeeper A) and TCRVβ8 and 20% (beekeeper B) of positive cells between T cell subsets after bee stings is shown. A change in TCRVβ-expressing CD4+ T cell frequency is accepted as significant if an increase in the frequency of IL-10–secreting T cells is observed together with a decrease in either IFN-γ– or IL-4–secreting T cells that is two times bigger than the average of four healthy controls. (B) The changes in the frequency of TCRVβ-expressing CD4+ T cells was calculated by multiplying the percentage of TCRVβ with the frequency of the same cytokine-secreting PLA-specific CD4+ T cell subset.
Figure 4. PLA-specific CD4+ IL-4– and IFN-γ–secreting CD4+ T cells switch to IL-10–secreting T cells. (A) Two beekeepers were analyzed for TCRVβ chain expression in purified PLA-specific IL-4–, IL-10–, and IFN-γ–secreting T cells by gating CD3+CD4+ T cells by flow cytometry. (B) PLA-specific IL-10–, IFN-γ–, and IL-4–secreting T cells were purified from two beekeepers before and 7 d after multiple bee stings. They were stimulated either with PLA (beekeeper A Vβ2) or anti-CD3 mAb (all of the other panels) in the presence of irradiated autologous PBMCs and were expanded with IL-2 for 12 d. The entire panel of TCR mAbs was used for staining. A significant switch in TCRVβ2 and 12% (beekeeper A) and TCRVβ8 and 20% (beekeeper B) of positive cells between T cell subsets after bee stings is shown. A change in TCRVβ-expressing CD4+ T cell frequency is accepted as significant if an increase in the frequency of IL-10–secreting T cells is observed together with a decrease in either IFN-γ– or IL-4–secreting T cells that is two times bigger than the average of four healthy controls. (B) The changes in the frequency of TCRVβ-expressing CD4+ T cells was calculated by multiplying the percentage of TCRVβ with the frequency of the same cytokine-secreting PLA-specific CD4+ T cell subset.CC BY-NC-SA · PubMed Central
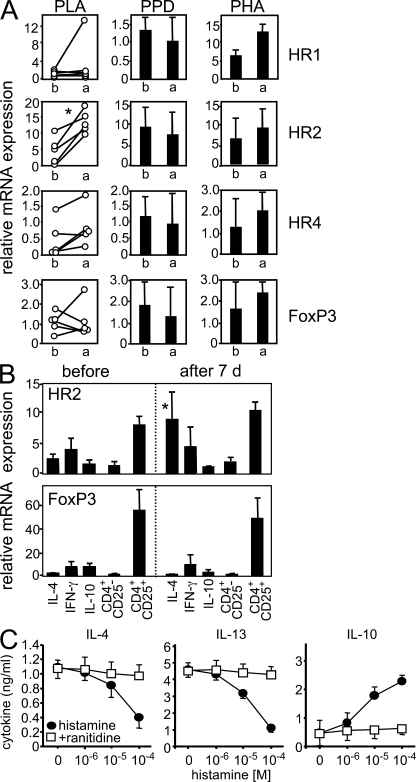
Figure 5. HR2 is up-regulated in specific T cells after multiple bee stings and induces IL-10 production. (A) PBMCs were stimulated with PLA for 5 d. HR1, HR2, HR4, and FoxP3 mRNAs were determined 4 h after anti-CD3/-CD28 mAb stimulation before and 7 d after multiple bee stings. For comparison, PPD- and PHA-stimulated cells did not show any difference. (B) HR2 and FoxP3 were analyzed in purified allergen-specific IL-4–, IL-10–, and IFN-γ–secreting T cells immediately after purification and in CD4+CD25+ and CD4+CD25− T cells. (C) PLA-specific IL-4–secreting T cells were purified, expanded for 12 d, and stimulated with different doses of histamine in the presence or absence of 10−4 M ranitidine. Cytokines were determined by ELISA 3 d after anti-CD2/-CD3/-CD28 mAb stimulation. Data are expressed as means + SEM.
Figure 5. HR2 is up-regulated in specific T cells after multiple bee stings and induces IL-10 production. (A) PBMCs were stimulated with PLA for 5 d. HR1, HR2, HR4, and FoxP3 mRNAs were determined 4 h after anti-CD3/-CD28 mAb stimulation before and 7 d after multiple bee stings. For comparison, PPD- and PHA-stimulated cells did not show any difference. (B) HR2 and FoxP3 were analyzed in purified allergen-specific IL-4–, IL-10–, and IFN-γ–secreting T cells immediately after purification and in CD4+CD25+ and CD4+CD25− T cells. (C) PLA-specific IL-4–secreting T cells were purified, expanded for 12 d, and stimulated with different doses of histamine in the presence or absence of 10−4 M ranitidine. Cytokines were determined by ELISA 3 d after anti-CD2/-CD3/-CD28 mAb stimulation. Data are expressed as means + SEM.CC BY-NC-SA · PubMed Central
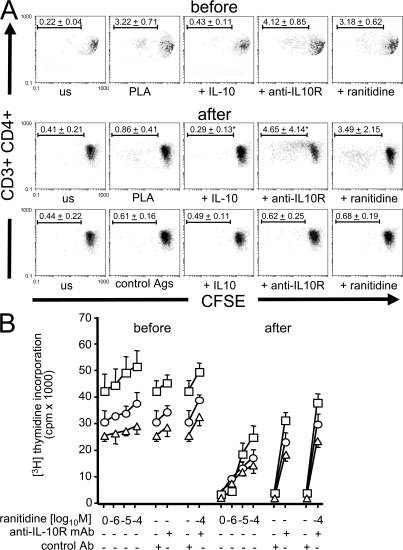
Figure 6. HR2 and IL-10 play major roles in peripheral T cell tolerance to high dose antigen exposure. (A) PBMCs of beekeepers were labeled with CFSE, and dilutions in CFSE-expressing cells were analyzed in the presence of IL-10, anti–IL-10R mAb (blocking), and 10−4 M ranitidine before and 7 d after multiple bee stings. BSA, TT, and bee venom allergen hyaluronidase were used as control antigens in beekeepers who did not show significant proliferation to these antigens. On day 6, cells were collected, stained with anti-CD4 PE and anti-CD3 PE Texas red and analyzed by flow cytometry (means ± standard deviation of percentages of dividing cells are shown in one representative out of three beekeepers). us, unstimulated. (B) PBMCs of three different beekeepers were stimulated with PLA and different doses of ranitidine or anti–IL-10R mAb or both. [3H]Thymidine incorporation was determined on day 6. Data are expressed as means + SEM.
Figure 6. HR2 and IL-10 play major roles in peripheral T cell tolerance to high dose antigen exposure. (A) PBMCs of beekeepers were labeled with CFSE, and dilutions in CFSE-expressing cells were analyzed in the presence of IL-10, anti–IL-10R mAb (blocking), and 10−4 M ranitidine before and 7 d after multiple bee stings. BSA, TT, and bee venom allergen hyaluronidase were used as control antigens in beekeepers who did not show significant proliferation to these antigens. On day 6, cells were collected, stained with anti-CD4 PE and anti-CD3 PE Texas red and analyzed by flow cytometry (means ± standard deviation of percentages of dividing cells are shown in one representative out of three beekeepers). us, unstimulated. (B) PBMCs of three different beekeepers were stimulated with PLA and different doses of ranitidine or anti–IL-10R mAb or both. [3H]Thymidine incorporation was determined on day 6. Data are expressed as means + SEM.CC BY-NC-SA · PubMed Central
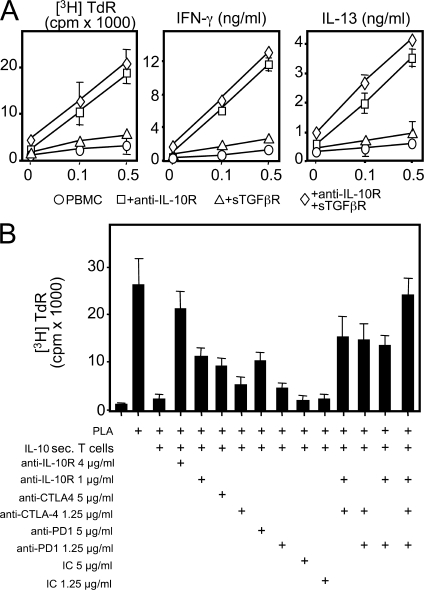
Figure 7. Multiple suppressive mechanisms play a role in peripheral allergen tolerance. (A) Endogenous IL-10, TGF-β, or both were neutralized in PLA-stimulated PBMCs of beekeepers during beekeeping season. [3H]Thymidine incorporation (TdR), IFN-γ, and IL-13 were determined at day 5. (B) PLA-specific proliferation of PBMCs from beekeepers before multiple bee stings is suppressed by a 10 times–increased frequency of PLA-specific IL-10–secreting T cells. The activity of IL-10R, CTLA-4, and PD-1 was neutralized. [3H]Thymidine incorporation was determined at day 6. The same results were obtained in six independent experiments in A and three independent experiments in B, all performed with freshly purified cells without in vitro expansion. Data are expressed as means + SEM. IC, isotype control antibody.
Figure 7. Multiple suppressive mechanisms play a role in peripheral allergen tolerance. (A) Endogenous IL-10, TGF-β, or both were neutralized in PLA-stimulated PBMCs of beekeepers during beekeeping season. [3H]Thymidine incorporation (TdR), IFN-γ, and IL-13 were determined at day 5. (B) PLA-specific proliferation of PBMCs from beekeepers before multiple bee stings is suppressed by a 10 times–increased frequency of PLA-specific IL-10–secreting T cells. The activity of IL-10R, CTLA-4, and PD-1 was neutralized. [3H]Thymidine incorporation was determined at day 6. The same results were obtained in six independent experiments in A and three independent experiments in B, all performed with freshly purified cells without in vitro expansion. Data are expressed as means + SEM. IC, isotype control antibody.CC BY-NC-SA · PubMed Central

Verification

Claims the paper makes

The claims and statistics of this paper haven’t been checked yet.

Run the check — free, no account needed. It reads the open-access text and checks the sources it cites.

A few free checks a day · papers already verified open instantly · results are public

Claims other papers make about this one

Each is checked against this paper’s own text: does it say what the citing paper says it does?

Self-check

Percentages, sums and reported differences re-computed from the paper’s own numbers.

The self-check needs the paper’s full text.

Citations

Cites

Show all 1 references

Research works printed but not linked: 51

  1. 1986, J. Immunol., 136, 2348, 10.4049/jimmunol.136.7.2348 · DOI
  2. 2007, Science., 317, 627, 10.1126/science.1142331 · DOI
  3. 2007, Nat. Rev. Immunol., 7, 585, 10.1038/nri2138 · DOI
  4. 2007, Nat. Immunol., 8, 124, 10.1038/ni0207-124 · DOI
  5. 2005, Immunol. Rev., 206, 232, 10.1111/j.0105-2896.2005.00280.x · DOI
  6. 2006, Immunol. Rev., 212, 60, 10.1111/j.0105-2896.2006.00415.x · DOI
  7. 1993, Science., 259, 974, 10.1126/science.8094901 · DOI
  8. 1997, Nature., 389, 737, 10.1038/39614 · DOI
  9. 1994, Science., 265, 1237, 10.1126/science.7520605 · DOI
  10. 2002, J. Immunol., 169, 6112, 10.4049/jimmunol.169.11.6112 · DOI
  11. 1998, J. Clin. Invest., 102, 98, 10.1172/JCI2250 · DOI
  12. 2004, J. Exp. Med., 199, 1567, 10.1084/jem.20032058 · DOI
  13. 2002, J. Exp. Med., 195, 603, 10.1084/jem.20011629 · DOI
  14. 2005, Am. J. Respir. Cell Mol. Biol., 33, 105, 10.1165/rcmb.2005-0100OC · DOI
  15. 2001, Nature., 413, 420, 10.1038/35096564 · DOI
  16. 2006, Nat. Rev. Immunol., 6, 761, 10.1038/nri1934 · DOI
  17. 2006, Curr. Opin. Immunol., 18, 738, 10.1016/j.coi.2006.06.003 · DOI · Paper page
  18. 2003, Eur. J. Immunol., 33, 1205, 10.1002/eji.200322919 · DOI
  19. 2008, Nat. Rev. Drug Discov., 7, 41, 10.1038/nrd2465 · DOI
  20. 2005, Allergy., 60, 1339, 10.1111/j.1398-9995.2005.00963.x · DOI · Paper page
  21. 2006, Clin. Exp. Allergy., 36, 465, 10.1111/j.1365-2222.2006.02469.x · DOI
  22. 1998, Science., 280, 243, 10.1126/science.280.5361.243 · DOI
  23. 2006, Curr. Opin. Immunol., 18, 718, 10.1016/j.coi.2006.09.016 · DOI
  24. 2006, J. Clin. Invest., 116, 2423, 10.1172/JCI28941 · DOI
  25. 2003, J. Immunol., 171, 3542, 10.4049/jimmunol.171.7.3542 · DOI · Paper page
  26. 2003, Nat. Immunol., 4, 78, 10.1038/ni872 · DOI
  27. 2000, J. Immunol., 164, 3177, 10.4049/jimmunol.164.6.3177 · DOI
  28. 1998, J. Allergy Clin. Immunol., 101, 747, 10.1016/S0091-6749(98)70402-6 · DOI
  29. 2003, J. Clin. Invest., 112, 432, 10.1172/JCI18106 · DOI
  30. 2005, Clin. Exp. Allergy., 35, 52, 10.1111/j.1365-2222.2005.02143.x · DOI
  31. 2005, Nat. Med., 11, S69, 10.1038/nm1226 · DOI
  32. 2002, Eur. J. Immunol., 32, 2237, 10.1002/1521-4141(200208)32:8<2237::AID-IMMU2237>3.0.CO;2-2 · DOI
  33. 2003, Immunity., 18, 605, 10.1016/S1074-7613(03)00113-4 · DOI
  34. 2001, J. Clin. Invest., 108, 1865, 10.1172/JCI200113930 · DOI
  35. 2003, FASEB J., 17, 1089, 10.1096/fj.02-1008com · DOI
  36. 1998, J. Clin. Invest., 102, 1866, 10.1172/JCI3692 · DOI
  37. 2000, J. Exp. Med., 192, 303, 10.1084/jem.192.2.303 · DOI · Paper page
  38. 2000, J. Exp. Med., 192, 295, 10.1084/jem.192.2.295 · DOI
  39. 1999, Immunity., 11, 141, 10.1016/S1074-7613(00)80089-8 · DOI · Paper page
  40. 2002, Eur. J. Immunol., 32, 634, 10.1002/1521-4141(200203)32:3<634::AID-IMMU634>3.0.CO;2-9 · DOI
  41. 1997, J. Immunol., 158, 5050, 10.4049/jimmunol.158.10.5050 · DOI
  42. 1998, J. Allergy Clin. Immunol., 101, 222, 10.1016/S0091-6749(98)70387-2 · DOI
  43. 1997, J. Allergy Clin. Immunol., 100, 760, 10.1016/S0091-6749(97)70270-7 · DOI
  44. 1994, J. Allergy Clin. Immunol., 93, 437, 10.1016/0091-6749(94)90352-2 · DOI
  45. 2004, Lancet., 363, 608, 10.1016/S0140-6736(04)15592-X · DOI
  46. 1993, J. Immunol., 150, 3582, 10.4049/jimmunol.150.8.3582 · DOI
  47. 1998, Eur. J. Immunol., 28, 914, 10.1002/(SICI)1521-4141(199803)28:03<914::AID-IMMU914>3.0.CO;2-C · DOI
  48. 1999, Eur. J. Immunol., 29, 4053, 10.1002/(SICI)1521-4141(199912)29:12<4053::AID-IMMU4053>3.0.CO;2-C · DOI
  49. 2000, FASEB J., 14, 1666, 10.1096/fj.99-0874fje · DOI
  50. 1994, J. Immunol., 152, 1821, 10.4049/jimmunol.152.4.1821 · DOI
  51. 2003, FASEB J., 17, 194, 10.1096/fj.02-0550com · DOI

Cited by

Sorted by citations

See all 411

Metadata

Authors
Meiler, F., Zumkehr, J., Klunker, S., Rückert, B., Akdis, C. A., & Akdis, M.
Venue
The Journal of Experimental Medicine
Published
2008-11-10
Volume
205
Issue
12
Pages
2887-2898
ISSN
  • 1540-9538
  • 0022-1007
Cited by
411
References
1
Language
en

About these checks

Registry, retraction, Cites and statistics results are computed, not judged, with one exception: a printed reference that no index lists is read once by a model before it counts as a citation error. Claims are extracted by a model and kept only when their quote appears verbatim in the text; each cited source is then checked, with a model’s help, for whether it says what the claim relies on. Those verdicts can be wrong — read the claim’s quote and the cited source before relying on one.

Statistics and arithmetic are recomputed, not judged.

Confidence bands are shown only for fields calibrated on our annotated test set. None is calibrated yet, so no band is shown.

What counts as a claim ›How we measure confidence ›How we check this ›

Are you an author, or do you see a problem with this page? Request a review

How to cite

Cite CoChat for the checks on this page, and the paper for its own findings.

This page
CoChat. (2026). Citation check: In vivo switch to IL-10–secreting T regulatory cells in high dose allergen exposure. https://app.cochat.ai/papers/10.1084/jem.20080193
The paper
Meiler, F., Zumkehr, J., Klunker, S., Rückert, B., Akdis, C. A., & Akdis, M. (2008). In vivo switch to IL-10–secreting T regulatory cells in high dose allergen exposure. The Journal of Experimental Medicine. https://doi.org/10.1084/jem.20080193