

The DOI matches its Crossref record; 47 of the 47 references it cites were found in a registry or an index.
Epithelial transglutaminase 2 is needed for T cell interleukin-17 production and subsequent pulmonary inflammation and fibrosis in bleomycin-treated mice
Open accessAbstract
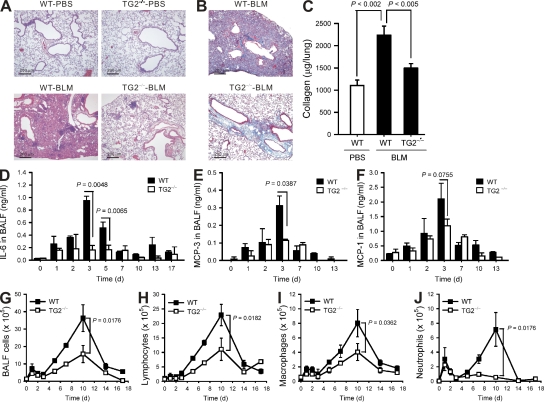
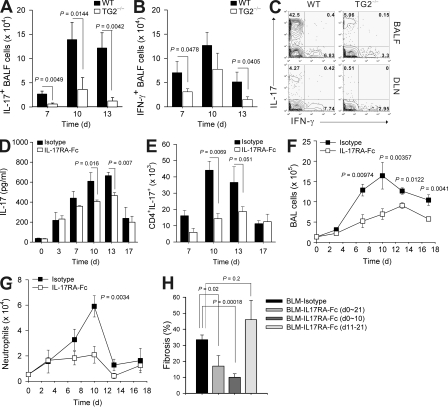
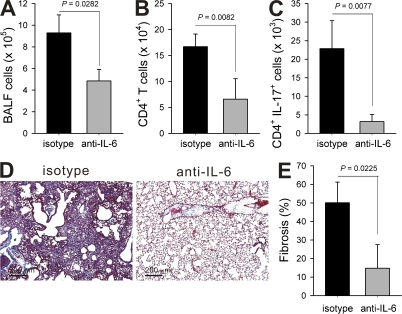
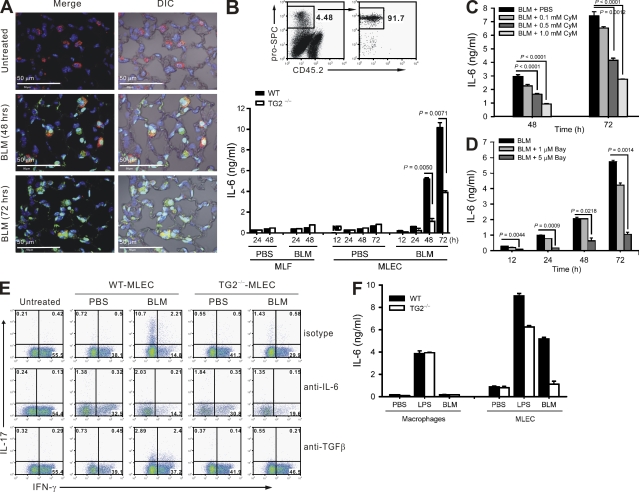
Pulmonary fibrosis is a potentially life-threatening disease that may be caused by overt or asymptomatic inflammatory responses. However, the precise mechanisms by which tissue injury is translated into inflammation and consequent fibrosis remain to be established. Here, we show that in a lung injury model, bleomycin induced the secretion of IL-6 by epithelial cells in a transglutaminase 2 (TG2)–dependent manner. This response represents a key step in the differentiation of IL-17–producing T cells and subsequent inflammatory amplification in the lung. The essential role of epithelial cells, but not inflammatory cells, TG2 was confirmed in bone marrow chimeras; chimeras made in TG2-deficient recipients showed reduced inflammation and fibrosis, compared with those in wild-type mice, regardless of the bone marrow cell phenotype. Epithelial TG2 thus appears to be a critical inducer of inflammation after noninfectious pulmonary injury. We further demonstrated that fibroblast-derived TG2, acting downstream of transforming growth factor-β, is also important in the effector phase of fibrogenesis. Therefore, TG2 represents an interesting potential target for therapeutic intervention.
Overview
The claims and statistics of this paper haven’t been checked yet.
Run the check — free, no account needed. It reads the open-access text and checks the sources it cites.
Integrity signals
Registry
Cites
Statistics
Figures
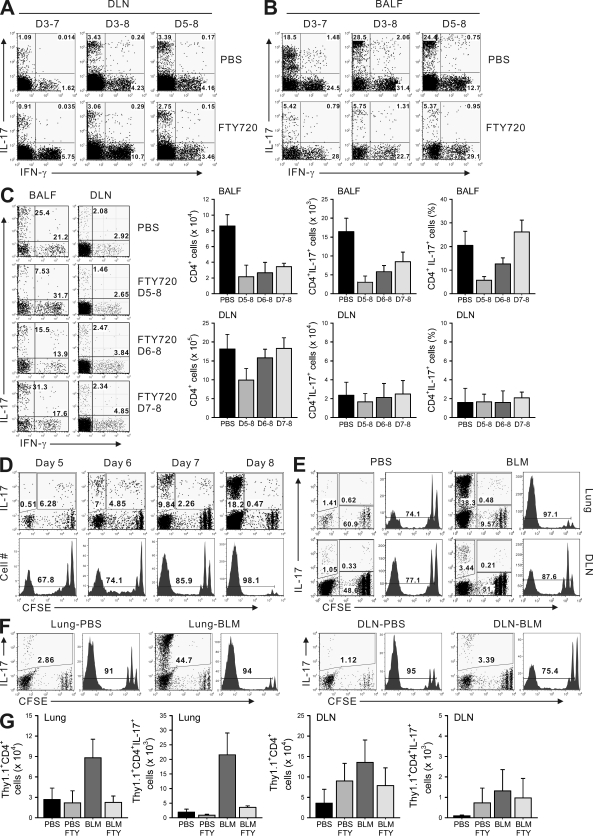
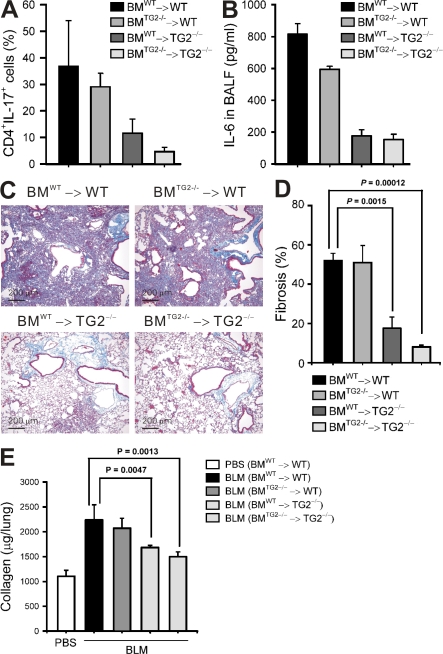
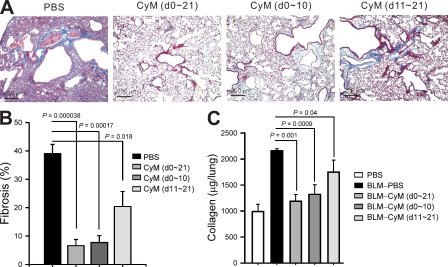
Verification
Claims the paper makes
The claims and statistics of this paper haven’t been checked yet.
Run the check — free, no account needed. It reads the open-access text and checks the sources it cites.
Claims other papers make about this one
Each is checked against this paper’s own text: does it say what the citing paper says it does?
In the citing paper
“the alarmin cytokines thymic stromal lymphopoietin, IL-25, and IL-33 function as key initiators of type 2-dependent fibrosis by triggering the production of IL-4 and IL-13 in innate lymphoid cells, T cells, eosinophils, and other type 2-associated leukocytes129–132”
From Fibrosis: from mechanisms to medicines (2020) · cites this paper as [130]
Self-check
Percentages, sums and reported differences re-computed from the paper’s own numbers.
The self-check needs the paper’s full text.
Citations
Cites
Korn, T., Bettelli, E., Oukka, M., & Kuchroo, V. K. (2009) · Annual Review of Immunology · doi:10.1146/annurev.immunol.021908.132710 · Cited by 4,873
Cytokine-mediated regulation of CXCR4 expression in human neutrophils
Nagase, H., Miyamasu, M., Yamaguchi, M., Imanishi, M., Tsuno, N. H., Matsushima, K., Yamamoto, K., Morita, Y., & Hirai, K. (2002) · Journal of Leukocyte Biology · doi:10.1189/jlb.71.4.711 · Cited by 4,713
Resolution of inflammation: the beginning programs the end
Serhan, C. N., & Savill, J. (2005) · Nature Immunology · doi:10.1038/ni1276 · Cited by 2,552
TRANSFORMING GROWTH FACTOR-β REGULATION OF IMMUNE RESPONSES
Li, M. O., Wan, Y. Y., Sanjabi, S., Robertson, A.-K. L., & Flavell, R. A. (2005) · Annual Review of Immunology · doi:10.1146/annurev.immunol.24.021605.090737 · Cited by 2,264
IL-17 family cytokines and the expanding diversity of effector T cell lineages
Weaver, C. T., Hatton, R. D., Mangan, P. R., & Harrington, L. E. (2007) · Annual Review of Immunology · doi:10.1146/annurev.immunol.25.022106.141557 · Cited by 1,842
Kebir, H., Kreymborg, K., Ifergan, I., Dodelet-Devillers, A., Cayrol, R., Bernard, M., Giuliani, F., Arbour, N., Becher, B., & Prat, A. (2007) · Nature Medicine · doi:10.1038/nm1651 · Cited by 1,759
Common and unique mechanisms regulate fibrosis in various fibroproliferative diseases
Wynn, T. A. (2007) · Journal of Clinical Investigation · doi:10.1172/jci31487 · Cited by 1,487
Transglutaminases: crosslinking enzymes with pleiotropic functions
Lorand, L., & Graham, R. M. (2003) · Nature Reviews Molecular Cell Biology · doi:10.1038/nrm1014 · Cited by 1,439
The IL-23/Th17 Axis in the Immunopathogenesis of Psoriasis
Cesare, A. D., Meglio, P. D., & Nestle, F. O. (2009) · Journal of Investigative Dermatology · doi:10.1038/jid.2009.59 · Cited by 1,162
Worbs, T., Bode, U., Yan, S., Hoffmann, M., Hintzen, G., Bernhardt, G., Förster, R., & Pabst, O. (2006) · The Journal of Experimental Medicine · doi:10.1084/jem.20052016 · Cited by 732
Bleomycin and IL-1β–mediated pulmonary fibrosis is IL-17A dependent
Wilson, M. S., Madala, S. K., Ramalingam, T. R., Gochuico, B. R., Rosas, I. O., Cheever, A. W., & Wynn, T. A. (2010) · Journal of Experimental Medicine · doi:10.1084/jem.20092121 · Cited by 730
Th17 Cell Differentiation: The Long and Winding Road
McGeachy, M. J., & Cua, D. J. (2008) · Immunity · doi:10.1016/j.immuni.2008.03.001 · Cited by 712
Interleukin-17 is a negative regulator of established allergic asthma
Schnyder‐Candrian, S., Togbe, D., Couillin, I., Mercier, I., Brombacher, F., Quesniaux, V. F. J., Fossiez, F., Ryffel, B., & Schnyder, B. (2006) · The Journal of Experimental Medicine · doi:10.1084/jem.20061401 · Cited by 575
Transcriptional regulation of Th17 cell differentiation
Ivanov, I. I., Zhou, L., & Littman, D. R. (2007) · Seminars in Immunology · doi:10.1016/j.smim.2007.10.011 · Cited by 496
Pathological versus protective functions of IL-22 in airway inflammation are regulated by IL-17A
Sonnenberg, G. F., Nair, M. G., Kirn, T. J., Zaph, C., Fouser, L. A., & Artis, D. (2010) · The Journal of Experimental Medicine · doi:10.1084/jem.20092054 · Cited by 404
Identification of the IL-17 Receptor Related Molecule IL-17RC as the Receptor for IL-17F
Kuestner, R. E., Taft, D. W., Haran, A. C., Brandt, C. S., Brender, T., Lum, K. D., Harder, B., Okada, S. L., Ostrander, C. D., Kreindler, J. L., et al. (2007) · The Journal of Immunology · doi:10.4049/jimmunol.179.8.5462 · Cited by 358
Gene Disruption of Tissue Transglutaminase
Laurenzi, V. D., & Melino, G. (2001) · Molecular and Cellular Biology · doi:10.1128/mcb.21.1.148-155.2001 · Cited by 339
Self-citationKojima, S., Nara, K., & Rifkin, D. B. (1993) · The Journal of Cell Biology · doi:10.1083/jcb.121.2.439 · Cited by 283
Tumor masses support naive T cell infiltration, activation, and differentiation into effectors
Thompson, E. D., Enriquez, H. L., Fu, Y., & Engelhard, V. H. (2010) · The Journal of Experimental Medicine · doi:10.1084/jem.20092454 · Cited by 265
Strategies for treating idiopathic pulmonary fibrosis
du Bois, R. M. (2010) · Nature Reviews Drug Discovery · doi:10.1038/nrd2958 · Cited by 248
Emerging Concepts in the Pathogenesis of Lung Fibrosis
Hardie, W. D., Glasser, S. W., & Hagood, J. S. (2009) · American Journal Of Pathology · doi:10.2353/ajpath.2009.081170 · Cited by 244
Akimov, S., & Belkin, A. M. (2001) · Journal of Cell Science · doi:10.1242/jcs.114.16.2989 · Cited by 217
Tissue transglutaminase in normal and abnormal wound healing: Review article
Verderio, E. A. M., Johnson, T. S., & Griffin, M. (2004) · Amino Acids · doi:10.1007/s00726-004-0094-4 · Cited by 173
Mice Lacking Neutrophil Elastase Are Resistant to Bleomycin-Induced Pulmonary Fibrosis
Chua, F., Dunsmore, S. E., Clingen, P. H., Mutsaers, S. E., Shapiro, S. D., Segal, A. W., Roes, J., & Laurent, G. J. (2007) · American Journal Of Pathology · doi:10.2353/ajpath.2007.060352 · Cited by 161
Shweke, N., Boulos, N., Jouanneau, C., Vandermeersch, S., Melino, G., Dussaule, J., Chatziantoniou, C., Ronco, P. M., & Boffa, J. (2008) · American Journal Of Pathology · doi:10.2353/ajpath.2008.080025 · Cited by 155
Self-citationCose, S., Brammer, C., Khanna, K. M., Masopust, D., & Lefrançois, L. (2006) · European Journal of Immunology · doi:10.1002/eji.200535539 · Cited by 149
Transglutaminases in inflammation and fibrosis of the gastrointestinal tract and the liver
Elli, L., Bergamini, C. M., Bardella, M. T., & Schuppan, D. (2009) · Digestive and Liver Disease · doi:10.1016/j.dld.2008.12.095 · Cited by 145
Re, S. L., Dumoutier, L., Couillin, I., Vyve, C. V., Yakoub, Y., Uwambayinema, F., Marien, B., van den Brûle, S., Snick, J. V., Uyttenhove, C., et al. (2010) · The Journal of Immunology · doi:10.4049/jimmunol.0900459 · Cited by 144
Braun, R. K., Ferrick, C., Neubauer, P. D., Sjoding, M. W., Sterner‐Kock, A., Kock, M., Putney, L. F., Ferrick, D. A., Hyde, D. M., & Love, R. B. (2008) · Inflammation · doi:10.1007/s10753-008-9062-6 · Cited by 136
Thymic Selection by a Single MHC/Peptide Ligand Produces a Semidiverse Repertoire of CD4+ T Cells
Surh, C. D., Lee, D., Fung‐Leung, W., Karlsson, L., & Sprent, J. (1997) · Immunity · doi:10.1016/s1074-7613(00)80524-5 · Cited by 132
Self-citationGaudry, C. A., Verderio, E. A. M., Aeschlimann, D. P., Cox, A., Smith, C., & Griffin, M. (1999) · Journal of Biological Chemistry · doi:10.1074/jbc.274.43.30707 · Cited by 132
The role of transglutaminase in the rat subtotal nephrectomy model of renal fibrosis.
Johnson, T. S., Griffin, M., Thomas, G. L., Skill, N. J., Cox, A., Yang, B., Nicholas, B., Birckbichler, P. J., Kubara, C., & Nahas, A. M. E. (1997) · Journal of Clinical Investigation · doi:10.1172/jci119490 · Cited by 127
Chen, E. S., Greenlee, B. M., Wills-Karp, M. A., & Möller, D. R. (2001) · American Journal of Respiratory Cell and Molecular Biology · doi:10.1165/ajrcmb.24.5.4064 · Cited by 125
Tissue transglutaminase and the stress response
Ientile, R., Caccamo, D., & Griffin, M. (2007) · Amino Acids · doi:10.1007/s00726-007-0517-0 · Cited by 118
Transglutaminase 2 in inflammation
Kim, S. (2006) · Frontiers in bioscience · doi:10.2741/2030 · Cited by 118
CD8+ recent thymic emigrants home to and efficiently repopulate the small intestine epithelium
Staton, T. L., Habtezion, A., Winslow, M. M., Sato, T., Love, P. E., & Butcher, E. C. (2006) · Nature Immunology · doi:10.1038/ni1319 · Cited by 109
Pulmonary Fibrosis Correlates with Duration of Tissue Neutrophil Activation
Jones, H. A., Schofield, J. B., Krausz, T. N., Boobis, A. R., & Haslett, C. (1998) · American Journal of Respiratory and Critical Care Medicine · doi:10.1164/ajrccm.158.2.9711075 · Cited by 107
Leukocyte Transglutaminase 2 Expression Limits Atherosclerotic Lesion Size
Boisvert, W. A., Rose, D. M., Boullier, A., Quehenberger, O., Sydlaske, A. D., Johnson, K. A., Curtiss, L. K., & Terkeltaub, R. A. (2006) · Arteriosclerosis Thrombosis and Vascular Biology · doi:10.1161/01.atv.0000203503.82693.c1 · Cited by 95
Traves, S. L., & Donnelly, L. (2008) · Current Molecular Medicine · doi:10.2174/156652408785160998 · Cited by 88
INTERLEUKIN-17 IN PULMONARY HOST DEFENSE
Aujla, S. J., Dubin, P. J., & Kolls, J. K. (2007) · Experimental Lung Research · doi:10.1080/01902140701756604 · Cited by 75
Dailey, M. O. (1998) · Critical Reviews in Immunology · doi:10.1615/critrevimmunol.v18.i3.10 · Cited by 64
Transglutaminase Type II Is Involved in the Pathogenesis of Endotoxic Shock
Falasca, L., Farrace, M. G., Rinaldi, A., Tuosto, L., Melino, G., & Piacentini, M. (2008) · The Journal of Immunology · doi:10.4049/jimmunol.180.4.2616 · Cited by 63
Self-citationReview: Therapies for interstitial lung disease: past, present and future
Kim, R., & Meyer, K. C. (2008) · Therapeutic Advances in Respiratory Disease · doi:10.1177/1753465808096948 · Cited by 61
Thymic Selection by a Single MHC/Peptide Ligand
Lee, D., Ahn, C., Ernst, B., Sprent, J., & Surh, C. D. (1999) · Immunity · doi:10.1016/s1074-7613(00)80009-6 · Cited by 49
Self-citationTransglutaminase 2 Mediates Polymer Formation of I-κBα through C-terminal Glutamine Cluster
Park, S., Kim, J. M., Kim, D. S., Kim, I. H., & Kim, S. Y. (2006) · Journal of Biological Chemistry · doi:10.1074/jbc.m604150200 · Cited by 46
Self-citationLymphoid tissue reactions in rheumatoid arthritis
Manzo, A., & Pitzalis, C. (2007) · Autoimmunity Reviews · doi:10.1016/j.autrev.2007.03.006 · Cited by 32
Review: New perspectives in the treatment of idiopathic pulmonary fibrosis
Rogliani, P., Mura, M., Porretta, M. A., & Saltini, C. (2008) · Therapeutic Advances in Respiratory Disease · doi:10.1177/1753465808089363 · Cited by 30
Cited by
Sorted by citations
Fibrosis: from mechanisms to medicines
Henderson, N. C., Rieder, F., & Wynn, T. A. (2020) · Nature · doi:10.1038/s41586-020-2938-9 · Cited by 1,868
Therapy for Fibrotic Diseases: Nearing the Starting Line
Friedman, S. L., Sheppard, D., Duffield, J. S., & Violette, S. (2013) · Science Translational Medicine · doi:10.1126/scitranslmed.3004700 · Cited by 655
Transglutaminase Regulation of Cell Function
Eckert, R. L., Kaartinen, M. T., Nurminskaya, M., Belkin, A. M., Colak, G., Johnson, G. V. W., & Mehta, K. (2014) · Physiological Reviews · doi:10.1152/physrev.00019.2013 · Cited by 433
Idiopathic pulmonary fibrosis: Epithelial-mesenchymal interactions and emerging therapeutic targets
Hewlett, J. C., Kropski, J. A., & Blackwell, T. S. (2018) · Matrix Biology · doi:10.1016/j.matbio.2018.03.021 · Cited by 334
Liang, J., Zhang, Y., Xie, T., Liu, N., Chen, H., Geng, Y., Kurkciyan, A., Mena, J. M., Stripp, B. R., Jiang, D., et al. (2016) · Nature Medicine · doi:10.1038/nm.4192 · Cited by 287
Metadata
- Authors
- Oh, K., Park, H.-B., Byoun, O.-J., Shin, D.-M., Jeong, E. M., Kim, Y. W., Kim, Y. S., Melino, G., Kim, I.-G., & Lee, D.-S.
- Affiliations
- Seoul National University (KR)
- University of Leicester (GB)
- Corresponding author
- Kim, In-Gyu
- Lee, Dong-Sup
- Venue
- Journal of Experimental Medicine
- Publisher
- Rockefeller University Press
- Published
- 2011-07-11
- Volume
- 208
- Issue
- 8
- Pages
- 1707-1719
- ISSN
- 0022-1007 (ISSN-L)
- 1540-9538
- PMC
- PMC3149214
- OpenAlex
- W2139169478
- Cited by
- 118
- References
- 47
- Citations by year
- 2026: 5 · 2025: 7 · 2024: 3 · 2023: 6 · 2022: 5 · 2021: 13 · 2020: 9 · 2019: 7 · 2018: 6 · 2017: 4 · 2016: 10 · 2015: 9 · 2014: 11 · 2013: 14 · 2012: 8
- FWCI
- 9.25
- Type
- journal article
- Language
- en
- Open access
- green
- www.ncbi.nlm.nih.gov
- Licence
- cc-by-nc-sa
- Locations
- The Journal of Experimental Medicine (publishedVersion)
- PubMed Central (publishedVersion, cc-by-nc-sa)
- PubMed (publishedVersion)
- Cineca Institutional Research Information System (Tor Vergata University) (submittedVersion)
- Figshare (submittedVersion, cc-by)
- Leicester Research Archive (University of Leicester) (submittedVersion, cc-by-nc-sa)
- Seoul National University Open Repository (Seoul National University) (submittedVersion)
- Topics
- Health Sciences › Medicine › Pulmonary and Respiratory Medicine › Interstitial Lung Diseases and Idiopathic Pulmonary Fibrosis
- Health Sciences › Medicine › Surgery › Transplantation: Methods and Outcomes
- Health Sciences › Medicine › Rheumatology › Systemic Sclerosis and Related Diseases
- Keywords
- IL-17, T cell differentiation, pulmonary fibrosis, bleomycin-induced lung injury, IL-6 secretion, lung epithelial cells, lung inflammation, TGF-beta, bone marrow chimeras, fibrogenesis
- MeSH terms
- Protein Glutamine gamma Glutamyltransferase 2, Amines, Animals, Biotin, Bleomycin, Collagen, Enzyme-Linked Immunosorbent Assay, Epithelial Cells, Flow Cytometry, Fluorescent Antibody Technique, Histological Techniques, Male, Mice, Inbred C57BL, Pneumonia, Transglutaminases, Pulmonary Fibrosis, RNA, T-Lymphocytes, Blotting, Western, Interleukin-6, Polymerase Chain Reaction, DNA Primers, Mice, Knockout, Bronchoalveolar Lavage, GTP-Binding Proteins, Interleukin-17, Mice
About these checks
Registry, retraction, Cites and statistics results are computed, not judged, with one exception: a printed reference that no index lists is read once by a model before it counts as a citation error. Claims are extracted by a model and kept only when their quote appears verbatim in the text; each cited source is then checked, with a model’s help, for whether it says what the claim relies on. Those verdicts can be wrong — read the claim’s quote and the cited source before relying on one.
Statistics and arithmetic are recomputed, not judged.
Confidence bands are shown only for fields calibrated on our annotated test set. None is calibrated yet, so no band is shown.
What counts as a claim ›How we measure confidence ›How we check this ›
Are you an author, or do you see a problem with this page? Request a review
