

The DOI matches its Crossref record; 60 of the 60 references it cites were found in a registry or an index.
Control of Foxp3 stability through modulation of TET activity
Open accessAbstract
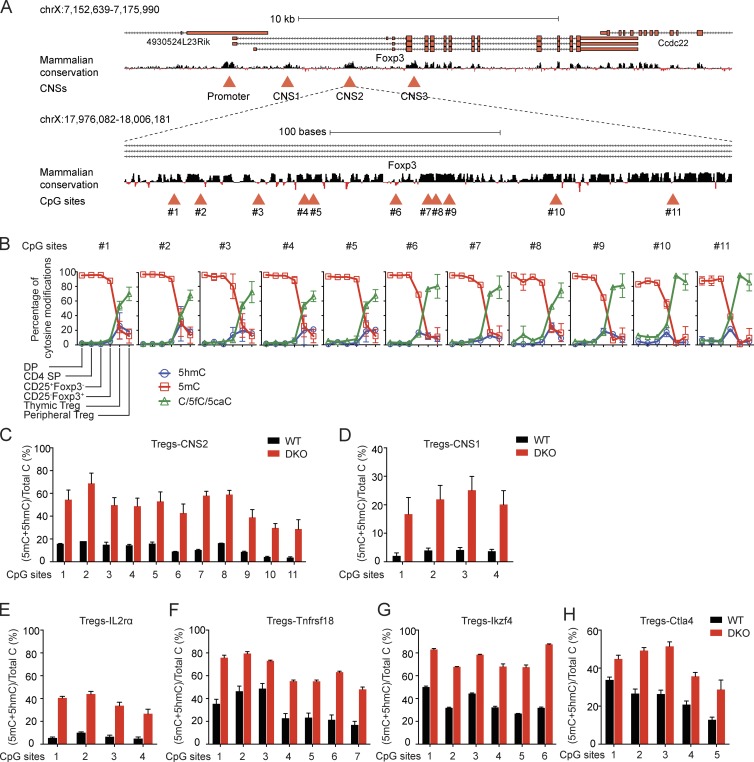
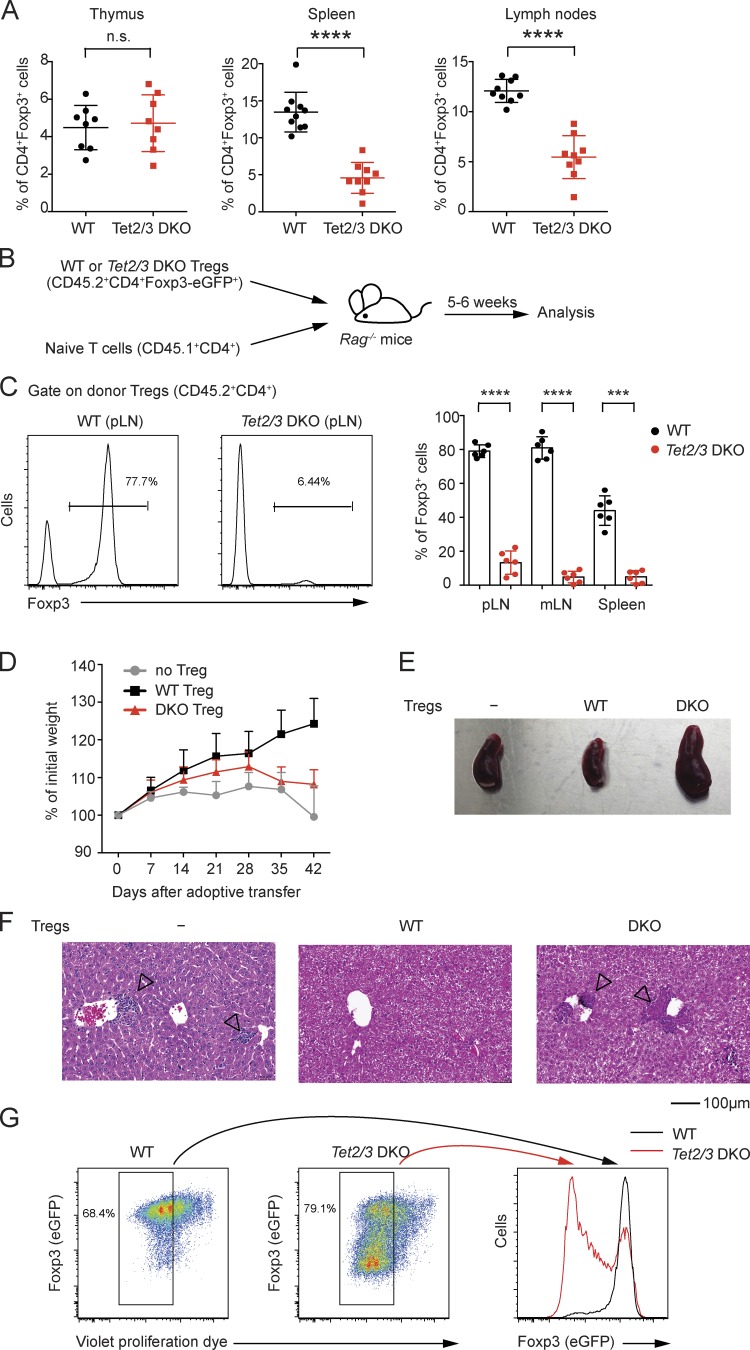
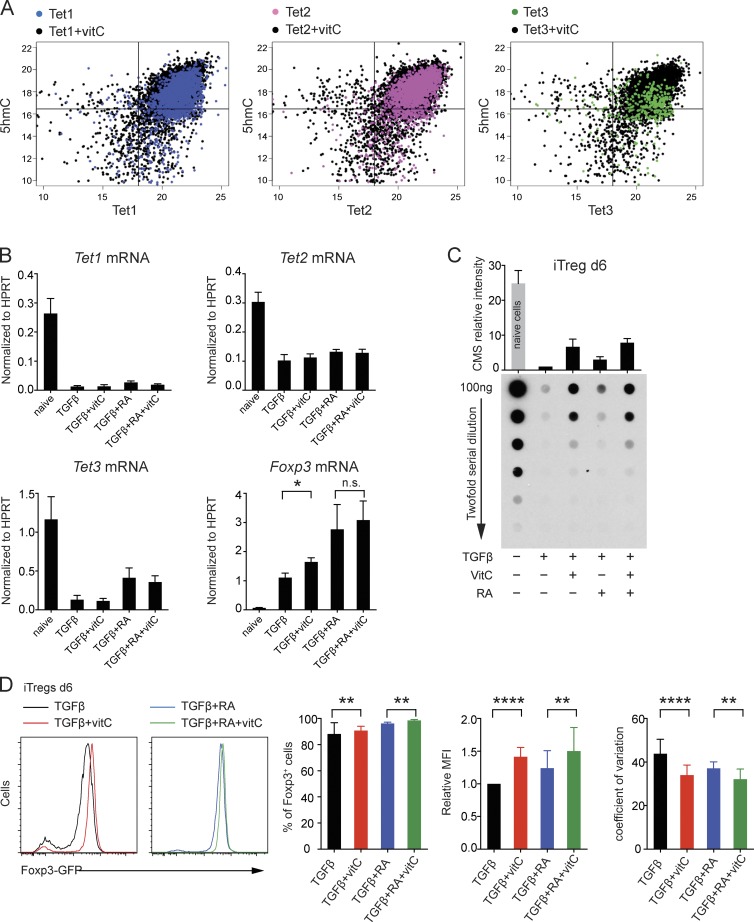
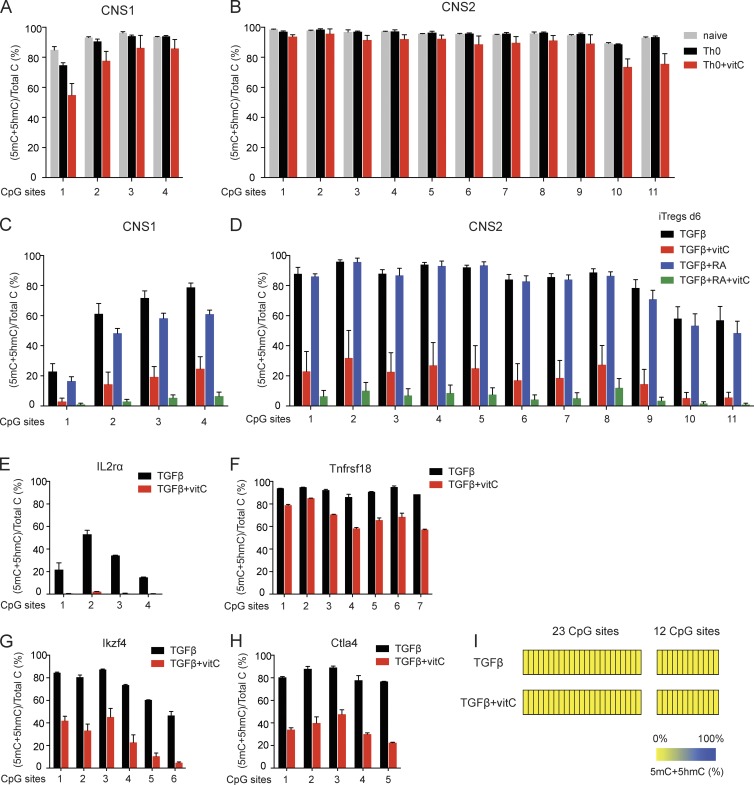
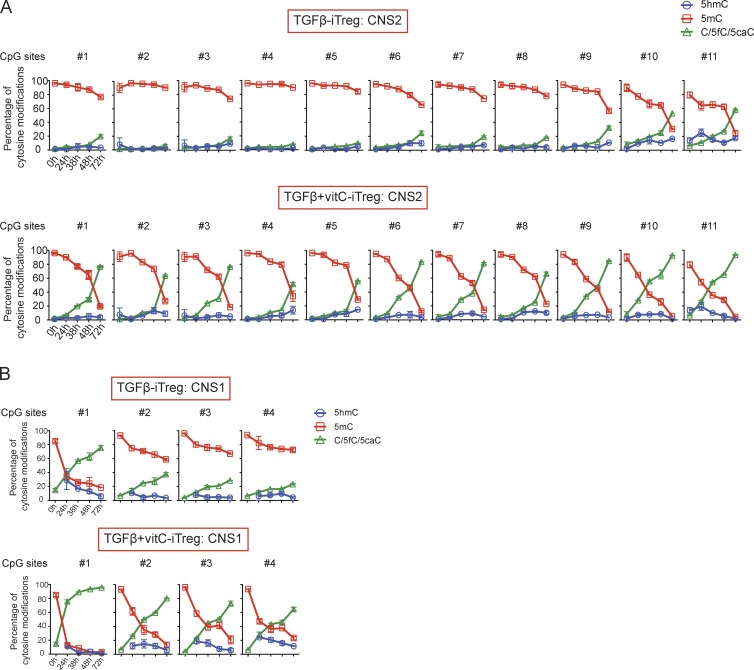
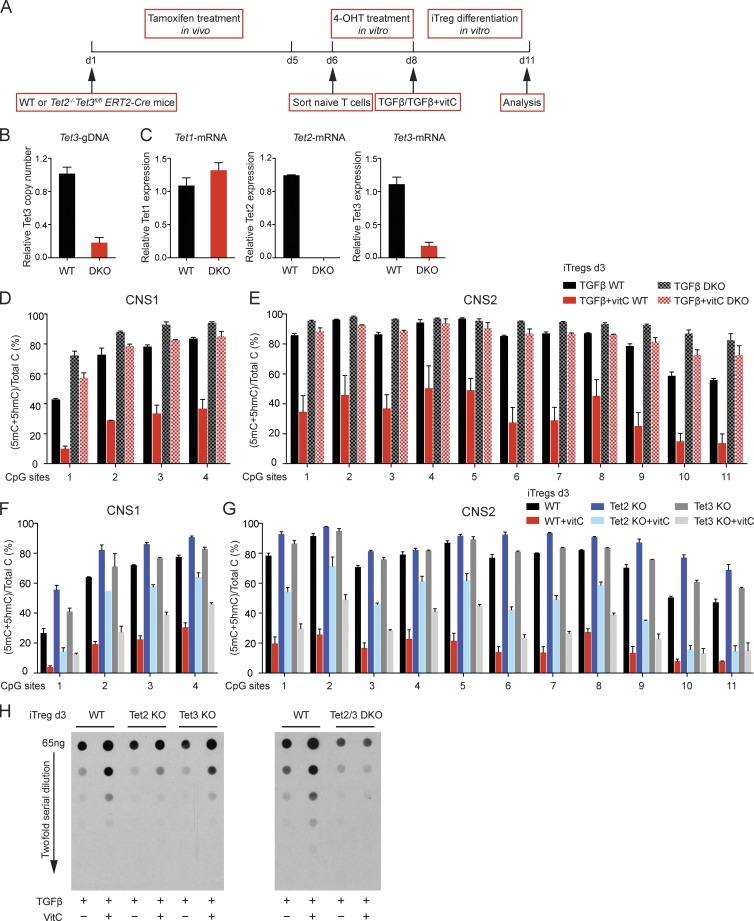
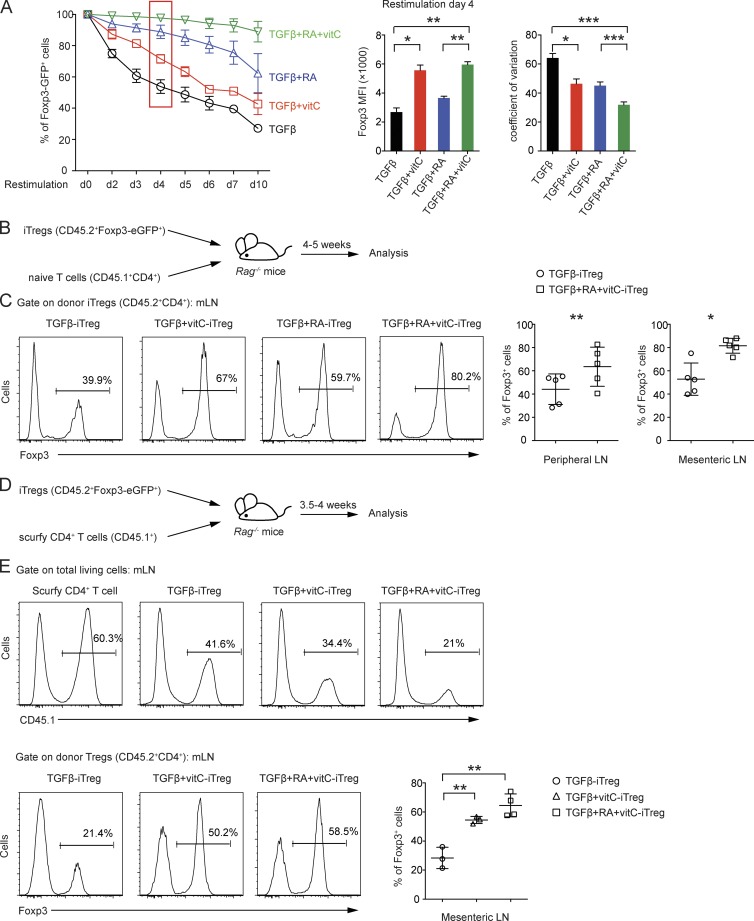
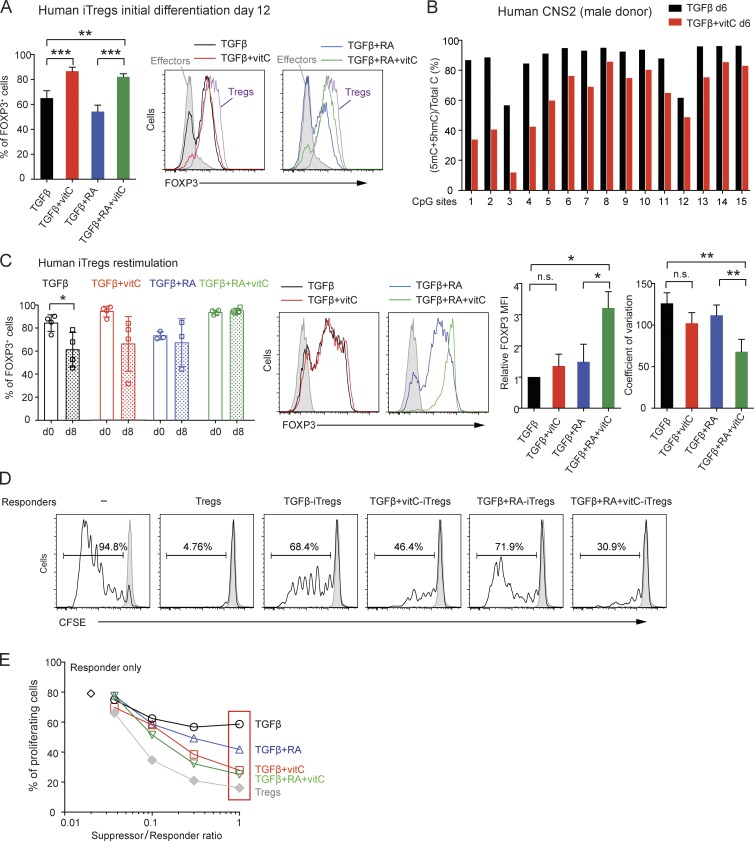
Ten-eleven translocation (TET) enzymes oxidize 5-methylcytosine (5mC) to 5-hydroxymethylcytosine and other oxidized methylcytosines, intermediates in DNA demethylation. In this study, we examine the role of TET proteins in regulating Foxp3, a transcription factor essential for the development and function of regulatory T cells (T reg cells), a distinct lineage of CD4+ T cells that prevent autoimmunity and maintain immune homeostasis. We show that during T reg cell development in the thymus, TET proteins mediate the loss of 5mC in T reg cell–specific hypomethylated regions, including CNS1 and CNS2, intronic cis-regulatory elements in the Foxp3 locus. Similar to CNS2-deficient T reg cells, the stability of Foxp3 expression is markedly compromised in T reg cells from Tet2/Tet3 double-deficient mice. Vitamin C potentiates TET activity and acts through Tet2/Tet3 to increase the stability of Foxp3 expression in TGF-β–induced T reg cells. Our data suggest that targeting TET enzymes with small molecule activators such as vitamin C might increase induced T reg cell efficacy.
Overview
The claims and statistics of this paper haven’t been checked yet.
Run the check — free, no account needed. It reads the open-access text and checks the sources it cites.
Integrity signals
Registry
Cites
Statistics
Figures
Verification
Claims the paper makes
The claims and statistics of this paper haven’t been checked yet.
Run the check — free, no account needed. It reads the open-access text and checks the sources it cites.
Claims other papers make about this one
Each is checked against this paper’s own text: does it say what the citing paper says it does?
In the citing paper
“The catalytic activity of all three TET family members (TET1, 2 and 3) are induced by vitC,13, 26”
From Vitamin C-induced epigenomic remodelling in IDH1 mutant acute myeloid leukaemia (2018) · cites this paper as [26]
Self-check
Percentages, sums and reported differences re-computed from the paper’s own numbers.
The self-check needs the paper’s full text.
Citations
Cites
Conversion of 5-Methylcytosine to 5-Hydroxymethylcytosine in Mammalian DNA by MLL Partner TET1
Tahiliani, M., Koh, K. P., Shen, Y., Pastor, W. A., Bandukwala, H., Brudno, Y., Agarwal, S., Iyer, L. M., Liu, D. R., Aravind, L., et al. (2009) · Science · doi:10.1126/science.1170116 · Cited by 5,836
Self-citationRegulatory T Cells and Immune Tolerance
Sakaguchi, S., Yamaguchi, T., Nomura, T., & Ono, M. (2008) · Cell · doi:10.1016/j.cell.2008.05.009 · Cited by 5,475
Chen, W., Jin, W., Hardegen, N. J., Lei, K.-J., Li, L., Marinos, N. J., McGrady, G., & Wahl, S. M. (2003) · The Journal of Experimental Medicine · doi:10.1084/jem.20030152 · Cited by 4,678
Tet proteins can convert 5-methylcytosine to 5-formylcytosine and 5-carboxylcytosine
Ito, S., Shen, L., Dai, Q., Wu, S. C., Collins, L. B., Swenberg, J. A., He, C., & Zhang, Y. (2011) · Science · doi:10.1126/science.1210597 · Cited by 3,451
Regulatory T cells: mechanisms of differentiation and function
Josefowicz, S. Z., Lu, L.-F., & Rudensky, A. Y. (2012) · Annual Review of Immunology · doi:10.1146/annurev.immunol.25.022106.141623 · Cited by 2,866
Tet-Mediated Formation of 5-Carboxylcytosine and Its Excision by TDG in Mammalian DNA
He, Y., Li, B.-Z., Li, Z., Liu, P., Wang, Y., Tang, Q., Ding, J., Jia, Y., Chen, Z., Li, L., et al. (2011) · Science · doi:10.1126/science.1210944 · Cited by 2,776
Self-citationBrunkow, M. E., Jeffery, E. W., Hjerrild, K. A., Paeper, B. W., Clark, L. B., Yasayko, S.-A., Wilkinson, J. E., Galas, D. J., Ziegler, S. F., & Ramsdell, F. (2001) · Nature Genetics · doi:10.1038/83784 · Cited by 2,628
Genesis: cluster analysis of microarray data
Sturn, A., Quackenbush, J., & Trajanoski, Z. (2002) · Bioinformatics · doi:10.1093/bioinformatics/18.1.207 · Cited by 1,761
Impaired hydroxylation of 5-methylcytosine in myeloid cancers with mutant TET2
Ko, M., Huang, Y., Jankowska, A. M., Pape, U. J., Tahiliani, M., Bandukwala, H. S., An, J., Lamperti, E. D., Koh, K. P., Ganetzky, R. D., et al. (2010) · Nature · doi:10.1038/nature09586 · Cited by 1,340
Self-citationEpigenetic Control of the foxp3 Locus in Regulatory T Cells
Floess, S., Freyer, J., Siewert, C., Baron, U., Olek, S., Polansky, J. K., Schlawe, K., Chang, H., Bopp, T., Schmitt, E., et al. (2007) · PLoS Biology · doi:10.1371/journal.pbio.0050038 · Cited by 1,296
Cited by
Sorted by citations
Items 101–200 of 353
The epigenetic modification of DNA methylation in neurological diseases
Li, L., Chen, R., Zhang, H., Li, J., Huang, H., Weng, J., Tan, H., Guo, T., Wang, M., & Xie, J. (2024) · Frontiers in Immunology · doi:10.3389/fimmu.2024.1401962 · Cited by 54
The epigenetic hallmarks of immune cells in cancer
Yu, J. H., Xiao, C., Fan, T. T., Deng, Z., Wang, D., Cai, W., Li, J., Liao, T., Li, C., & He, J. (2025) · Molecular Cancer · doi:10.1186/s12943-025-02255-4 · Cited by 52
“…while DNMT1 inhibitor 5-azacytidine (5-aza) or DNMTi knockdown also led to similar Treg-differentiation response of CD4 + T cells [66], while the inhibition or knockout of TET1 and TET2 fail to demethylate CNS2, blocking FOXP3 expression and impairing Treg differentiation and function [67, 68].”
Genome-wide CRISPR screen in human T cells reveals regulators of FOXP3
Chen, K. Y., Kibayashi, T., Giguelay, A., Hata, M., Nakajima, S., Mikami, N., Takeshima, Y., Ichiyama, K., Omiya, R., Ludwig, L. S., et al. (2025) · Nature · doi:10.1038/s41586-025-08795-5 · Cited by 57
Devaux, C. A., Million, M., & Raoult, D. (2020) · Frontiers in Microbiology · doi:10.3389/fmicb.2020.01642 · Cited by 50
Clonal hematopoiesis and its emerging effects on cellular therapies
Bonin, M. V., Jambor, H. K., Teipel, R., Stölzel, F., Thiede, C., Damm, F., Kroschinsky, F., Schetelig, J., Chavakis, T., & Bornhäuser, M. (2021) · Leukemia · doi:10.1038/s41375-021-01337-8 · Cited by 50
“Homozygous loss of function of TET-genes has been shown to promote autoinflammation [95,96] and to alter antigen-specific responses [74].”
BackgroundRegulatory T cells in autoimmune kidney diseases and transplantation
Mikami, N., & Sakaguchi, S. (2023) · Nature Reviews Nephrology · doi:10.1038/s41581-023-00733-w · Cited by 46
Yu, S., Chen, X., Liu, Y., Zhuang, X. Y., Wang, A. C., Liu, X. M., & Zhu, S. Y. (2022) · International Endodontic Journal · doi:10.1111/iej.13721 · Cited by 46
Nature vs. nurture: FOXP3, genetics, and tissue environment shape Treg function
Raugh, A., Allard, D., & Bettini, M. (2022) · Frontiers in Immunology · doi:10.3389/fimmu.2022.911151 · Cited by 46
DNA Methylation in Regulatory T Cell Differentiation and Function: Challenges and Opportunities
Bai, L., Hao, X., Keith, J., & Feng, Y. (2022) · Biomolecules · doi:10.3390/biom12091282 · Cited by 46
“If accomplished during Treg cell development, unmethylated DNA “locks in” Foxp3 transcription and Treg cell fate, conferring remarkable resistance to the perturbations of environmental cues [27,29].”
BackgroundInfluentialGhosh, S., Roy‐Chowdhuri, S., Kang, K., Im, S., & Rudra, D. (2018) · Nature Communications · doi:10.1038/s41467-018-07018-y · Cited by 46
Decoding the role of TET family dioxygenases in lineage specification
Wu, X., Li, G., & Xie, R. (2018) · Epigenetics & Chromatin · doi:10.1186/s13072-018-0228-7 · Cited by 43
Bamezai, S., Demir, D., Pulikkottil, A. J., Ciccarone, F., Fischbein, E., Sinha, A., Borga, C., Kronnie, G. T., Meyer, L. H., Mohr, F., et al. (2020) · Leukemia · doi:10.1038/s41375-020-0864-3 · Cited by 45
Liang, Y. J., Wang, L., Ma, P., Ju, D., Zhao, M., & Shi, Y. (2023) · Frontiers in Immunology · doi:10.3389/fimmu.2023.1308264 · Cited by 42
“The demethylation of the CNS2 is dependent on the activity of Ten-eleven translocation (TET) family members and induction of TET activity has been recognized as a mechanism for promoting the function of T reg cells in autoimmune diseases (67, 68).”
BackgroundIL-2 and IL-15 dependent thymic development of Foxp3-expressing regulatory T lymphocytes
Apert, C., Romagnoli, P., & van Meerwijk, J. P. M. (2017) · Protein & Cell · doi:10.1007/s13238-017-0425-3 · Cited by 48
“CpG demethylation (or initiation of this process) in the TSDR or CNS2 of the Foxp3 gene strictly correlated with expression of this gene, yielding little insight into this question (Toker et al., 2013; Yue et al., 2016).”
BackgroundKouakanou, L., Peters, C., Sun, Q., Floess, S., Bhat, J., Huehn, J., & Kabelitz, D. (2020) · Scientific Reports · doi:10.1038/s41598-020-63572-w · Cited by 41
Regulatory T Cell Therapy of Graft-versus-Host Disease: Advances and Challenges
Hefazi, M., Bolivar-Wagers, S., & Blazar, B. R. (2021) · International Journal of Molecular Sciences · doi:10.3390/ijms22189676 · Cited by 40
Epigenetic Alterations in Cellular Immunity: New Insights into Autoimmune Diseases
Wang, Z., Lu, Q., & Wang, Z. (2017) · Cellular Physiology and Biochemistry · doi:10.1159/000457944 · Cited by 41
Whole-genome analysis of TET dioxygenase function in regulatory T cells
Yue, X., Samaniego‐Castruita, D., González‐Avalos, E., Li, X., Barwick, B. G., & Rao, A. (2021) · EMBO Reports · doi:10.15252/embr.202152716 · Cited by 37
“Both during thymic development and during iTreg differentiation, TET proteins are dispensable for the initial acquisition of FOXP3 expression, but are critical for maintaining the stability of FOXP3 expression through cell division in vitro and in vivo (Yang et al , 2015; Yue et al , 2016).”
BackgroundMethodInfluentialSelf-citation5-Hydroxymethylcytosine (5hmC), or How to Identify Your Favorite Cell
Ecsedi, S., Rodríguez‐Aguilera, J. R., & Hernández‐Vargas, H. (2018) · Epigenomes · doi:10.3390/epigenomes2010003 · Cited by 40
Epigenetic regulation and therapeutic targets in the tumor microenvironment
Xie, Z., Zhou, Z., Yang, S., Zhang, S., & Shao, B. (2023) · Molecular Biomedicine · doi:10.1186/s43556-023-00126-2 · Cited by 38
Epigenetics of CD4+ T cells in autoimmune diseases
Wang, Z., Chang, C., & Lu, Q. (2017) · Current Opinion in Rheumatology · doi:10.1097/bor.0000000000000393 · Cited by 38
Baessler, A., Novis, C. L., Shen, Z., Perovanović, J., Wadsworth, M. E., Thiede, K. A., Sircy, L. M., Harrison-Chau, M. H., Nguyen, N. X., Varley, K. E., et al. (2022) · Science Advances · doi:10.1126/sciadv.abm4982 · Cited by 37
Guo, R., Li, J., Hu, J., Fu, Q., Yan, Y., Xu, S., Wang, X., & Jiao, F. (2023) · International Immunopharmacology · doi:10.1016/j.intimp.2023.110417 · Cited by 37
Dynamic Foxp3–chromatin interaction controls tunable Treg cell function
He, M.-H., Zong, X., Xu, B., Qi, W., Huang, W., Djekidel, M. N., Zhang, Y., Pagala, V., Li, J., Hao, X., et al. (2024) · The Journal of Experimental Medicine · doi:10.1084/jem.20232068 · Cited by 38
“…expression is stabilized by specialized enhancers and epigenetic mechanisms (Feng et al., 2014; Li et al., 2021; Li et al., 2014a; Yue et al., 2019; Yue et al., 2016; Zong et al., 2021) and regulation of Foxp3 target genes ’ expression is mediated by dynamic Foxp3 – chromatin binding, control of…”
Mikami, N., Kawakami, R., Sugimoto, A., Arai, M., & Sakaguchi, S. (2025) · Science Translational Medicine · doi:10.1126/scitranslmed.adr6049 · Cited by 39
Regulation of T cell differentiation and function by epigenetic modification enzymes
Liu, H., Li, P., Wei, Z., Zhang, C., Xia, M., Du, Q., Chen, Y., Liu, N., Li, H., & Yang, X. (2019) · Seminars in Immunopathology · doi:10.1007/s00281-019-00731-w · Cited by 39
COVID-19 Is a Multi-Organ Aggressor: Epigenetic and Clinical Marks
Kgatle, M., Lawal, I. O., Mashabela, G. T., Boshomane, T. M. G., Koatale, P. C., Mahasha, P. W., Ndlovu, H., Vorster, M., Rodrigues, H. G., Zeevaart, J. R., et al. (2021) · Frontiers in Immunology · doi:10.3389/fimmu.2021.752380 · Cited by 37
Bednar, K. J., Lee, J. H., & Ort, T. (2022) · Frontiers in Immunology · doi:10.3389/fimmu.2022.932485 · Cited by 40
“Further, vitamin C potentiates TET2/3 activity to promote demethylation in TGF-b induced Tregs, again highlighting it’s important role in Treg stability (65, 66).”
BackgroundRegulatory T‐cell stability and functional plasticity in health and disease
Malviya, V., Yshii, L., Junius, S., Garg, A. D., Humblet‐Baron, S., & Schlenner, S. (2022) · Immunology and Cell Biology · doi:10.1111/imcb.12613 · Cited by 41
Zhou, Z., Xu, J., Liu, S., Lv, Y., Zhang, R., Zhou, X., Zhang, Y., Weng, S., Xu, H. W., Ba, Y., et al. (2024) · Biomarker Research · doi:10.1186/s40364-024-00630-9 · Cited by 37
“Subsequently, some research revealed that the absence of ten-eleven translocation (TET) proteins mediating the oxidation of 5-methylcytosine to achieve DNA demethylation in CNSs wasn’t sufficient to maintain Foxp3 expression and impaired peripheral Tregs [56].”
BackgroundActive DNA demethylation—The epigenetic gatekeeper of development, immunity, and cancer
Prasad, R. M., Yen, T. J., & Bellacosa, A. (2020) · Advanced Genetics · doi:10.1002/ggn2.10033 · Cited by 39
Lu, C., Wu, C.-J., Chan, C.-C., Nguyen, D. T., Lin, K.-R., Lin, S., Chen, L., Yen, J. J.-Y., & Kuo, M. (2016) · Frontiers in Immunology · doi:10.3389/fimmu.2016.00488 · Cited by 36
“Recently, DNA demethylation enzymes, the Tet family members, have been proposed to be involved in regulating FOXP3 expression (39).”
BackgroundUnravelling the molecular basis for regulatory T‐cell plasticity and loss of function in disease
Sadlon, T. J., Brown, C. Y., Bandara, V., Hope, C. M., Schjenken, J. E., Pederson, S., Breen, J., Forrest, A. R. R., Beyer, M., Robertson, S. A., et al. (2018) · Clinical & Translational Immunology · doi:10.1002/cti2.1011 · Cited by 38
Genome-wide DNA methylation analysis in renal ischemia reperfusion injury
Zhao, Y., Ding, C., Xue, W., Ding, X., Zheng, J., Gao, Y. Q., Xia, X., Li, S., Liu, J., Han, F., et al. (2017) · Gene · doi:10.1016/j.gene.2017.02.005 · Cited by 34
TET1 is an important transcriptional activator of TNFα expression in macrophages
Sun, F., Abreu‐Rodríguez, I., Ye, S., Gay, S., Distler, O., Neidhart, M., & Karouzakis, E. (2019) · PLoS ONE · doi:10.1371/journal.pone.0218551 · Cited by 34
Regulatory T Cells-Related Genes Are under DNA Methylation Influence
Piotrowska, M., Gliwiński, M., Trzonkowski, P., & Iwaszkiewicz‐Grześ, D. (2021) · International Journal of Molecular Sciences · doi:10.3390/ijms22137144 · Cited by 36
Circles of Life: linking metabolic and epigenetic cycles to immunity
Lio, C. J., & Huang, S. C. (2020) · Immunology · doi:10.1111/imm.13207 · Cited by 36
Self-citationEpigenetic remodeling by vitamin C potentiates plasma cell differentiation
Chen, H.-Y., Almonte-Loya, A., Lay, F.-Y., Hsu, M., Johnson, E. C., González‐Avalos, E., Yin, J., Bruno, R. S., Ma, Q., Ghoneim, H. E., et al. (2022) · eLife · doi:10.7554/elife.73754 · Cited by 37
“Besides enhancing neuronal and hematological differentiations in vitro (Wu and Zhang, 2017), VC facilitates the differentiation of induced regulatory T cells by potentiating TETmediated demethylation of the Foxp3 intronic enhancer CNS2 (Sasidharan Nair et al., 2016; Yue and Rao, 2020; Someya et al., 2017; Yue et al.,…”
BackgroundInfluentialSelf-citationThe role of FOXP3 in autoimmunity
Pesenacker, A. M., Cook, L. E., & Levings, M. K. (2016) · Current Opinion in Immunology · doi:10.1016/j.coi.2016.07.004 · Cited by 35
Herppich, S., Toker, A., Pietzsch, B., Kitagawa, Y., Ohkura, N., Miyao, T., Floess, S., Hori, S., Sakaguchi, S., & Huehn, J. (2019) · Frontiers in Immunology · doi:10.3389/fimmu.2019.02382 · Cited by 34
“The demethylation of the TSDR was reported to be induced by an active process involving enzymes of the Ten-Eleven-Translocation (Tet) family, which act by iterative oxidation of 5mC to 5hmC (12, 24, 32).”
BackgroundResultIamsawat, S., Daenthanasanmak, A., Voss, J. H., Nguyen, H. D., Bastian, D. A., Liu, C., & Yu, X. (2018) · The Journal of Immunology · doi:10.4049/jimmunol.1800793 · Cited by 33
DNA Methylation-Governed Gene Expression in Autoimmune Arthritis
Brandt, B., Rashidiani, S., Bán, Á., & Rauch, T. A. (2019) · International Journal of Molecular Sciences · doi:10.3390/ijms20225646 · Cited by 35
“, TETs) play an important role in the actual methylation status of intronic regulatory elements [98,99].”
BackgroundThe Role of Ten-Eleven Translocation Proteins in Inflammation
Gerecke, C., Rodrigues, C. E., Homann, T., & Kleuser, B. (2022) · Frontiers in Immunology · doi:10.3389/fimmu.2022.861351 · Cited by 36
TET proteins in natural and induced differentiation
Scott-Browne, J. P., Lio, C. J., & Rao, A. (2017) · Current Opinion in Genetics & Development · doi:10.1016/j.gde.2017.07.011 · Cited by 30
“Differentiation in the presence of vitamin C increased total 5hmC, Foxp3 expression, and loss of 5mC at Treg-specific regulatory regions that was dependent on TET proteins [28 ,73].”
Self-citationTing, H.-A., Nagata, D. D. A., Rasky, A. J., Malinczak, C., Maillard, I. P., Schaller, M. A., & Lukacs, N. W. (2018) · Mucosal Immunology · doi:10.1038/s41385-018-0052-1 · Cited by 31
Cell signaling pathways based on vitamin C and their application in cancer therapy
Fan, D., Liu, X., Shen, Z., Wu, P., Zhong, L., & Lin, F. (2023) · Biomedicine & Pharmacotherapy · doi:10.1016/j.biopha.2023.114695 · Cited by 31
Oyarce, K., Campos‐Mora, M., Gajardo, T., & Pino‐Lagos, K. (2018) · Frontiers in Immunology · doi:10.3389/fimmu.2018.00112 · Cited by 30
“In addition, it has been shown that VitC promotes demethylation of the conserved CpG-rich noncoding sequence 2, a regulatory region within the first intron of the Foxp3 gene that is crucial for maintaining stable expression of Foxp3 (35, 36).”
BackgroundResultInfluentialFoxp3 Instability Helps tTregs Distinguish Self and Non-self
Zhang, Z., & Zhou, X. (2019) · Frontiers in Immunology · doi:10.3389/fimmu.2019.02226 · Cited by 30
“Recent studies have revealed the roles of Ten-eleven translocation (TET) proteins, which can induce the demethylation of 5methylcytosine (5mC) in a cell cycle-independent way, in the demethylation of CNS2 (38).”
BackgroundInfluentialMetabolism of T Lymphocytes in Health and Disease
Gaber, T., Chen, Y., Krauß, P.-L., & Buttgereit, F. (2018) · International review of cytology · doi:10.1016/bs.ircmb.2018.06.002 · Cited by 32
Ferritin heavy chain supports stability and function of the regulatory T cell lineage
Wu, Q., Carlos, A. R., Braza, F., Bergman, M., Kitoko, J. Z., Bastos-Amador, P., Cuadrado, E., Martins, R., de Oliveira, B. S. P., Martins, V. C., et al. (2024) · The EMBO Journal · doi:10.1038/s44318-024-00064-x · Cited by 30
“…at FOXP3 CNS1 and 2 (Ohkura et al, 2012), supporting T REG cell lineage stability (Nakatsukasa et al, 2019; Wu and Zhang, 2017; Yue et al, 2019; Yue et al, 2016), and preventing T REG cell transdifferentiating into in fl ammatory effector T H cells, also referred as ex-T REG cells (Duarte et…”
InfluentialIamsawat, S., Tian, L., Daenthanasanmak, A., Wu, Y., Nguyen, H. D., Bastian, D. A., & Yu, X. (2019) · Blood Advances · doi:10.1182/bloodadvances.2019000531 · Cited by 28
Antigen-Specific Treg Therapy in Type 1 Diabetes – Challenges and Opportunities
Serr, I., Drost, F., Schubert, B., & Daniel, C. (2021) · Frontiers in Immunology · doi:10.3389/fimmu.2021.712870 · Cited by 31
“Importantly, TET proteins catalyze the first step of DNA demethylation and can thereby impact the epigenetic landscape (36).”
BackgroundShen, L., Xiao, Y., Tian, J., & Lu, Z. (2022) · Cancer Letters · doi:10.1016/j.canlet.2022.01.006 · Cited by 31
Functional Diversities of Regulatory T Cells in the Context of Cancer Immunotherapy
Gao, R., Shi, G., & Wang, J. (2022) · Frontiers in Immunology · doi:10.3389/fimmu.2022.833667 · Cited by 29
“CNS2 is demethylated in a TETdependent manner in Foxp3 iTregs (98).”
BackgroundIsola, S., Gammeri, L., Furci, F., Gangemi, S., Pioggia, G., & Allegra, A. (2024) · International Journal of Molecular Sciences · doi:10.3390/ijms25137284 · Cited by 30
“Vitamin C seems to enhance the activity of Ten eleven translocation enzymes (TETs), a family of enzymes implicated in DNA demethylation mechanisms [31].”
BackgroundRole of Tet2 in Regulating Adaptive and Innate Immunity
Li, J., Li, L., Sun, X., Deng, T., Huang, G., Li, X., Xie, Z., & Zhou, Z. (2021) · Frontiers in Cell and Developmental Biology · doi:10.3389/fcell.2021.665897 · Cited by 26
“The same result was obtained in CNS2-deficient Treg cells, and CNS1, CNS2 and other TSDRs exhibited DNA hypermethylation (Yue et al., 2016); thus, Treg cell lineage specification and endowment of a stable Treg identity were impaired.”
ResultSelf-citationCell‐intrinsic and ‐extrinsic roles of miRNAs in regulating T cell immunity
Cho, S., Dong, J., & Lu, L. (2021) · Immunological Reviews · doi:10.1111/imr.13029 · Cited by 29
Formyl peptide receptor 1 signalling promotes experimental colitis in mice
Paola, R. D., Fusco, R., Gugliandolo, E., D’Amico, R., Cordaro, M., Impellizzeri, D., Perretti, M., & Cuzzocrea, S. (2019) · Pharmacological Research · doi:10.1016/j.phrs.2019.01.041 · Cited by 27
Butyrate: a bridge between intestinal flora and rheumatoid arthritis
Cao, Y., Chen, J., Xiao, J., Hong, Y., Xu, K., & Zhu, Y. (2024) · Frontiers in Immunology · doi:10.3389/fimmu.2024.1475529 · Cited by 26
“…and immune homeostasis, which modulate the transcription of Foxp3 in the presence of the enhancer conserved non-coding sequence 1 (CNS1) to determine the differentiation of the Treg pro fi le, hence preventing autoimmunity and maintaining immune homeostasis through ampli fi cation (71).”
BackgroundVitamin C for sepsis intervention: from redox biochemistry to clinical medicine
Li, Y. R., & Zhu, H. (2021) · Molecular and Cellular Biochemistry · doi:10.1007/s11010-021-04240-z · Cited by 28
Schmidt, A., Éliás, S., Joshi, R. N., & Tegner, J. N. (2016) · Journal of Visualized Experiments · doi:10.3791/55015 · Cited by 31
Zheng, Y., Huang, L., Ge, W., Yang, M., Ma, Y., Xie, G., Wang, W., Bian, B., Li, L., Nie, H., et al. (2017) · Frontiers in Immunology · doi:10.3389/fimmu.2017.00596 · Cited by 26
“Foxp3 is the lineage fate-determining factor of naturally occurring Tregs (nTregs), and Tregs with the high immunosuppressive activity needs high level of Foxp3 expression and its stability (19, 20).”
BackgroundEpigenetic regulation of T helper cells and intestinal pathogenicity
Hagihara, Y., Yoshimatsu, Y., Mikami, Y., Takada, Y., Mizuno, S., & Kanai∥, T. (2019) · Seminars in Immunopathology · doi:10.1007/s00281-019-00732-9 · Cited by 25
Regulatory T Cells: Pathophysiological Roles and Clinical Applications
Sakai, R., Komai, K., Iizuka-Koga, M., Yoshimura, A., & Ito, M. (2019) · The Keio Journal of Medicine · doi:10.2302/kjm.2019-0003-oa · Cited by 25
Tan, L., Qiu, T. H., Xiang, R., Cao, C., Deng, Y., Tao, Z., & Xu, Y. (2019) · Life Sciences · doi:10.1016/j.lfs.2019.117101 · Cited by 25
miRNA Regulation of T Cells in Islet Autoimmunity and Type 1 Diabetes
Scherm, M. G., & Daniel, C. (2020) · Current Diabetes Reports · doi:10.1007/s11892-020-01325-9 · Cited by 27
Repurposing Vitamin C for Cancer Treatment: Focus on Targeting the Tumor Microenvironment
Li, W.-N., Zhang, S.-J., Feng, J.-Q., & Jin, W. (2022) · Cancers · doi:10.3390/cancers14112608 · Cited by 30
“CD4+ Tregs cells cell line and animal 100 μg/mL (in vitro) DNA demethylation VitC was shown to enhance the expression and stability of Foxp3+ markers in a TET2/3-dependent manner during iTregs cell differentiation [19]”
BackgroundRegulatory T Cells: Liquid and Living Precision Medicine for the Future of VCA
Kauke‐Navarro, M., Knoedler, S. A., Panayi, A. C., Knoedler, L., Noel, O. F., & Pomahač, B. (2022) · Transplantation · doi:10.1097/tp.0000000000004342 · Cited by 27
“Vitamin C yields similar effects in preventing the loss of Foxp3 expression but acts via demethylation of the CNS2 region‚ which is orchestrated by the Tet enzyme family.(46) Although Foxp3 occupies a key position in Treg function, Treg-specific epigenetic changes (eg, CpG demethylation and histone modification) ensur…”
BackgroundCRISPRa-mediated FOXP3 gene upregulation in mammalian cells
Forstnerič, V., Oven, I., Ogorevc, J., Lainšček, D., Praznik, A., Lebar, T., Jerala, R., & Horvat, S. (2019) · Cell & Bioscience · doi:10.1186/s13578-019-0357-0 · Cited by 25
“Regions named CNS1–3, Core promoter, Cage1 and Cage2 were identified (vertical broken gray lines) and targeted by sgRNA–dCas9VPR or sgRNA-dCas9-KRAB fusions.”
BackgroundInfluentialBATF is Required for Treg Homeostasis and Stability to Prevent Autoimmune Pathology
Khatun, A., Wu, X., Fu, Q., Gai, K., Kharel, A., Kudek, M. R., Fraser, L. M., Ceicko, A., Kasmani, M. Y., Majnik, A. V., et al. (2023) · Advanced Science · doi:10.1002/advs.202206692 · Cited by 23
Hu, Y., Zhao, Q., Dai, H., Wu, Y., Tang, X., Zhang, N., Jiang, H., Rui, H., & Liu, B. (2025) · Frontiers in Immunology · doi:10.3389/fimmu.2025.1687755 · Cited by 26
Chen, S., Zhang, L., Ying, Y., Wang, Y., Arnold, P. R., Wang, G., Li, J., Ghobrial, R. M., Chen, W., Xiao, X., et al. (2020) · American Journal of Transplantation · doi:10.1111/ajt.15845 · Cited by 24
Self-citationAscorbic Acid Promotes KIR Demethylation during Early NK Cell Differentiation
Wu, C., Zhang, B., Kim, H., Anderson, S. K., Miller, J. S., & Cichocki, F. M. (2020) · The Journal of Immunology · doi:10.4049/jimmunol.2000212 · Cited by 25
Brown, C. Y., Sadlon, T. J., Hope, C. M., Wong, Y. Y., Wong, S. W., Liu, N., Withers, H., Brown, K. A., Bandara, V., Gundsambuu, B., et al. (2020) · Frontiers in Immunology · doi:10.3389/fimmu.2020.01269 · Cited by 25
Structure and Function of TET Enzymes
Yin, X., Hu, L., & Xu, Y. (2022) · Advances in experimental medicine and biology · doi:10.1007/978-3-031-11454-0_10 · Cited by 24
Wilk, C., Effenberg, L., Abberger, H., Steenpaß, L., Hansen, W., Zeschnigk, M., Kirschning, C. J., Buer, J., & Kehrmann, J. (2021) · Cellular Immunology · doi:10.1016/j.cellimm.2021.104471 · Cited by 24
Gao, X., Song, Y., Du, P., Yang, S. C., Cui, H., Lu, S., Hu, L., Liu, L., Jia, S., & Zhao, M. (2022) · International Immunopharmacology · doi:10.1016/j.intimp.2022.108578 · Cited by 22
Mahmud, A. A., Siddiqui, S. A., Karim, M. R., Al-Mamun, M. R., Akhter, S., Sohel, M., Hasan, M., Bellah, S. F., & Amin, M. N. (2023) · Heliyon · doi:10.1016/j.heliyon.2023.e15292 · Cited by 22
O-GlcNAcylation and immune cell signaling: A review of known and a preview of unknown
Ramakrishnan, P. (2024) · Journal of Biological Chemistry · doi:10.1016/j.jbc.2024.107349 · Cited by 23
“The TET family of proteins was shown to play critical roles in CD4 + T cell differentiation (106) and stabilize FOXP3 expression in Treg cells (107).”
BackgroundNavigating T-Cell Immunometabolism in Transplantation
Tanimine, N., Turka, L. A., & Priyadharshini, B. (2017) · Transplantation · doi:10.1097/tp.0000000000001951 · Cited by 23
Therapeutic Potential of Gene-Modified Regulatory T Cells: From Bench to Bedside
Chae, W., & Bothwell, A. L. M. (2018) · Frontiers in Immunology · doi:10.3389/fimmu.2018.00303 · Cited by 22
Alvarez-Salazar, E. K., Cortés-Hernández, A., Arteaga-Cruz, S., Alberú, J., & Soldevila, G. (2020) · Frontiers in Immunology · doi:10.3389/fimmu.2020.00375 · Cited by 21
“In this context, recent reports have shown that is possible to increase the demethylation status of the TSDR region by adding vitamin C to iTreg cultures (56, 57), which was reported to be an activator of TET enzymes, which, in turn, control the stability of FOXP3 (47).”
BackgroundVincenzetti, L., Leoni, C., Chirichella, M., Kwee, I., & Monticelli, S. (2019) · European Journal of Immunology · doi:10.1002/eji.201847967 · Cited by 21
Reprogramming of Th1 cells into regulatory T cells through rewiring of the metabolic status
Kanamori, M., Nakatsukasa, H., Ito, M., Chikuma, S., & Yoshimura, A. (2018) · International Immunology · doi:10.1093/intimm/dxy043 · Cited by 21
Äijö, T., Yue, X., Rao, A., & Lähdesmäki, H. J. (2016) · Bioinformatics · doi:10.1093/bioinformatics/btw468 · Cited by 22
Self-citationRedox regulation of regulatory T-cell differentiation and functions
Patwardhan, R. S., Singh, B., Pal, D., Checker, R., Bandekar, M., Sharma, D., & Sandur, S. K. (2020) · Free Radical Research · doi:10.1080/10715762.2020.1745202 · Cited by 21
“Demethylation reinforces FoxP3 expression during Treg cell division [34].”
BackgroundTGF‐β1 signaling and Smad7 control T‐cell responses in health and immune‐mediated disorders
Laudisi, F., Stolfi, C., Monteleone, I., & Monteleone, G. (2023) · European Journal of Immunology · doi:10.1002/eji.202350460 · Cited by 22
“For example, vitamin C has been shown to increase Foxp3 expression stability in TGF-β -induced iTregs and favors Treg differentiation with a gene signature similar to that of pTregs [59, 60].”
ResultBaessler, A., Fuchs, B., Perkins, B., Richens, A. W., Novis, C. L., Harrison-Chau, M. H., Sircy, L. M., Thiede, K. A., & Hale, J. S. (2023) · Proceedings of the National Academy of Sciences · doi:10.1073/pnas.2218324120 · Cited by 17
Yamada, T., Nabe, S., Toriyama, K., Suzuki, J., Inoue, K., Imai, Y., Shiraishi, A., Takenaka, K., Yasukawa, M., & Yamashita, M. (2019) · The Journal of Immunology · doi:10.4049/jimmunol.1801083 · Cited by 17
“differentiation, although aKG may induce differentiation via tet enzyme activity because DNA demethylation is known to be related to T cell differentiation (40, 41).”
BackgroundLi, J., Sha, J., Sun, L., Zhu, D., & Meng, C. (2021) · Journal of Immunology Research · doi:10.1155/2021/5590217 · Cited by 19
“In somatic cells, this modification is typically found in dinucleotide CpG islands [17].”
BackgroundCameron, J. J., Martino, P. A., Nguyen, L., & Li, X. J. (2020) · The Journal of Immunology · doi:10.4049/jimmunol.2000537 · Cited by 18
“Insufficient CNS2 demethylation in differentiating Tregs despite sustained and high levels of Foxp3-transcriptional activation could result in Treg lineage instability (13).”
BackgroundSelf-citationFoxp3 enhancers synergize to maximize regulatory T cell suppressive capacity
Zong, X., Hao, X., Xu, B., Crawford, J. C., Wright, S., Li, J., Zhang, Y., Bai, L., He, M.-H., Jiang, M., et al. (2021) · The Journal of Experimental Medicine · doi:10.1084/jem.20202415 · Cited by 18
Arnold, P. R., Wen, M., Zhang, L., Ying, Y., Xiao, X., Chu, X., Wang, G., Zhang, X., Mao, Z., Zhang, A., et al. (2022) · Frontiers in Immunology · doi:10.3389/fimmu.2022.966364 · Cited by 16
“TET enzymes have been shown to be essential for demethylation of the CNS2 region and the resultant FOXP3 stability (10, 11).”
BackgroundSelf-citationPromises and Pitfalls of Next-Generation Treg Adoptive Immunotherapy
Christofi, P., Pantazi, C., Psatha, N., Sakellari, I., Yannaki, E., & Παπαδοπούλου, Α. (2023) · Cancers · doi:10.3390/cancers15245877 · Cited by 18
Candía, E., Reyes, P., Covián, C., Rodriguez, F., Wainstein, N., Morales, J., Mosso, C., Rosemblatt, M. S., & Fierro, J. A. (2017) · PLoS ONE · doi:10.1371/journal.pone.0182009 · Cited by 19
Wakamatsu, E., Omori, H., Kawano, A., Ogawa, S., & Abe, R. (2018) · Biochemical and Biophysical Research Communications · doi:10.1016/j.bbrc.2018.07.021 · Cited by 18
Wilkinson, D. S., Ghosh, D., Nickle, R. A., Moorman, C. D., & Mannie, M. D. (2017) · Frontiers in Immunology · doi:10.3389/fimmu.2017.01782 · Cited by 18
Godoy, G. J., Olivera, C., Paira, D. A., Salazar, F. C., Ana, Y., Stempin, C. C., Motrich, R. D., & Rivero, V. E. (2019) · Frontiers in Immunology · doi:10.3389/fimmu.2019.02665 · Cited by 18
“The stability of Foxp3 expression has been shown to be associated with DNA hypomethylation at specific CpG-containing regions of the foxp3 locus, in particular the CNS2 region (56), which is crucial to stabilize Foxp3 expression (57).”
BackgroundLi, P., Han, M., Zhao, X., Ren, G., Mei, S., & Zhong, C. (2022) · Cells · doi:10.3390/cells11111767 · Cited by 17
“Though depleting either Tet2 or Tet3 does not significantly impact Foxp3 expression, depleting them both leads to severely impaired Treg differentiation and stability [23].”
BackgroundAntioxidant Roles/Functions of Ascorbic Acid (Vitamin C)
Agwu, E., Ezihe, C. O., & Kaigama, G. (2023) · IntechOpen eBooks · doi:10.5772/intechopen.110589 · Cited by 23
Metadata
- Authors
- Yue, X., Trifari, S., Äijö, T., Tsagaratou, A., Pastor, W. A., Zepeda-Martínez, J. A., Lio, C.-W. J., Li, X., Huang, Y., Vijayanand, P., Lähdesmäki, H., & Rao, A.
- Affiliations
- La Jolla Institute for Immunology (US)
- Aalto University (FI)
- Corresponding author
- Rao, Anjana
- ORCID
- Venue
- Journal of Experimental Medicine
- Publisher
- Rockefeller University Press
- Published
- 2016-02-22
- Volume
- 213
- Issue
- 3
- Pages
- 377-397
- ISSN
- 0022-1007 (ISSN-L)
- 1540-9538
- PMC
- PMC4813667
- OpenAlex
- W2287054877
- Cited by
- 355
- References
- 60
- Citations by year
- 2026: 34 · 2025: 23 · 2024: 29 · 2023: 33 · 2022: 34 · 2021: 41 · 2020: 39 · 2019: 43 · 2018: 27 · 2017: 38 · 2016: 12
- FWCI
- 24.21
- Type
- journal article
- Language
- en
- Open access
- bronze
- doi.org
- Locations
- The Journal of Experimental Medicine (publishedVersion)
- PubMed Central (publishedVersion, cc-by-nc-sa)
- PubMed (publishedVersion)
- ePrints Soton (University of Southampton) (acceptedVersion)
- Aaltodoc (Aalto University) (submittedVersion, cc-by-nc-sa)
- Funders
- National Institutes of Health (AI44432, CA151535, HL114093)
- Leukemia and Lymphoma Society (LLS TRP 6464-15)
- Academy of Finland
- Cancer Research Institute
- National Science Foundation
- California Institute for Regenerative Medicine, University of California, San Diego (TG2-01154)
- Topics
- Life Sciences › Immunology and Microbiology › Immunology › T-cell and B-cell Immunology
- Life Sciences › Biochemistry, Genetics and Molecular Biology › Molecular Biology › Epigenetics and DNA Methylation
- Life Sciences › Biochemistry, Genetics and Molecular Biology › Molecular Biology › Genomics and Chromatin Dynamics
- Keywords
- Foxp3 stability, TET enzymes, TET2, TET3, regulatory T cells, DNA demethylation, 5-hydroxymethylcytosine, 5-methylcytosine, vitamin C, transcriptional regulation, small molecule activators
- MeSH terms
- Animals, Ascorbic Acid, Cell Differentiation, Cytosine, DNA-Binding Proteins, Humans, Male, Proto-Oncogene Proteins, DNA Methylation, 5-Methylcytosine, Dioxygenases, T-Lymphocytes, Regulatory, Mice, Forkhead Transcription Factors, Protein Stability, HEK293 Cells
About these checks
Registry, retraction, Cites and statistics results are computed, not judged, with one exception: a printed reference that no index lists is read once by a model before it counts as a citation error. Claims are extracted by a model and kept only when their quote appears verbatim in the text; each cited source is then checked, with a model’s help, for whether it says what the claim relies on. Those verdicts can be wrong — read the claim’s quote and the cited source before relying on one.
Statistics and arithmetic are recomputed, not judged.
Confidence bands are shown only for fields calibrated on our annotated test set. None is calibrated yet, so no band is shown.
What counts as a claim ›How we measure confidence ›How we check this ›
Are you an author, or do you see a problem with this page? Request a review
