

The DOI matches its Crossref record; 46 of the 46 references it cites were found in a registry or an index.
Inhibiting antibiotic-resistant Enterobacteriaceae by microbiota-mediated intracellular acidification
Open accessAbstract
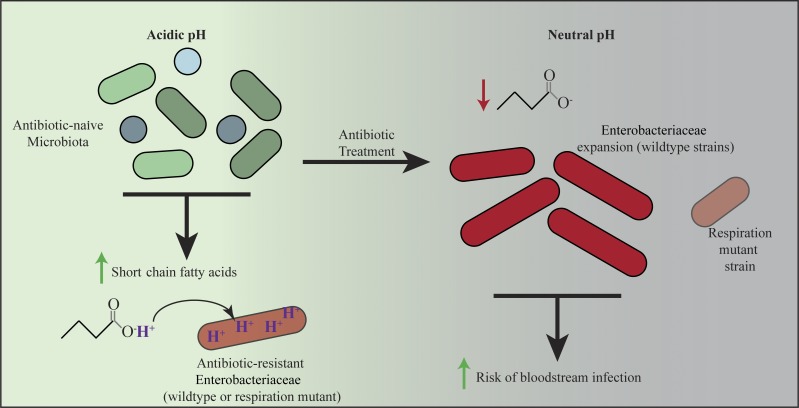
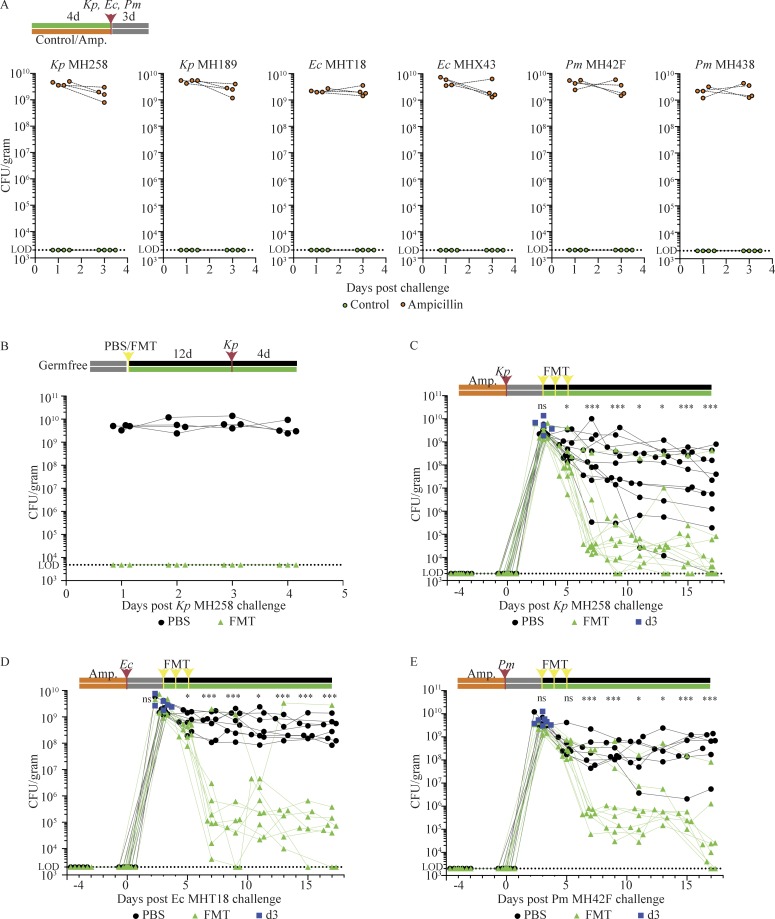
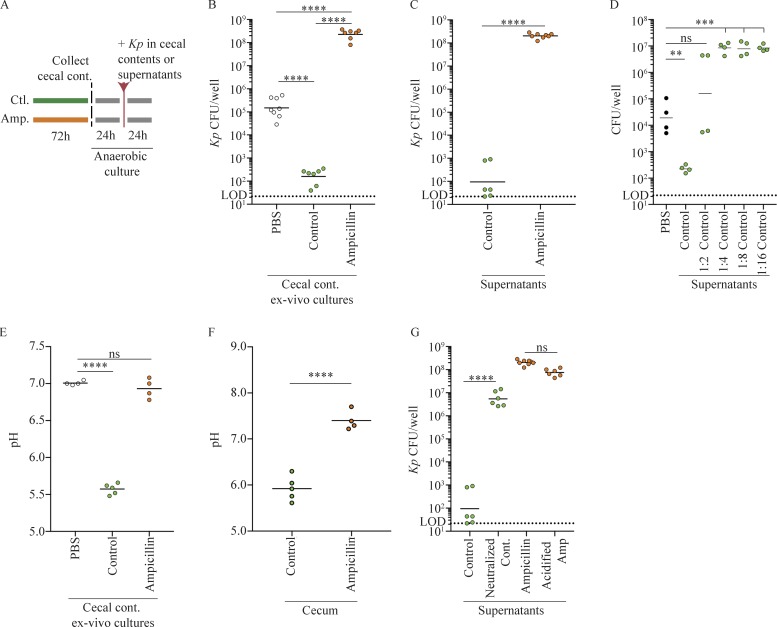
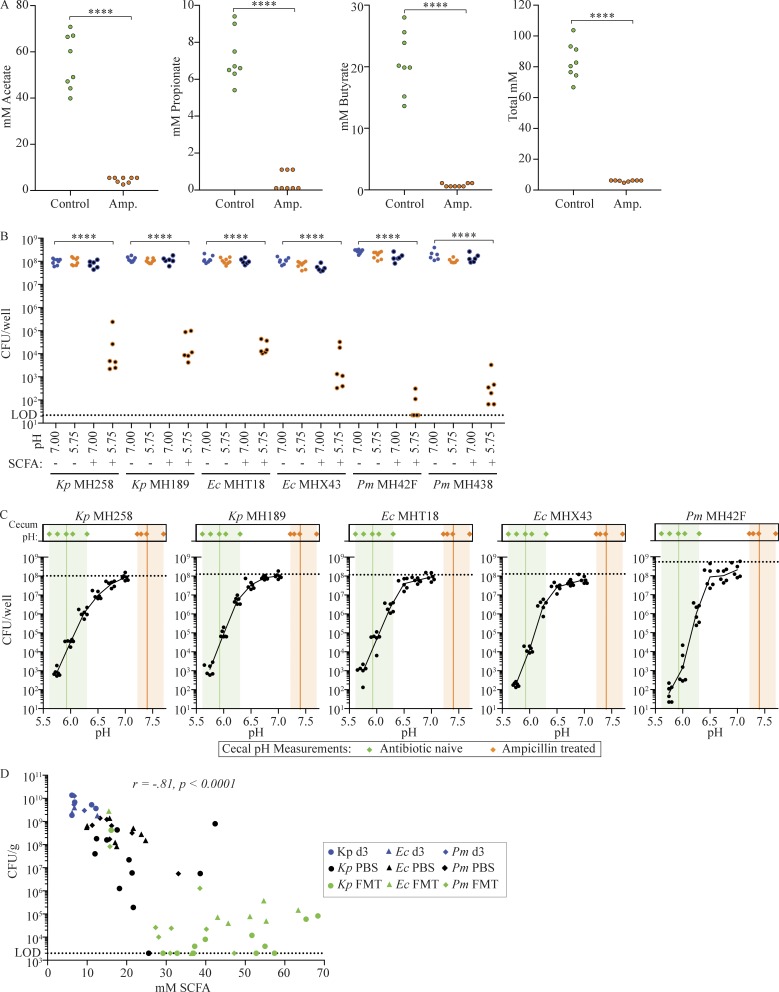
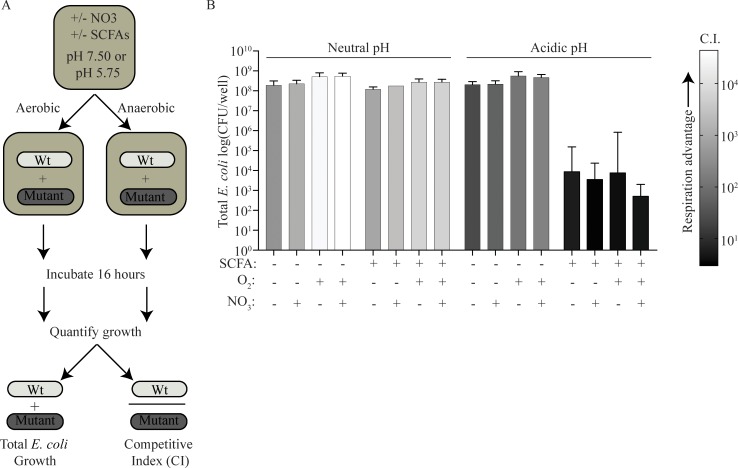
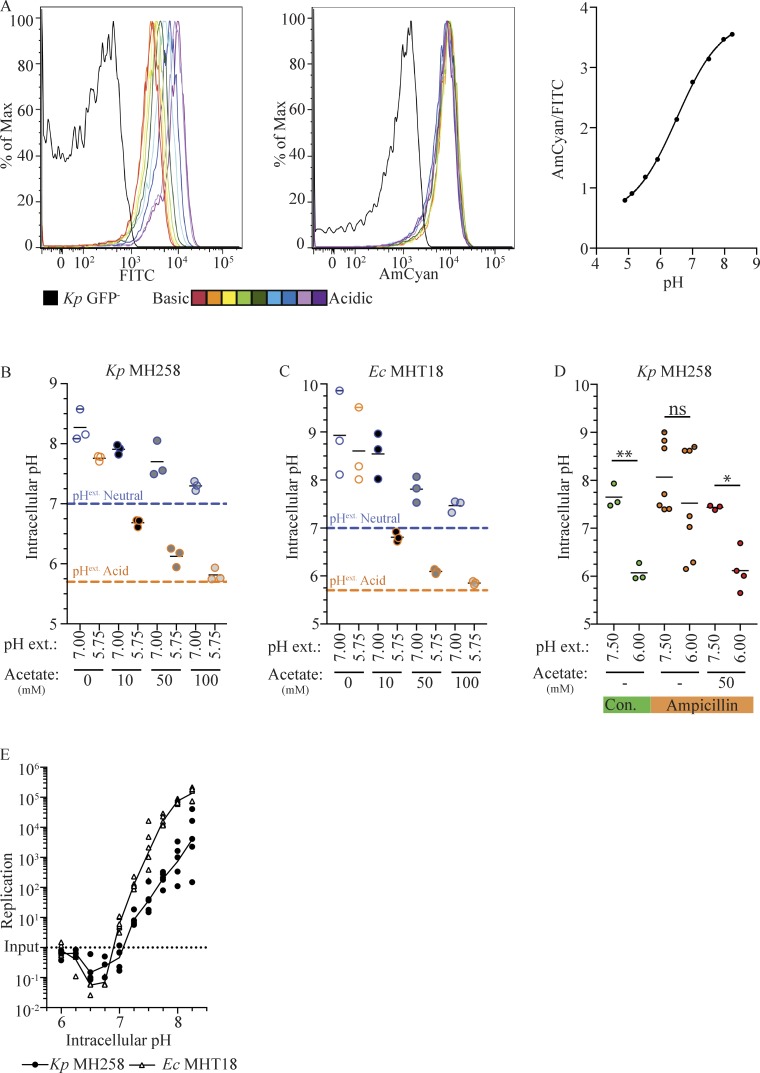
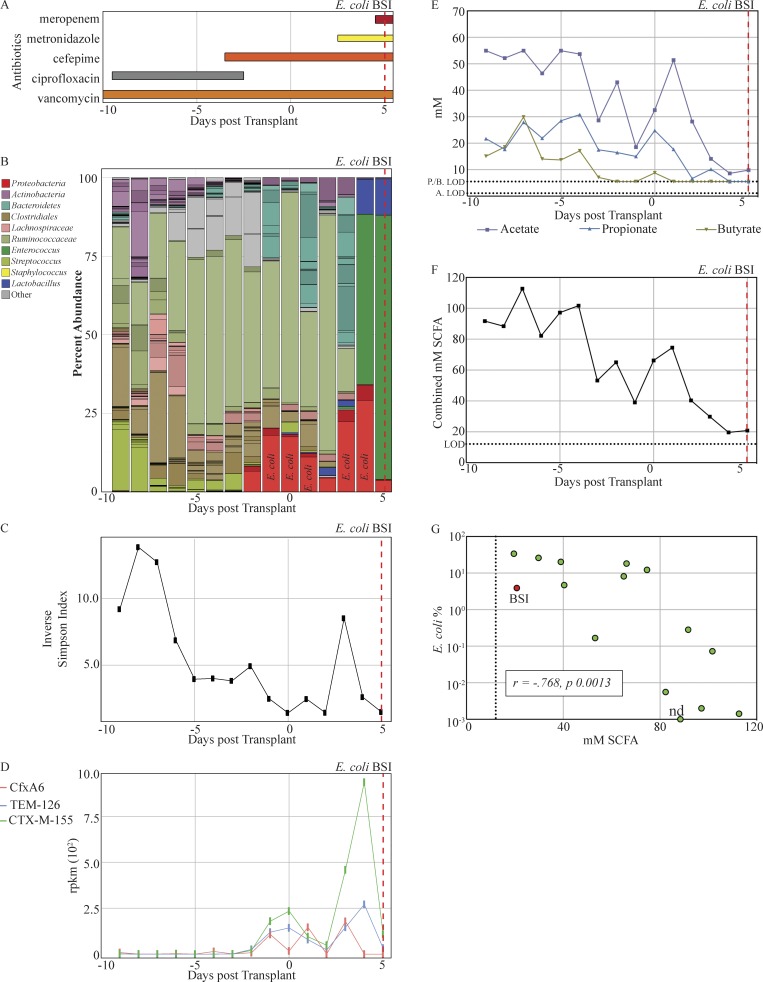
Klebsiella pneumoniae, Escherichia coli, and other members of the Enterobacteriaceae family are common human pathogens that have acquired broad antibiotic resistance, rendering infection by some strains virtually untreatable. Enterobacteriaceae are intestinal residents, but generally represent <1% of the adult colonic microbiota. Antibiotic-mediated destruction of the microbiota enables Enterobacteriaceae to expand to high densities in the colon, markedly increasing the risk of bloodstream invasion, sepsis, and death. Here, we demonstrate that an antibiotic-naive microbiota suppresses growth of antibiotic-resistant clinical isolates of Klebsiella pneumoniae, Escherichia coli, and Proteus mirabilis by acidifying the proximal colon and triggering short chain fatty acid (SCFA)–mediated intracellular acidification. High concentrations of SCFAs and the acidic environment counter the competitive edge that O2 and NO3 respiration confer upon Enterobacteriaceae during expansion. Reestablishment of a microbiota that produces SCFAs enhances clearance of Klebsiella pneumoniae, Escherichia coli, and Proteus mirabilis from the intestinal lumen and represents a potential therapeutic approach to enhance clearance of antibiotic-resistant pathogens.
Overview
The claims and statistics of this paper haven’t been checked yet.
Run the check — free, no account needed. It reads the open-access text and checks the sources it cites.
Integrity signals
Registry
Cites
Statistics
Figures
Verification
Claims the paper makes
The claims and statistics of this paper haven’t been checked yet.
Run the check — free, no account needed. It reads the open-access text and checks the sources it cites.
Claims other papers make about this one
Each is checked against this paper’s own text: does it say what the citing paper says it does?
In the citing paper
“Moreover, Enterobacteriaceae expansion in the gut significantly increases the risk of bloodstream invasion, sepsis, and death (28).”
From Sepsis-Induced Gut Dysbiosis Mediates the Susceptibility to Sepsis-Associated Encephalopathy in Mice (2022) · cites this paper as [28]
In the citing paper
“For example, nonionized SCFAs can diffuse across the bacterial membrane and into the cytoplasm, where they dissociate into their ionized forms, lowering the intracellular pH and inhibiting the growth of susceptible bacteria, including antibiotic-resistant Enterobacteriaceae [37].”
From Role of the gut microbiota in nutrient competition and protection against intestinal pathogen colonization (2023) · cites this paper as [37]
Self-check
Percentages, sums and reported differences re-computed from the paper’s own numbers.
The self-check needs the paper’s full text.
Citations
Cites
phyloseq: An R Package for Reproducible Interactive Analysis and Graphics of Microbiome Census Data
McMurdie, P. J., & Holmes, S. (2013) · PLoS ONE · doi:10.1371/journal.pone.0061217 · Cited by 21,942
UPARSE: highly accurate OTU sequences from microbial amplicon reads
Edgar, R. C. (2013) · Nature Methods · doi:10.1038/nmeth.2604 · Cited by 16,770
Structure, function and diversity of the healthy human microbiome
The Human Microbiome Project Consortium (2012) · Nature · doi:10.1038/nature11234 · Cited by 11,726
Ultra-high-throughput microbial community analysis on the Illumina HiSeq and MiSeq platforms
Caporaso, J. G., Lauber, C. L., Walters, W. A., Berg-Lyons, D., Huntley, J., Fierer, N., Owens, S. M., Betley, J., Fraser, L., Bauer, M., et al. (2012) · The ISME Journal · doi:10.1038/ismej.2012.8 · Cited by 8,839
den Besten, G., van Eunen, K., Groen, A. K., Venema, K., Reijngoud, D.-J., & Bakker, B. M. (2013) · Journal of Lipid Research · doi:10.1194/jlr.r036012 · Cited by 5,048
Topping, D. L., & Clifton, P. M. (2001) · Physiological Reviews · doi:10.1152/physrev.2001.81.3.1031 · Cited by 3,091
CARD 2017: expansion and model-centric curation of the comprehensive antibiotic resistance database
Jia, B., Raphenya, A. R., Alcock, B. P., Waglechner, N., Guo, P., Tsang, K. K., Lago, B. A., Dave, B. M., Pereira, S. K., Sharma, A. N., et al. (2016) · Nucleic Acids Research · doi:10.1093/nar/gkw1004 · Cited by 2,686
MetaPhlAn2 for enhanced metagenomic taxonomic profiling
Truong, D. T., Franzosa, E. A., Tickle, T. L., Scholz, M., Weingart, G., Pasolli, E., Tett, A., Huttenhower, C., & Segata, N. (2015) · Nature Methods · doi:10.1038/nmeth.3589 · Cited by 2,185
Kelly, C. J., Zheng, L., Campbell, E. L., Saeedi, B., Scholz, C. C., Bayless, A. J., Wilson, K. E., Glover, L. E., Kominsky, D. J., Magnuson, A., et al. (2015) · Cell Host & Microbe · doi:10.1016/j.chom.2015.03.005 · Cited by 1,716
Microbiota-mediated colonization resistance against intestinal pathogens
Buffie, C. G., & Pamer, E. G. (2013) · Nature reviews. Immunology · doi:10.1038/nri3535 · Cited by 1,564
Self-citation
Cited by
Sorted by citations
Defining and combating antibiotic resistance from One Health and Global Health perspectives
Hernando‐Amado, S., Coque, T. M., Baquero, F., & Martínez, J. L. (2019) · Nature Microbiology · doi:10.1038/s41564-019-0503-9 · Cited by 1,290
Microbiota-mediated colonization resistance: mechanisms and regulation
Caballero-Flores, G., Pickard, J. M., & Núñez, G. (2023) · Nature Reviews Microbiology · doi:10.1038/s41579-022-00833-7 · Cited by 474
Sorbara, M. T., & Pamer, E. G. (2022) · Nature Reviews Microbiology · doi:10.1038/s41579-021-00667-9 · Cited by 468
Self-citationSorbara, M. T., Littmann, E. R., Fontana, E., Moody, T. U., Kohout, C. E., Gjonbalaj, M., Eaton, V. P., Seok, R., Leiner, I. M., & Pamer, E. G. (2020) · Cell Host & Microbe · doi:10.1016/j.chom.2020.05.005 · Cited by 413
Self-citationMining the microbiota for microbial and metabolite-based immunotherapies
Skelly, A. N., Sato, Y., Kearney, S., & Honda, K. (2019) · Nature Reviews Immunology · doi:10.1038/s41577-019-0144-5 · Cited by 306
Hou, H., Chen, D., Zhang, K., Zhang, W., Liu, T., Wang, S., Dai, X., Wang, B., Zhong, W., & Cao, H. (2021) · Cancer Letters · doi:10.1016/j.canlet.2021.11.027 · Cited by 274
Zhang, Z., Tang, H., Chen, P., Xie, H., & Tao, Y. (2019) · Signal Transduction and Targeted Therapy · doi:10.1038/s41392-019-0074-5 · Cited by 263
Microbiota in inflammatory bowel disease: mechanisms of disease and therapeutic opportunities
Iliev, I. D., Ananthakrishnan, A. N., & Guo, C.-J. (2025) · Nature Reviews Microbiology · doi:10.1038/s41579-025-01163-0 · Cited by 249
The spread of antibiotic resistance to humans and potential protection strategies
Ding, D., Wang, B., Zhang, X., Zhang, J., Zhang, H., Liu, X., Gao, Z., & Yu, Z. (2023) · Ecotoxicology and Environmental Safety · doi:10.1016/j.ecoenv.2023.114734 · Cited by 239
Salmonella versus the Microbiome
Rogers, A. W. L., Tsolis, R. M., & Bäumler, A. J. (2020) · Microbiology and Molecular Biology Reviews · doi:10.1128/mmbr.00027-19 · Cited by 207
Self-citationOsbelt, L., Wende, M., Almási, É. D. H., Derksen, E., Muthukumarasamy, U., Lesker, T. R., Gálvez, E. J. C., Pils, M. C., Schalk, E., Chhatwal, P., et al. (2021) · Cell Host & Microbe · doi:10.1016/j.chom.2021.09.003 · Cited by 153
Stoma, I., Littmann, E. R., Peled, J. U., Giralt, S., van den Brink, M. R. M., Pamer, E. G., & Taur, Y. (2021) · Clinical Infectious Diseases · doi:10.1093/cid/ciaa068 · Cited by 142
Self-citationCommensal consortia decolonize Enterobacteriaceae via ecological control
Furuichi, M., Kawaguchi, T., Pust, M., Yasuma-Mitobe, K., Plichta, D. R., Hasegawa, N., Ohya, T., Bhattarai, S. K., Sasajima, S., Aoto, Y., et al. (2024) · Nature · doi:10.1038/s41586-024-07960-6 · Cited by 144
Sequeira, R. P., McDonald, J. A. K., Marchesi, J. R., & Clarke, T. B. (2020) · Nature Microbiology · doi:10.1038/s41564-019-0640-1 · Cited by 136
Intestinal colonization resistance in the context of environmental, host, and microbial determinants
Woelfel, S., Silva, M. S., & Stecher, B. (2024) · Cell Host & Microbe · doi:10.1016/j.chom.2024.05.002 · Cited by 151
Lucafò, M., Curci, D., Franzin, M., Decorti, G., & Stocco, G. (2021) · Frontiers in Pharmacology · doi:10.3389/fphar.2021.772101 · Cited by 130
Huang, G., Wang, Z., Wu, G., Zhang, R., Dong, L., Huang, F., Zhang, M., & Su, D. (2021) · Journal of Agricultural and Food Chemistry · doi:10.1021/acs.jafc.0c07407 · Cited by 117
Woodworth, M. H., Conrad, R. E., Haldopoulos, M. E., Pouch, S. M., Babiker, A., Mehta, A. K., Sitchenko, K. L., Wang, C. H., Strudwick, A. F., Ingersoll, J., et al. (2023) · Science Translational Medicine · doi:10.1126/scitranslmed.abo2750 · Cited by 118
Bajic, D., Niemann, A., Hillmer, A.-K., Mejías‐Luque, R., Bluemel, S., Docampo, M. D., Funk, M. C., Tonin, E., Boutros, M., Schnabl, B., et al. (2020) · Journal of Crohn s and Colitis · doi:10.1093/ecco-jcc/jjaa065 · Cited by 118
Rapid transcriptional and metabolic adaptation of intestinal microbes to host immune activation
Becattini, S., Sorbara, M. T., Kim, S. G., Littmann, E. R., Dong, Q., Walsh, G., Wright, R. J., Amoretti, L. A., Fontana, E., Hohl, T. M., et al. (2021) · Cell Host & Microbe · doi:10.1016/j.chom.2021.01.003 · Cited by 106
Self-citationRole of short‐chain fatty acids in host physiology
Liu, M., Lu, Y., Xue, G., Han, L., Jia, H., Wang, Z., Zhang, J., Liu, P., Yang, C., & Zhou, Y. (2024) · Animal Models and Experimental Medicine · doi:10.1002/ame2.12464 · Cited by 120
Horrocks, V., King, O. G., Yip, A. Y. G., Marques, I. M., & McDonald, J. A. K. (2023) · Microbiology · doi:10.1099/mic.0.001377 · Cited by 104
Xenosiderophore Utilization Promotes Bacteroides thetaiotaomicron Resilience during Colitis
Zhu, W., Winter, M. G., Spiga, L., Hughes, E. R., Chanin, R. B., Mulgaonkar, A., Pennington, J., Maas, M., Behrendt, C. L., Kim, J., et al. (2020) · Cell Host & Microbe · doi:10.1016/j.chom.2020.01.010 · Cited by 107
Karnwal, A., Jassim, A. Y., Mohammed, A. A., Al-Tawaha, A. R., Selvaraj, M., & Malik, T. (2025) · Frontiers in Microbiology · doi:10.3389/fmicb.2025.1517772 · Cited by 119
Osbelt, L., Thiemann, S., Smit, N., Lesker, T. R., Schröter, M., Gálvez, E. J. C., Schmidt‐Hohagen, K., Pils, M. C., Mühlen, S., Dersch, P., et al. (2020) · PLoS Pathogens · doi:10.1371/journal.ppat.1008448 · Cited by 106
Yip, A. Y. G., King, O. G., Omelchenko, O., Kurkimat, S., Horrocks, V., Mostyn, P., Danckert, N., Ghani, R., Satta, G., Jauneikaite, E., et al. (2023) · doi:10.1101/2023.03.25.533086 · Cited by 91
Zhang, S., Dogan, B., Guo, C., Herlekar, D., Stewart, K., Scherl, E., & Simpson, K. W. (2020) · Antibiotics · doi:10.3390/antibiotics9080462 · Cited by 90
Lou, X., Xue, J., Shao, R., Yang, Y., Ning, D., Mo, C., Wang, F., & Chen, G. (2023) · Frontiers in Immunology · doi:10.3389/fimmu.2022.1063543 · Cited by 87
Sepsis-Induced Gut Dysbiosis Mediates the Susceptibility to Sepsis-Associated Encephalopathy in Mice
Fang, H., Wang, Y., Deng, J., Zhang, H., Wu, Q., He, L., Xu, J., Shao, X., Ouyang, X., He, Z., et al. (2022) · mSystems · doi:10.1128/msystems.01399-21 · Cited by 87
“Moreover, Enterobacteriaceae expansion in the gut significantly increases the risk of bloodstream invasion, sepsis, and death (28).”
BackgroundSite-specific acylation of a bacterial virulence regulator attenuates infection
Zhang, Z. J., Pedicord, V. A., Peng, T., & Hang, H. C. (2019) · Nature Chemical Biology · doi:10.1038/s41589-019-0392-5 · Cited by 86
Button, J. E., Autran, C. A., Reens, A. L., Cosetta, C. M., Smriga, S., Ericson, M. E., Pierce, J. V., Cook, D. N., Lee, M. L., Sun, A. K., et al. (2022) · Cell Host & Microbe · doi:10.1016/j.chom.2022.04.001 · Cited by 86
Djukovic, A., Garzón, M. J., Canlet, C., Cabral, V., Lalaoui, R., García-Garcerá, M., Rechenberger, J., Tremblay-Franco, M., Peñaranda, I., Puchades-Carrasco, L., et al. (2022) · Nature Communications · doi:10.1038/s41467-022-33313-w · Cited by 85
Park, S.-Y., Rao, C., Coyte, K. Z., Kuziel, G. A., Zhang, Y., Huang, W., Franzosa, E. A., Weng, J., Huttenhower, C., & Rakoff-Nahoum, S. (2022) · Cell · doi:10.1016/j.cell.2022.01.002 · Cited by 85
Xiao, S., Jiang, S., Qian, D., & Duan, J. (2019) · Applied Microbiology and Biotechnology · doi:10.1007/s00253-019-10312-4 · Cited by 89
Sencio, V., Gallerand, A., Machado, M. G., Deruyter, L., Heumel, S., Soulard, D., Barthelemy, J., Cuinat, C., Vieira, A. T., Barthélémy, A., et al. (2021) · Infection and Immunity · doi:10.1128/iai.00734-20 · Cited by 87
Magruder, M. L., Edusei, E., Zhang, L., Albakry, S., Satlin, M. J., Westblade, L. F., Malha, L. P., Sze, C., Lubetzky, M., Dadhania, D. M., et al. (2020) · Gut Microbes · doi:10.1080/19490976.2020.1805281 · Cited by 83
Guern, R. L., Grandjean, T., Stabler, S., Bauduin, M., Gosset, P., Kipnis, É., & Dessein, R. (2023) · Nature Communications · doi:10.1038/s41467-022-35767-4 · Cited by 85
Fang, H., Fang, M., Wang, Y., Zhang, H., Li, J., Chen, J., Wu, Q., He, L., Xu, J., Deng, J. H., et al. (2022) · Microbiology Spectrum · doi:10.1128/spectrum.00125-22 · Cited by 76
Antimicrobial resistance in enteric bacteria: current state and next-generation solutions
Wallace, M. J., Fishbein, S. R. S., & Dantas, G. A. (2020) · Gut Microbes · doi:10.1080/19490976.2020.1799654 · Cited by 82
Straková, N., Kořená, K., & Karpíšková, R. (2021) · Toxicon · doi:10.1016/j.toxicon.2021.04.007 · Cited by 79
Microbiota-mediated protection against antibiotic-resistant pathogens
Panwar, R., Sequeira, R. P., & Clarke, T. B. (2021) · Genes and Immunity · doi:10.1038/s41435-021-00129-5 · Cited by 74
Long-Term Effects of Early-Life Antibiotic Exposure on Resistance to Subsequent Bacterial Infection
Baudron, C. R., Ruiz, V. E., Swan, A. M., Vallance, B. A., Özkul, C., Pei, Z., Li, J., Battaglia, T., Perez-Perez, G. I., & Blaser, M. J. (2019) · mBio · doi:10.1128/mbio.02820-19 · Cited by 74
Tegtmeier, D., Hurka, S., Mihajlovic, S., Bodenschatz, M., Schlimbach, S., & Vilcinskas, A. (2021) · Microorganisms · doi:10.3390/microorganisms9081642 · Cited by 76
Shelton, C. D., Yoo, W., Shealy, N. G., Torres, T. P., Zieba, J. K., Calcutt, M. W., Foegeding, N. J., Kim, D., Kim, J., Ryu, S., et al. (2022) · Cell Reports · doi:10.1016/j.celrep.2021.110180 · Cited by 66
Roager, H. M., Stanton, C., & Hall, L. J. (2023) · Gut Microbes · doi:10.1080/19490976.2023.2192151 · Cited by 73
Liu, J., Liu, H., Liu, H., Teng, Y., Qin, N., Ren, X., & Xia, X. (2023) · Journal of Advanced Research · doi:10.1016/j.jare.2023.03.008 · Cited by 66
Odenwald, M. A., Lin, H., Lehmann, C. J., Dylla, N. P., Cole, C. G., Mostad, J. D., Pappas, T. E., Ramaswamy, R., Moran, A., Hutchison, A. L., et al. (2023) · Nature Microbiology · doi:10.1038/s41564-023-01493-w · Cited by 69
Self-citationThe Case against Antibiotics and for Anti-Virulence Therapeutics
Hotinger, J. A., Morris, S. T., & May, A. E. (2021) · Microorganisms · doi:10.3390/microorganisms9102049 · Cited by 60
Diet-derived metabolites and mucus link the gut microbiome to fever after cytotoxic cancer treatment
Schwabkey, Z. I., Wiesnoski, D. H., Chang, C., Tsai, W.-B., Pham, D., Ahmed, S., Hayase, T., Ortega, M. R., El-Himri, R. K., Sanchez, C. A., et al. (2022) · Science Translational Medicine · doi:10.1126/scitranslmed.abo3445 · Cited by 61
Self-citationDietary carbohydrates regulate intestinal colonization and dissemination of Klebsiella pneumoniae
Hecht, A. L., Harling, L. C., Friedman, E. S., Tanes, C., Lee, J., Firrman, J., Hao, F., Tu, V., Liu, L., Patterson, A. D., et al. (2024) · Journal of Clinical Investigation · doi:10.1172/jci174726 · Cited by 59
Walker, A. C., Bhargava, R., Vaziriyan-Sani, A. S., Pourciau, C., Donahue, E. T., Dove, A. S., Gebhardt, M. J., Ellward, G. L., Romeo, T., & Czyż, D. M. (2021) · PLoS Pathogens · doi:10.1371/journal.ppat.1009510 · Cited by 60
Human Gut Microbiome: A Connecting Organ Between Nutrition, Metabolism, and Health
Valencia, S., Zuluaga, M., Pérez, M. C. F., Montoya-Quintero, K. F., Candamil-Cortés, M. S., & Robledo, S. (2025) · International Journal of Molecular Sciences · doi:10.3390/ijms26094112 · Cited by 87
The microbiota: a key regulator of health, productivity, and reproductive success in mammals
Khan, I. M., Nassar, N., Chang, H., Khan, S., Cheng, M., Wang, Z., & Xiang, X. (2024) · Frontiers in Microbiology · doi:10.3389/fmicb.2024.1480811 · Cited by 61
Mechanisms of probiotic Bacillus against enteric bacterial infections
Zhu, J., Chen, Y., Imre, K., Arslan‐Acaröz, D., İstanbullugil, F. R., Fang, Y., Ros, G., Zhu, K., & Acaröz, U. (2023) · One Health Advances · doi:10.1186/s44280-023-00020-0 · Cited by 61
Gastrointestinal host-pathogen interaction in the age of microbiome research
Tsolis, R. M., & Bäumler, A. J. (2020) · Current Opinion in Microbiology · doi:10.1016/j.mib.2020.03.002 · Cited by 56
Self-citationPathogenesis and therapeutic opportunities of gut microbiome dysbiosis in critical illness
Cho, N. A., Strayer, K., Dobson, B., & McDonald, B. (2024) · Gut Microbes · doi:10.1080/19490976.2024.2351478 · Cited by 60
Gorrens, E., Looveren, N. V., Moll, L. V., Vandeweyer, D., Lachi, D., Smet, J. D., & Campenhout, L. V. (2021) · Microbiology Spectrum · doi:10.1128/spectrum.02183-21 · Cited by 54
Vornhagen, J., Bassis, C. M., Ramakrishnan, S., Hein, R., Mason, S., Bergman, Y., Sunshine, N., Fan, Y., Holmes, C. L., Timp, W., et al. (2021) · PLoS Pathogens · doi:10.1371/journal.ppat.1009537 · Cited by 51
The gut microbiota in transplant patients
Chong, P. P., & Koh, A. Y. (2019) · Blood Reviews · doi:10.1016/j.blre.2019.100614 · Cited by 53
Immunological design of commensal communities to treat intestinal infection and inflammation
Brown, R. L., Larkinson, M. L. Y., & Clarke, T. B. (2021) · PLoS Pathogens · doi:10.1371/journal.ppat.1009191 · Cited by 49
The role of the human gut microbiota in colonization and infection with multidrug-resistant bacteria
Wüthrich, I., Pelzer, B. W., Khodamoradi, Y., & Vehreschild, M. J. G. T. (2021) · Gut Microbes · doi:10.1080/19490976.2021.1911279 · Cited by 50
Oliveira, R. A., & Pamer, E. G. (2023) · Cell Host & Microbe · doi:10.1016/j.chom.2023.03.002 · Cited by 51
Self-citationDeciphering the gastrointestinal carriage of Klebsiella pneumoniae
Bray, A. S., & Zafar, M. A. (2024) · Infection and Immunity · doi:10.1128/iai.00482-23 · Cited by 53
Improving Risk–Benefit in Faecal Transplantation through Microbiome Screening
Papanicolas, L. E., Gordon, D., Wesselingh, S. L., & Rogers, G. B. (2020) · Trends in Microbiology · doi:10.1016/j.tim.2019.12.009 · Cited by 47
Osbelt, L., Almási, É. D. H., Wende, M., Kienesberger, S., Voltz, A., Lesker, T. R., Muthukumarasamy, U., Knischewski, N., Nordmann, E., Bielecka, A. A., et al. (2024) · Nature Microbiology · doi:10.1038/s41564-024-01710-0 · Cited by 46
Chang, K. C., Nagarajan, N., & Gan, Y. (2024) · mSphere · doi:10.1128/msphere.00781-23 · Cited by 48
Rogers, A. W. L., Radlinski, L. C., Nguyen, H., Tiffany, C. R., de Carvalho, T. P., Masson, H. L. P., Goodson, M. L., Bechtold, L., Yamazaki, K., Liou, M. J., et al. (2024) · Cell Host & Microbe · doi:10.1016/j.chom.2024.07.025 · Cited by 46
Self-citationMetabolic immunity against microbes
Kreimendahl, S., & Pernas, L. F. (2023) · Trends in Cell Biology · doi:10.1016/j.tcb.2023.10.013 · Cited by 42
Rotman, E. R., McClure, S., Glazier, J., Fuerte-Stone, J., Foldi, J., Erani, A., McGann, R., Arnold, J. H., Lin, H., Valaitis, S. R., et al. (2024) · Cell Host & Microbe · doi:10.1016/j.chom.2024.09.004 · Cited by 48
To give or not to give antibiotics is not the only question
Magalhães, C., Lima, M., Trieu‐Cuot, P., & Ferreira, P. (2020) · The Lancet Infectious Diseases · doi:10.1016/s1473-3099(20)30602-2 · Cited by 45
Stecher, B. (2021) · International Journal of Medical Microbiology · doi:10.1016/j.ijmm.2021.151484 · Cited by 41
Ghani, R., Mullish, B. H., Roberts, L. A., Davies, F., & Marchesi, J. R. (2022) · Gut Microbes · doi:10.1080/19490976.2022.2038856 · Cited by 43
Li, M., Wang, F., Wang, J., Wang, A., Yao, X., Strappe, P., Zhou, Z., Wu, Q., & Guo, T. (2022) · Food Chemistry · doi:10.1016/j.foodchem.2022.133089 · Cited by 42
The Function and the Affecting Factors of the Zebrafish Gut Microbiota
Li, P., Zhang, J., Liu, X., Gan, L., Xie, Y., Zhang, H., & Si, J. (2022) · Frontiers in Microbiology · doi:10.3389/fmicb.2022.903471 · Cited by 44
Gut Enterobacteriaceae and uraemic toxins - Perpetrators for ageing
Boopathi, S., Kumar, R. M. S., Priya, P. S., Haridevamuthu, B., Nayak, S. P. R. R., Chulenbayeva, L., Kushugulova, A. R., & Arockiaraj, J. (2023) · Experimental Gerontology · doi:10.1016/j.exger.2023.112088 · Cited by 40
Díaz-Marugán, L., Gallizioli, M., Márquez‐Kisinousky, L., Arboleya, S., Mastrangelo, A., Ruíz-Jaén, F., Pedragosa, J., Casals, C., Morales, F. J., Ramos‐Romero, S., et al. (2023) · Stroke · doi:10.1161/strokeaha.123.042755 · Cited by 38
Lehmann, C. J., Dylla, N. P., Odenwald, M. A., Nayak, R., Khalid, M., Boissiere, J. C., Cantoral, J., Adler, E., Stutz, M. R., Cruz, M. D., et al. (2023) · Cell Host & Microbe · doi:10.1016/j.chom.2023.11.016 · Cited by 37
Self-citationMicrobiota-mediated mechanisms of mucosal immunity across the lifespan
Iliev, I. D., Blander, J. M., Collins, N., Guo, C., Longman, R., Sonnenberg, G. F., Zeng, M. Y., & Artis, D. (2025) · Nature Immunology · doi:10.1038/s41590-025-02281-w · Cited by 55
Liu, J., Zhu, W., Qin, N., Ren, X., & Xia, X. (2022) · Foods · doi:10.3390/foods11213493 · Cited by 37
Distal Consequences of Mucosal Infections in Intestinal and Lung Inflammation
Melo-González, F., Sepúlveda-Alfaro, J., Schultz, B. M., Suazo, I. D., Boone, D. L., Kalergis, A. M., & Bueno, S. M. (2022) · Frontiers in Immunology · doi:10.3389/fimmu.2022.877533 · Cited by 38
Colonization resistance against multi-drug-resistant bacteria: a narrative review
Guern, R. L., Stabler, S., Gosset, P., Pichavant, M., Grandjean, T., Faure, E., Karaca, Y., Faure, K., Kipnis, É., & Dessein, R. (2021) · Journal of Hospital Infection · doi:10.1016/j.jhin.2021.09.001 · Cited by 38
Gut Microbiota Contributes to Host Defense Against Klebsiella pneumoniae-Induced Liver Abscess
Zheng, Y., Ding, Y., Xu, M., Chen, H., zhang, H., Liu, Y., Shen, W., & Li, J. (2021) · Journal of Inflammation Research · doi:10.2147/jir.s334581 · Cited by 36
Translating Microbiome Research From and To the Clinic
Zhang, Z. J., Lehmann, C. J., Cole, C. G., & Pamer, E. G. (2022) · Annual Review of Microbiology · doi:10.1146/annurev-micro-041020-022206 · Cited by 33
Self-citationPhysiological drivers of pks+ E. coli in colorectal cancer
Jans, M., & Vereecke, L. (2025) · Trends in Microbiology · doi:10.1016/j.tim.2025.04.010 · Cited by 33
N-glycans from human milk glycoproteins are selectively released by an infant gut symbiont in vivo
Karav, S., Casaburi, G., Arslan, A., Kaplan, M., Sucu, B., & Frese, S. A. (2019) · Journal of Functional Foods · doi:10.1016/j.jff.2019.103485 · Cited by 31
Kuprys, P. V., Cannon, A. R., Shieh, J., Iftekhar, N., Park, S. K., Eberhardt, J. M., Ding, X., & Choudhry, M. A. (2020) · Gut Microbes · doi:10.1080/19490976.2020.1838236 · Cited by 34
Wu, Q., Chen, T., El-Nezami, H. S., & Savidge, T. (2020) · Trends in Food Science & Technology · doi:10.1016/j.tifs.2020.04.007 · Cited by 31
Davies, M. A., Galazzo, G., van Hattem, J. M., Arcilla, M. S., Melles∗, D. C., de Jong, M. D., Schultsz, C., Wolffs, P. F. G., McNally, A., van Schaik, W., et al. (2022) · Gut Microbes · doi:10.1080/19490976.2022.2060676 · Cited by 32
Léo, S., Lazarević, V., von Dach, E., Kaiser, L., Prendki, V., Schrenzel, J., Huttner, B. D., & Huttner, A. C. (2021) · EBioMedicine · doi:10.1016/j.ebiom.2021.103566 · Cited by 32
The gut microbiome, chronic kidney disease, and sarcopenia
Zheng, G., Cao, J., Wang, X. H., He, W., & Wang, B. (2024) · Cell Communication and Signaling · doi:10.1186/s12964-024-01922-1 · Cited by 33
Juhász, J., Ligeti, B., Gajdács, M., Makra, N., Ostorházi, E., Farkas, F. B., Stercz, B., Tóth, Á., Domokos, J., Pongor, S., et al. (2021) · Antibiotics · doi:10.3390/antibiotics10030268 · Cited by 29
Members of Lachnospiraceae produce valerate and caproate in response to short-chain fatty acids
Fitzgerald, B. G., Govind, M., Firth, I. J., Herold, L., Froment, J., Vancuren, S. J., Allen‐Vercoe, E., Kimber, M. S., & Sorbara, M. T. (2025) · Microbiome · doi:10.1186/s40168-025-02220-9 · Cited by 35
Self-citationDörner, P. J., Anandakumar, H., Röwekamp, I., Vernengo, F. F., Pascual-Leone, B. M., Krzanowski, M., Sellmaier, J., Brüning, U., Fritsche‐Guenther, R., Pfannkuch, L., et al. (2024) · Nature Communications · doi:10.1038/s41467-024-47149-z · Cited by 27
Gut Microbiota Secondary Metabolites: Key Roles in GI Tract Cancers and Infectious Diseases
Anwer, E. K. E., Ajagbe, M., Sherif, M. A., Musaibah, A. S., Mahmoud, S., ElBanbi, A., & Abdelnaser, A. (2025) · Biomedicines · doi:10.3390/biomedicines13010100 · Cited by 31
Mini-Review: Antibiotic-Resistant Escherichia coli from Farm Animal-Associated Sources
Xu, C., Kong, L., Liao, Y., Tian, Y., Wu, Q., Liu, H., & Wang, X. (2022) · Antibiotics · doi:10.3390/antibiotics11111535 · Cited by 26
Kroon, S., Malcic, D., Weidert, L., Bircher, L., Boldt, L., Christen, P., Kiefer, P., Sintsova, A., Nguyen, B. D., Barthel, M., et al. (2025) · Nature Communications · doi:10.1038/s41467-025-57979-0 · Cited by 26
Drug–Microbiota Interaction in Colon Cancer Therapy: Impact of Antibiotics
Mohamed, A. A., Menon, H., Chulkina, M., Yee, N. S., & Pinchuk, I. V. (2021) · Biomedicines · doi:10.3390/biomedicines9030259 · Cited by 27
Bastard, Q. L., Chapelet, G., Birgand, G., Hillmann, B., Javaudin, F., Hayatgheib, N., Bourigault, C., Bémer, P., de Decker, L., Batard, É., et al. (2020) · Antimicrobial Resistance and Infection Control · doi:10.1186/s13756-020-00773-y · Cited by 24
Radlinski, L. C., Rogers, A. W. L., Bechtold, L., Masson, H. L. P., Nguyen, H., Larabi, A. B., Tiffany, C. R., de Carvalho, T. P., Tsolis, R. M., & Bäumler, A. J. (2024) · Proceedings of the National Academy of Sciences · doi:10.1073/pnas.2417232121 · Cited by 23
Self-citationWende, M., Osbelt, L., Eisenhard, L., Lesker, T. R., Damaris, B. F., Mutukumarasamy, U., Bielecka, A., Almási, É. D. H., Winter, K. A., Schauer, J., et al. (2025) · Nature Communications · doi:10.1038/s41467-025-61327-7 · Cited by 25
Metadata
- Authors
- Sorbara, M. T., Dubin, K., Littmann, E. R., Moody, T. U., Fontana, E., Seok, R., Leiner, I. M., Taur, Y., Peled, J. U., van den Brink, M. R. M., Litvak, Y., Bäumler, A. J., Chaubard, J.-L., Pickard, A. J., Cross, J. R., & Pamer, E. G.
- Affiliations
- Memorial Sloan Kettering Cancer Center (US)
- Adult Bone Marrow Transplant Service, Department of Medicine, Memorial Sloan Kettering Cancer Center, New York, NY 4
- University of California, Davis (US)
- Corresponding author
- Sorbara, Matthew T.
- Pamer, Eric G.
- ORCID
- Venue
- Journal of Experimental Medicine
- Publisher
- Rockefeller University Press
- Published
- 2018-12-18
- Volume
- 216
- Issue
- 1
- Pages
- 84-98
- ISSN
- 0022-1007 (ISSN-L)
- 1540-9538
- PMC
- PMC6314524
- OpenAlex
- W2904430902
- Cited by
- 259
- References
- 46
- Citations by year
- 2026: 36 · 2025: 40 · 2024: 48 · 2023: 34 · 2022: 26 · 2021: 38 · 2020: 25 · 2019: 11
- FWCI
- 6.58
- Type
- journal article
- Language
- en
- Open access
- hybrid
- doi.org
- Licence
- Locations
- The Journal of Experimental Medicine (publishedVersion, cc-by-nc-sa)
- Europe PMC (PubMed Central) (publishedVersion, cc-by-nc-sa)
- PubMed Central (publishedVersion, cc-by-nc-sa)
- PubMed (publishedVersion)
- eScholarship (California Digital Library) (submittedVersion, cc-by-nc-sa)
- Funders
- Canadian Institute of Health Research (FRN#152527)
- National Institutes of Health (R01 AI042135, AI095706, U01 AI124275, P30 CA008748)
- Topics
- Life Sciences › Biochemistry, Genetics and Molecular Biology › Molecular Biology › Gut microbiota and health
- Health Sciences › Medicine › Microbiology (medical) › Antibiotic Resistance in Bacteria
- Life Sciences › Immunology and Microbiology › Microbiology › Escherichia coli research studies
- Keywords
- Klebsiella pneumoniae, Escherichia coli, Proteus mirabilis, gut microbiota, short-chain fatty acids, intracellular acidification, antibiotic-induced microbiota depletion, bacterial clearance, sepsis, nitrate respiration, oxygen respiration
- MeSH terms
- Gastrointestinal Microbiome, Animals, Colon, Enterobacteriaceae, Enterobacteriaceae Infections, Fatty Acids, Female, Humans, Hydrogen-Ion Concentration, Male, Drug Resistance, Bacterial, Mice
About these checks
Registry, retraction, Cites and statistics results are computed, not judged, with one exception: a printed reference that no index lists is read once by a model before it counts as a citation error. Claims are extracted by a model and kept only when their quote appears verbatim in the text; each cited source is then checked, with a model’s help, for whether it says what the claim relies on. Those verdicts can be wrong — read the claim’s quote and the cited source before relying on one.
Statistics and arithmetic are recomputed, not judged.
Confidence bands are shown only for fields calibrated on our annotated test set. None is calibrated yet, so no band is shown.
What counts as a claim ›How we measure confidence ›How we check this ›
Are you an author, or do you see a problem with this page? Request a review
