Cited by 181Cancer, Hypoxia, and MetabolismCancer Cells and MetastasisPancreatic and Hepatic Oncology Research

The DOI matches its Crossref record; 57 of the 57 references it cites were found in a registry or an index.

Glutamine depletion regulates Slug to promote EMT and metastasis in pancreatic cancer

Open access

Abstract

Tumor cells rely on glutamine to fulfill their metabolic demands and sustain proliferation. The elevated consumption of glutamine can lead to intratumoral nutrient depletion, causing metabolic stress that has the potential to impact tumor progression. Here, we show that nutrient stress caused by glutamine deprivation leads to the induction of epithelial–mesenchymal transition (EMT) in pancreatic ductal adenocarcinoma (PDAC) cells. Mechanistically, we demonstrate that glutamine deficiency regulates EMT through the up-regulation of the EMT master regulator Slug, a process that is dependent on both MEK/ERK signaling and ATF4. We find that Slug is required in PDAC cells for glutamine deprivation–induced EMT, cell motility, and nutrient stress survival. Importantly, we decipher that Slug is associated with nutrient stress in PDAC tumors and is required for metastasis. These results delineate a novel role for Slug in the nutrient stress response and provide insight into how nutrient depletion might influence PDAC progression.

Overview

The claims and statistics of this paper haven’t been checked yet.

Run the check — free, no account needed. It reads the open-access text and checks the sources it cites.

A few free checks a day · papers already verified open instantly · results are public

Integrity signals

Registry

Crossref · 10.1084/jem.20200388

Cites

57 of 57 references verified0 citation errors · 0 not checkable

Statistics

Figures

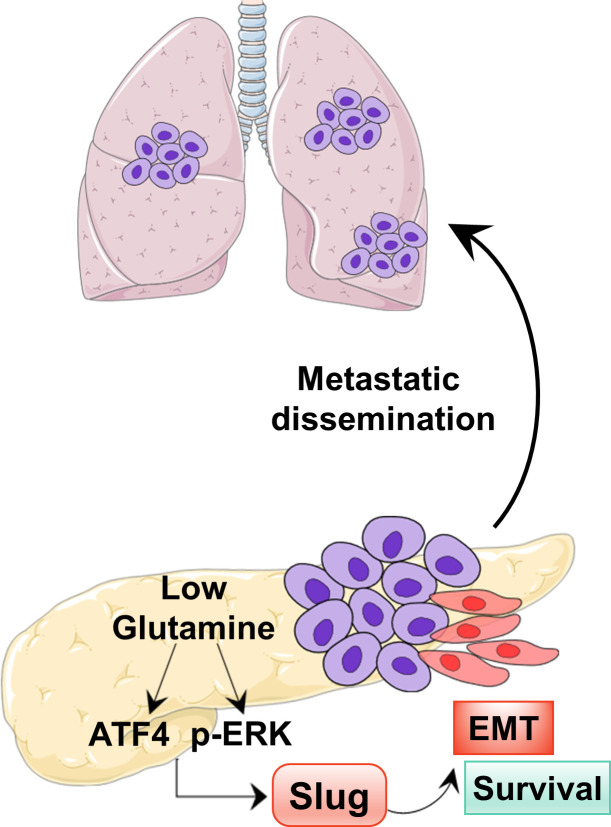
Graphical abstract
Graphical abstract CC BY-NC-SA · PubMed Central
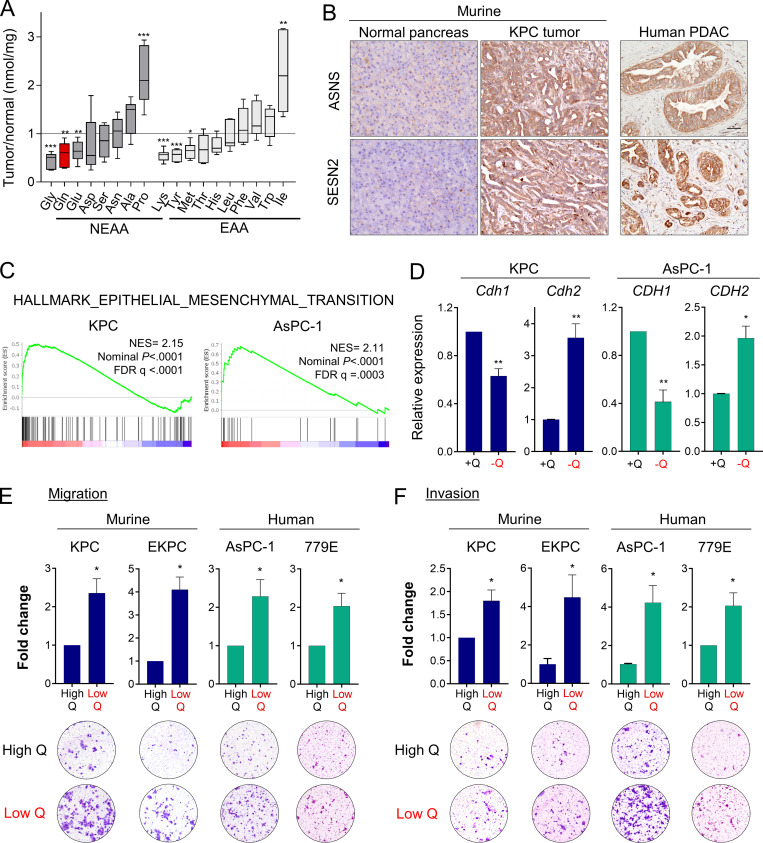
Figure 1. Glutamine deprivation induces EMT and promotes aggressive behaviors in PDAC cells. (A) Quantification of amino acids in orthotopic KPC tumors relative to normal murine pancreatic tissue. NEAA, nonessential amino acids; EAA, essential amino acids. Data are presented as box and whiskers plots. Vertical lines extend to the minimum and maximum values. (B) Immunohistochemical staining using antibodies specific to ASNS and SESN2 in normal murine pancreas, KPC orthotopic pancreatic tumor, and human PDAC specimen. Scale bar, 50 µm. (C) GSEA plots derived from RNA-seq data of glutamine-deprived versus control (glutamine-replete) KPC or AsPC-1 cells. NES, normalized enrichment score; FDR, false discovery rate. (D) Relative mRNA expression of the indicated genes measured by qPCR in KPC or AsPC-1 in glutamine-replete or glutamine-free medium for 24 h. Results are expressed relative to control cells in glutamine-replete conditions (+Q). Data are expressed as mean ± SEM; n = 5 (KPC) and n = 4 (AsPC-1) independent experiments. (E and F) Migration (E) and invasion (F) capacity of the indicated PDAC cells cultured in glutamine-replete medium (High Q, 4 mM) or glutamine starvation conditions (Low Q, 0 or 0.2 mM). Quantification is shown relative to the High Q condition and expressed as mean ± SEM; n = 3–5 independent experiments, each performed in triplicate. Representative images of migrating/invading cells stained with crystal violet are shown. Statistical significance was determined using unpaired two-tailed Student’s t test. The quantification of amino acids in A was generated from one experiment with n = 6 mice per cohort. The GSEA plots in C were generated from a single RNA-seq experiment that included n = 5 replicates per condition. Results are representative of two independent experiments in B and a pool of three to five independent experiments in D, E, and F. *, P < 0.05; **, P < 0.01; ***, P < 0.001.
Figure 1. Glutamine deprivation induces EMT and promotes aggressive behaviors in PDAC cells. (A) Quantification of amino acids in orthotopic KPC tumors relative to normal murine pancreatic tissue. NEAA, nonessential amino acids; EAA, essential amino acids. Data are presented as box and whiskers plots. Vertical lines extend to the minimum and maximum values. (B) Immunohistochemical staining using antibodies specific to ASNS and SESN2 in normal murine pancreas, KPC orthotopic pancreatic tumor, and human PDAC specimen. Scale bar, 50 µm. (C) GSEA plots derived from RNA-seq data of glutamine-deprived versus control (glutamine-replete) KPC or AsPC-1 cells. NES, normalized enrichment score; FDR, false discovery rate. (D) Relative mRNA expression of the indicated genes measured by qPCR in KPC or AsPC-1 in glutamine-replete or glutamine-free medium for 24 h. Results are expressed relative to control cells in glutamine-replete conditions (+Q). Data are expressed as mean ± SEM; n = 5 (KPC) and n = 4 (AsPC-1) independent experiments. (E and F) Migration (E) and invasion (F) capacity of the indicated PDAC cells cultured in glutamine-replete medium (High Q, 4 mM) or glutamine starvation conditions (Low Q, 0 or 0.2 mM). Quantification is shown relative to the High Q condition and expressed as mean ± SEM; n = 3–5 independent experiments, each performed in triplicate. Representative images of migrating/invading cells stained with crystal violet are shown. Statistical significance was determined using unpaired two-tailed Student’s t test. The quantification of amino acids in A was generated from one experiment with n = 6 mice per cohort. The GSEA plots in C were generated from a single RNA-seq experiment that included n = 5 replicates per condition. Results are representative of two independent experiments in B and a pool of three to five independent experiments in D, E, and F. *, P < 0.05; **, P < 0.01; ***, P < 0.001.CC BY-NC-SA · PubMed Central
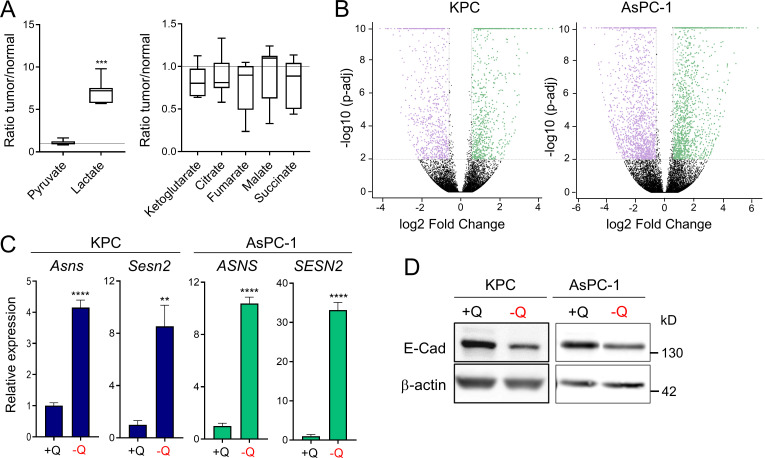
Figure S1. Glutamine deprivation induces metabolic stress and EMT in PDAC cells. (A) Quantification of metabolites in orthotopic KPC tumors relative to murine normal pancreas tissue. Data are presented as box and whiskers plots. Vertical lines extend to the minimum and maximum values. n = 6. (B) Volcano plots showing differentially expressed genes identified by RNA-seq in KPC or AsPC-1 cells grown in glutamine-replete versus glutamine-free medium for 24 h (fold-change ≥2 and less than or equal to −2; P < 0.05). n = 5 samples per group. (C) Relative gene expression of metabolic stress markers Asns and Sesn2 from RNA-seq analysis of KPC or AsPC-1 cells grown in glutamine-replete versus glutamine-free medium for 24 h. Results are expressed relative to the control cells (+Q). Data are expressed as mean ± SEM; n = 5 replicates. (D) Immunoblots assessing E-cadherin (E-Cad) protein expression in KPC or AsPC-1 cells in glutamine-replete or glutamine-free medium for 24 h. β-actin was used as a loading control. Statistical significance was determined using unpaired two-tailed Student’s t test. Data were generated from one experiment with n = 6 tumors (A) or n = 5 samples (C) or are representative of three independent experiments (D). **, P < 0.01; ***, P < 0.001; ****, P < 0.0001.
Figure S1. Glutamine deprivation induces metabolic stress and EMT in PDAC cells. (A) Quantification of metabolites in orthotopic KPC tumors relative to murine normal pancreas tissue. Data are presented as box and whiskers plots. Vertical lines extend to the minimum and maximum values. n = 6. (B) Volcano plots showing differentially expressed genes identified by RNA-seq in KPC or AsPC-1 cells grown in glutamine-replete versus glutamine-free medium for 24 h (fold-change ≥2 and less than or equal to −2; P < 0.05). n = 5 samples per group. (C) Relative gene expression of metabolic stress markers Asns and Sesn2 from RNA-seq analysis of KPC or AsPC-1 cells grown in glutamine-replete versus glutamine-free medium for 24 h. Results are expressed relative to the control cells (+Q). Data are expressed as mean ± SEM; n = 5 replicates. (D) Immunoblots assessing E-cadherin (E-Cad) protein expression in KPC or AsPC-1 cells in glutamine-replete or glutamine-free medium for 24 h. β-actin was used as a loading control. Statistical significance was determined using unpaired two-tailed Student’s t test. Data were generated from one experiment with n = 6 tumors (A) or n = 5 samples (C) or are representative of three independent experiments (D). **, P < 0.01; ***, P < 0.001; ****, P < 0.0001.CC BY-NC-SA · PubMed Central
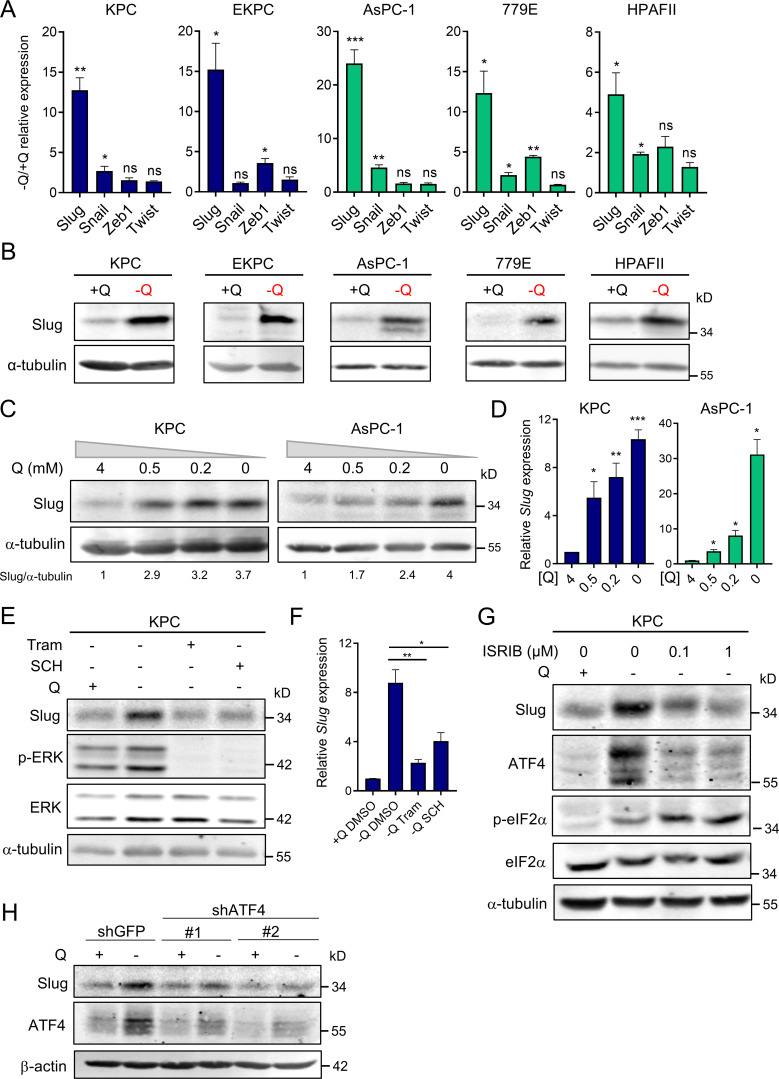
Figure 2. Slug is induced by glutamine deprivation via ERK signaling and ATF4. (A) Relative expression of Slug, Snail, Zeb1, and Twist transcript levels measured by qPCR in the indicated PDAC cells cultured in glutamine-replete or glutamine-free medium for 24 h. Results are expressed relative to control cells in glutamine-replete conditions (+Q). Data are expressed as mean ± SEM; n = 3–5 independent experiments. (B) Immunoblots of Slug expression in the indicated PDAC cells cultured in glutamine-replete or glutamine-free medium for 24 h. α-tubulin was used as a loading control. (C) Immunoblots assessing Slug expression in response to the indicated glutamine concentrations in KPC and AsPC-1 cells. α-tubulin was used as a loading control. Slug/α-tubulin ratios relative to 4 mM Q are shown. (D) Relative Slug mRNA expression by qPCR at the indicated glutamine concentrations in KPC and AsPC-1 cells. Results are expressed relative to the 4-mM Q concentration. Data are expressed as mean ± SEM; n = 3 independent experiments. (E) Immunoblots assessing protein expression of Slug, phospho-ERK (p-ERK), and ERK in KPC cells treated with vehicle (DMSO), 2 µM Tram or 2 µM SCH772984 (SCH) in glutamine-free medium for 5 h. α-tubulin was used as loading control. The immunoblots shown are representative of three independent experiments. (F) Relative Slug mRNA expression measured by qPCR in KPC cells under the same conditions described in E. Data are expressed as mean ± SEM; n = 3 independent experiments. (G) Immunoblots showing protein expression of Slug, ATF4, p-eIF2α (Ser51), and eIF2α in KPC cells treated with vehicle (DMSO) or ISRIB at the indicated concentrations in glutamine-free medium. α-tubulin was used as loading control. (H) Immunoblots assessing Slug and ATF4 protein expression in KPC cells stably expressing a nontargeting shRNA control (shGFP) or two independent short hairpins targeting ATF4 (shATF4#1 and shATF4#2) in glutamine-replete or glutamine-free medium for 24 h. β-actin was used as a loading control. Statistical significance was determined using unpaired two-tailed Student’s t test. Results are representative of at least three independent experiments. *, P < 0.05; **, P < 0.01; ***, P < 0.001; ns, not significant.
Figure 2. Slug is induced by glutamine deprivation via ERK signaling and ATF4. (A) Relative expression of Slug, Snail, Zeb1, and Twist transcript levels measured by qPCR in the indicated PDAC cells cultured in glutamine-replete or glutamine-free medium for 24 h. Results are expressed relative to control cells in glutamine-replete conditions (+Q). Data are expressed as mean ± SEM; n = 3–5 independent experiments. (B) Immunoblots of Slug expression in the indicated PDAC cells cultured in glutamine-replete or glutamine-free medium for 24 h. α-tubulin was used as a loading control. (C) Immunoblots assessing Slug expression in response to the indicated glutamine concentrations in KPC and AsPC-1 cells. α-tubulin was used as a loading control. Slug/α-tubulin ratios relative to 4 mM Q are shown. (D) Relative Slug mRNA expression by qPCR at the indicated glutamine concentrations in KPC and AsPC-1 cells. Results are expressed relative to the 4-mM Q concentration. Data are expressed as mean ± SEM; n = 3 independent experiments. (E) Immunoblots assessing protein expression of Slug, phospho-ERK (p-ERK), and ERK in KPC cells treated with vehicle (DMSO), 2 µM Tram or 2 µM SCH772984 (SCH) in glutamine-free medium for 5 h. α-tubulin was used as loading control. The immunoblots shown are representative of three independent experiments. (F) Relative Slug mRNA expression measured by qPCR in KPC cells under the same conditions described in E. Data are expressed as mean ± SEM; n = 3 independent experiments. (G) Immunoblots showing protein expression of Slug, ATF4, p-eIF2α (Ser51), and eIF2α in KPC cells treated with vehicle (DMSO) or ISRIB at the indicated concentrations in glutamine-free medium. α-tubulin was used as loading control. (H) Immunoblots assessing Slug and ATF4 protein expression in KPC cells stably expressing a nontargeting shRNA control (shGFP) or two independent short hairpins targeting ATF4 (shATF4#1 and shATF4#2) in glutamine-replete or glutamine-free medium for 24 h. β-actin was used as a loading control. Statistical significance was determined using unpaired two-tailed Student’s t test. Results are representative of at least three independent experiments. *, P < 0.05; **, P < 0.01; ***, P < 0.001; ns, not significant.CC BY-NC-SA · PubMed Central
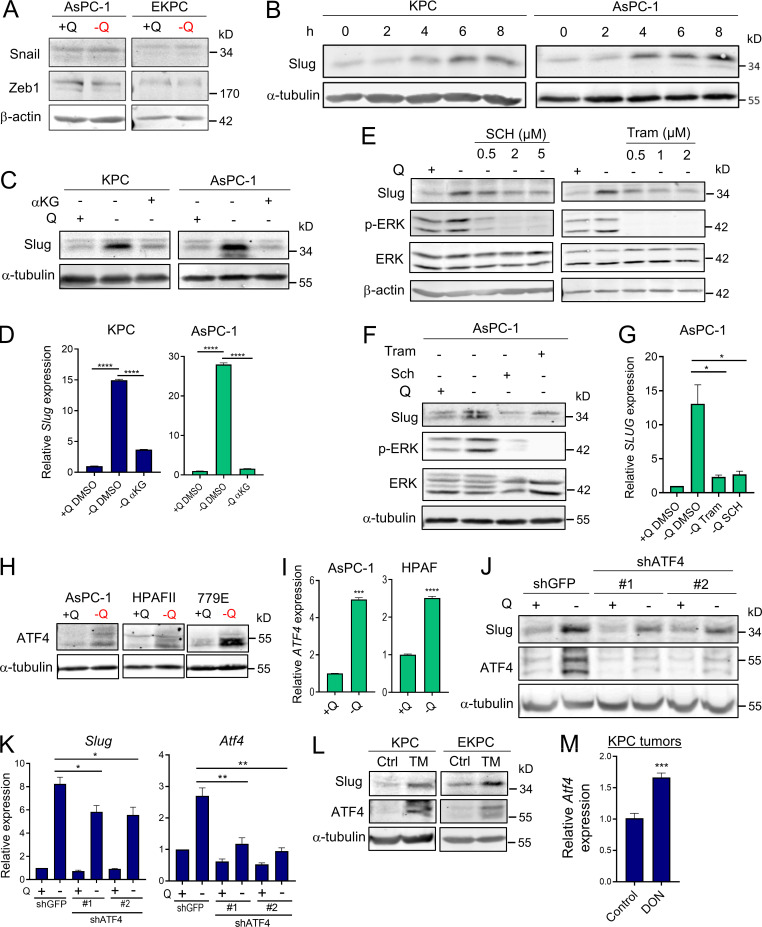
Figure S2. Slug expression is induced by glutamine deprivation via ERK and ATF4. (A) Immunoblots assessing Snail and Zeb1 protein expression in AsPC-1 or EKPC cells cultured in glutamine-replete or glutamine-free medium for 24 h. β-actin was used as a loading control. (B) Immunoblots showing Slug protein expression upon glutamine starvation for 0–8 h in KPC and AsPC-1 cells. α-tubulin was used as a loading control. Slug/α-tubulin ratios are shown relative to t = 0. (C) Immunoblots assessing Slug protein expression in glutamine-replete or glutamine-free medium supplemented with cell-permeable αKG, 7 mM) for 24 h in KPC and AsPC-1 cells. α-tubulin was used as a loading control. Blots are representative of at least three independent experiments. (D) Relative Slug mRNA expression determined by qPCR in KPC and AsPC-1 cells under the same conditions described in C. Data are expressed as mean ± SEM. (E) Immunoblots assessing protein expression of Slug, phospho-ERK (p-ERK), and ERK in KPC cells treated with vehicle (DMSO) or the indicated concentrations of Tram or SCH772984 (SCH) in glutamine-free medium for 5 h. β-actin was used as loading control. The immunoblots shown are representative of three independent experiments. (F) Immunoblots assessing protein expression of Slug, phospho-ERK (p-ERK), and ERK in AsPC-1 cells treated with vehicle (DMSO), 2 µM Tram, or 2 µM SCH in glutamine-free medium for 5 h. α-tubulin was used as loading control. The immunoblots shown are representative of three independent experiments. (G) Relative SLUG mRNA expression measured by qPCR in AsPC-1 cells under the same conditions described in F. Data are expressed as mean ± SEM; n = 3 independent experiments. (H) Immunoblots assessing protein expression of ATF4 in the indicated human PDAC cell lines in glutamine-replete or glutamine-free medium for 24 h. α-tubulin was used as loading control. (I) Relative ATF4 mRNA expression measured by qPCR in AsPC-1 and HPAFII cells under the same conditions described in H. Data are expressed as mean ± SEM. (J) Immunoblots assessing Slug and ATF4 protein expression in EKPC shGFP, shATF4#1, or shATF4#2 cells incubated in glutamine-replete or glutamine-free medium for 24 h. α-tubulin was used as loading control. (K) Relative gene expression of Slug and ATF4 evaluated by qPCR in KPC shGFP, shATF4#1, or shATF4#2 cells incubated in glutamine-replete or glutamine-free medium for 24 h. Results are expressed relative to shGFP/+Q condition. Data are shown as mean ± SEM; n = 3 independent experiments. (L) Immunoblotting of Slug and ATF4 in KPC and EKPC cells treated with vehicle (DMSO) or 1 µg/ml Tunicamycin (TM) for 24 h in glutamine-replete conditions. α-tubulin was used as a loading control. (M) Relative ATF4 mRNA expression measured by qPCR in KPC subcutaneous tumors from mice treated with vehicle-only control (Ctrl) or DON (10 mg/kg). Results are expressed relative to Ctrl group. Data are expressed as mean ± SEM; n = 6. Statistical significance was determined using unpaired two-tailed Student’s t test. Data in D were generated from one experiment with n = 3 replicates. Data in M were generated from one experiment with n = 6 mice per cohort. Data are representative of two (B and I) or three (A, C, E–H, and J–L) independent experiments. *, P < 0.05; **, P < 0.01; ***, P < 0.001; ****, P < 0.0001.
Figure S2. Slug expression is induced by glutamine deprivation via ERK and ATF4. (A) Immunoblots assessing Snail and Zeb1 protein expression in AsPC-1 or EKPC cells cultured in glutamine-replete or glutamine-free medium for 24 h. β-actin was used as a loading control. (B) Immunoblots showing Slug protein expression upon glutamine starvation for 0–8 h in KPC and AsPC-1 cells. α-tubulin was used as a loading control. Slug/α-tubulin ratios are shown relative to t = 0. (C) Immunoblots assessing Slug protein expression in glutamine-replete or glutamine-free medium supplemented with cell-permeable αKG, 7 mM) for 24 h in KPC and AsPC-1 cells. α-tubulin was used as a loading control. Blots are representative of at least three independent experiments. (D) Relative Slug mRNA expression determined by qPCR in KPC and AsPC-1 cells under the same conditions described in C. Data are expressed as mean ± SEM. (E) Immunoblots assessing protein expression of Slug, phospho-ERK (p-ERK), and ERK in KPC cells treated with vehicle (DMSO) or the indicated concentrations of Tram or SCH772984 (SCH) in glutamine-free medium for 5 h. β-actin was used as loading control. The immunoblots shown are representative of three independent experiments. (F) Immunoblots assessing protein expression of Slug, phospho-ERK (p-ERK), and ERK in AsPC-1 cells treated with vehicle (DMSO), 2 µM Tram, or 2 µM SCH in glutamine-free medium for 5 h. α-tubulin was used as loading control. The immunoblots shown are representative of three independent experiments. (G) Relative SLUG mRNA expression measured by qPCR in AsPC-1 cells under the same conditions described in F. Data are expressed as mean ± SEM; n = 3 independent experiments. (H) Immunoblots assessing protein expression of ATF4 in the indicated human PDAC cell lines in glutamine-replete or glutamine-free medium for 24 h. α-tubulin was used as loading control. (I) Relative ATF4 mRNA expression measured by qPCR in AsPC-1 and HPAFII cells under the same conditions described in H. Data are expressed as mean ± SEM. (J) Immunoblots assessing Slug and ATF4 protein expression in EKPC shGFP, shATF4#1, or shATF4#2 cells incubated in glutamine-replete or glutamine-free medium for 24 h. α-tubulin was used as loading control. (K) Relative gene expression of Slug and ATF4 evaluated by qPCR in KPC shGFP, shATF4#1, or shATF4#2 cells incubated in glutamine-replete or glutamine-free medium for 24 h. Results are expressed relative to shGFP/+Q condition. Data are shown as mean ± SEM; n = 3 independent experiments. (L) Immunoblotting of Slug and ATF4 in KPC and EKPC cells treated with vehicle (DMSO) or 1 µg/ml Tunicamycin (TM) for 24 h in glutamine-replete conditions. α-tubulin was used as a loading control. (M) Relative ATF4 mRNA expression measured by qPCR in KPC subcutaneous tumors from mice treated with vehicle-only control (Ctrl) or DON (10 mg/kg). Results are expressed relative to Ctrl group. Data are expressed as mean ± SEM; n = 6. Statistical significance was determined using unpaired two-tailed Student’s t test. Data in D were generated from one experiment with n = 3 replicates. Data in M were generated from one experiment with n = 6 mice per cohort. Data are representative of two (B and I) or three (A, C, E–H, and J–L) independent experiments. *, P < 0.05; **, P < 0.01; ***, P < 0.001; ****, P < 0.0001.CC BY-NC-SA · PubMed Central
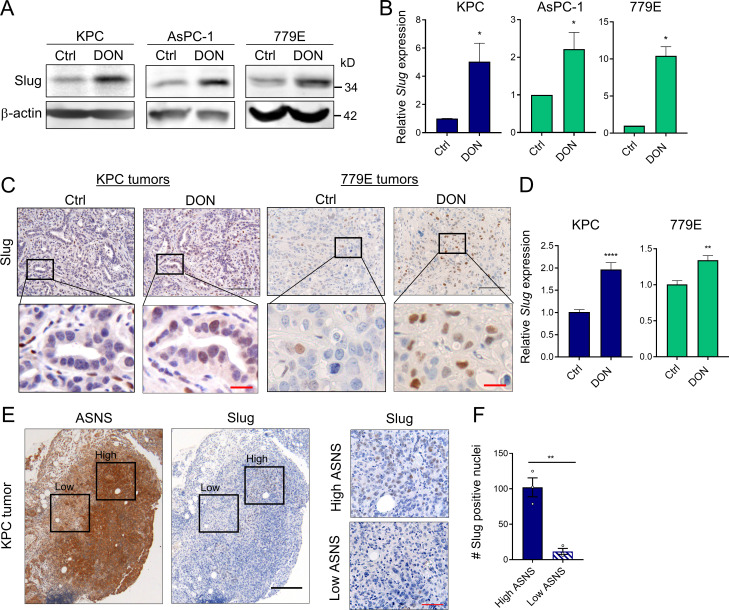
Figure 3. Slug expression is enhanced by a glutamine antagonist in vivo and coincides with metabolic stress in PDAC tumors. (A) Immunoblots of Slug protein expression in the indicated PDAC cells treated for 24 h with DON compared with vehicle-only control (Ctrl) cells. β-actin was used as loading control. Results are representative of three independent experiments. (B) Relative Slug mRNA expression assessed by qPCR in the indicated cell lines in the same conditions described in A. Data are expressed as mean ± SEM; n = 3 independent experiments. (C) Immunohistochemical staining of Slug protein in KPC or 779E heterotopic tumors from mice treated with vehicle-only control (Ctrl) or DON (10 mg/kg). The inset boxes indicate the areas further magnified below. Black scale bar, 100 µm; red scale bar, 20 µm. (D) Relative Slug mRNA expression assessed by qPCR in KPC or 779E subcutaneous tumors from mice treated with vehicle-only control (Ctrl) or DON (10 mg/kg). Results are expressed relative to Ctrl group. Data are expressed as mean ± SEM; n = 10 KPC and n = 5 779E tumors. (E) Immunohistochemical staining of ASNS and Slug protein in KPC orthotopic tumors. The inset boxes indicate the areas of high and low ASNS and Slug expression in the further magnified images to the right. The images shown are representative of three different tumors. Black scale bar, 200 µm; red scale bar, 50 µm. (F) Quantification of Slug-positive nuclei in areas of high or low ASNS expression in the KPC orthotopic tumors shown in E. Results are expressed as the mean ± SEM; n = 3 tumors. Four to five images of high or low ASNS areas per tumor were quantified at 40× magnification. Statistical significance was determined using unpaired two-tailed Student’s t test. Data are representative of three independent experiments (A and B), two independent experiments (C and D), or one experiment with n = 3 mice per cohort (E and F). *, P < 0.05; **, P < 0.01; ****, P < 0.0001.
Figure 3. Slug expression is enhanced by a glutamine antagonist in vivo and coincides with metabolic stress in PDAC tumors. (A) Immunoblots of Slug protein expression in the indicated PDAC cells treated for 24 h with DON compared with vehicle-only control (Ctrl) cells. β-actin was used as loading control. Results are representative of three independent experiments. (B) Relative Slug mRNA expression assessed by qPCR in the indicated cell lines in the same conditions described in A. Data are expressed as mean ± SEM; n = 3 independent experiments. (C) Immunohistochemical staining of Slug protein in KPC or 779E heterotopic tumors from mice treated with vehicle-only control (Ctrl) or DON (10 mg/kg). The inset boxes indicate the areas further magnified below. Black scale bar, 100 µm; red scale bar, 20 µm. (D) Relative Slug mRNA expression assessed by qPCR in KPC or 779E subcutaneous tumors from mice treated with vehicle-only control (Ctrl) or DON (10 mg/kg). Results are expressed relative to Ctrl group. Data are expressed as mean ± SEM; n = 10 KPC and n = 5 779E tumors. (E) Immunohistochemical staining of ASNS and Slug protein in KPC orthotopic tumors. The inset boxes indicate the areas of high and low ASNS and Slug expression in the further magnified images to the right. The images shown are representative of three different tumors. Black scale bar, 200 µm; red scale bar, 50 µm. (F) Quantification of Slug-positive nuclei in areas of high or low ASNS expression in the KPC orthotopic tumors shown in E. Results are expressed as the mean ± SEM; n = 3 tumors. Four to five images of high or low ASNS areas per tumor were quantified at 40× magnification. Statistical significance was determined using unpaired two-tailed Student’s t test. Data are representative of three independent experiments (A and B), two independent experiments (C and D), or one experiment with n = 3 mice per cohort (E and F). *, P < 0.05; **, P < 0.01; ****, P < 0.0001.CC BY-NC-SA · PubMed Central
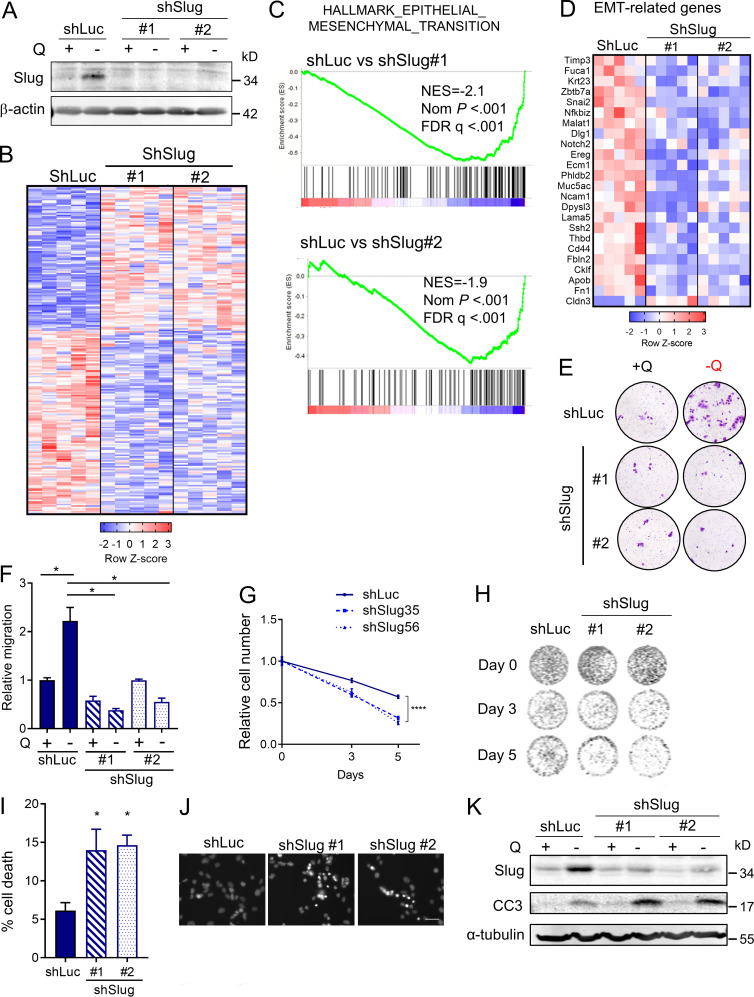
Figure 4. Slug mediates EMT and nutrient stress survival in PDAC cells. (A) Immunoblot assessing Slug expression in KPC cells stably expressing a nontargeting shRNA control (shLuc) or two independent short hairpins targeting Slug (shSlug#1 and shSlug#2) in glutamine-replete or glutamine-free medium. β-actin was used as a loading control. (B) Heatmap of RNA-seq data depicting differentially expressed genes in KPC shLuc, shSlug#1, and shSlug#2 under glutamine deprivation for 24 h (fold-change ≥1.5 and less than or equal to −1.5; P < 0.05). n = 5 samples per group. (C) GSEA plots of RNA-seq data from KPC shLuc versus shSlug#1 or shSlug#2 under glutamine deprivation for 24 h showing inhibition of the EMT gene signature in Slug knockdown cells compared with shLuc. NES, normalized enrichment score; FDR, false discovery rate. (D) Heatmap showing EMT-related genes that are differentially expressed in KPC shLuc versus shSlug#1 and shSlug#2 after glutamine starvation for 24 h. (E) Representative images of a Transwell migration assay comparing KPC shLuc, shSlug#1, or shSlug#2 incubated in glutamine-replete or glutamine-free medium for 72 h. Cells were stained with crystal violet. (F) Quantification of the migration capacity of KPC shLuc, shSlug#1, or shSlug#2 cells from E. Results are presented relative to the shLuc/+Q condition and are representative of n = 3 independent experiments. Data are expressed as the mean ± SEM of triplicate wells. (G) Relative cell number as assessed by Syto60 fluorescent staining of KPC shLuc, shSlug#1, and shSlug#2 cells cultured in glutamine-free medium for 5 d. Results are presented relative to shLuc/day 0 and are representative data of five independent experiments, each performed with five replicates per group. (H) Representative images for Syto60 staining under the conditions described in G. (I) Quantification of cell death in KPC shLuc, shSlug#1, and shSlug#2 cells under glutamine deprivation for 48 h as evaluated by Hoechst staining. Data are expressed as mean ± SEM; n = 3 independent experiments. (J) Representative images of Hoechst-stained KPC shLuc, shSlug#1, and shSlug#2 cells under the conditions described in I. Scale bar, 50 µm. (K) Immunoblot assessing Slug and cleaved caspase 3 (CC3) protein in KPC shLuc, shSlug#1, and shSlug#2 cells cultured in glutamine-replete or glutamine-free medium for 72 h. α-tubulin was used as a loading control. The results are representative of three independent experiments. Statistical significance was determined using unpaired two-tailed Student’s t test in F and one-way ANOVA followed by Dunnett's test in G and I. Data in B, C, and D were generated from a single RNA-seq experiment with n = 5 replicates per condition. Data are representative of at least three independent experiments (A and E–K). *, P < 0.05; ****, P < 0.001.
Figure 4. Slug mediates EMT and nutrient stress survival in PDAC cells. (A) Immunoblot assessing Slug expression in KPC cells stably expressing a nontargeting shRNA control (shLuc) or two independent short hairpins targeting Slug (shSlug#1 and shSlug#2) in glutamine-replete or glutamine-free medium. β-actin was used as a loading control. (B) Heatmap of RNA-seq data depicting differentially expressed genes in KPC shLuc, shSlug#1, and shSlug#2 under glutamine deprivation for 24 h (fold-change ≥1.5 and less than or equal to −1.5; P < 0.05). n = 5 samples per group. (C) GSEA plots of RNA-seq data from KPC shLuc versus shSlug#1 or shSlug#2 under glutamine deprivation for 24 h showing inhibition of the EMT gene signature in Slug knockdown cells compared with shLuc. NES, normalized enrichment score; FDR, false discovery rate. (D) Heatmap showing EMT-related genes that are differentially expressed in KPC shLuc versus shSlug#1 and shSlug#2 after glutamine starvation for 24 h. (E) Representative images of a Transwell migration assay comparing KPC shLuc, shSlug#1, or shSlug#2 incubated in glutamine-replete or glutamine-free medium for 72 h. Cells were stained with crystal violet. (F) Quantification of the migration capacity of KPC shLuc, shSlug#1, or shSlug#2 cells from E. Results are presented relative to the shLuc/+Q condition and are representative of n = 3 independent experiments. Data are expressed as the mean ± SEM of triplicate wells. (G) Relative cell number as assessed by Syto60 fluorescent staining of KPC shLuc, shSlug#1, and shSlug#2 cells cultured in glutamine-free medium for 5 d. Results are presented relative to shLuc/day 0 and are representative data of five independent experiments, each performed with five replicates per group. (H) Representative images for Syto60 staining under the conditions described in G. (I) Quantification of cell death in KPC shLuc, shSlug#1, and shSlug#2 cells under glutamine deprivation for 48 h as evaluated by Hoechst staining. Data are expressed as mean ± SEM; n = 3 independent experiments. (J) Representative images of Hoechst-stained KPC shLuc, shSlug#1, and shSlug#2 cells under the conditions described in I. Scale bar, 50 µm. (K) Immunoblot assessing Slug and cleaved caspase 3 (CC3) protein in KPC shLuc, shSlug#1, and shSlug#2 cells cultured in glutamine-replete or glutamine-free medium for 72 h. α-tubulin was used as a loading control. The results are representative of three independent experiments. Statistical significance was determined using unpaired two-tailed Student’s t test in F and one-way ANOVA followed by Dunnett's test in G and I. Data in B, C, and D were generated from a single RNA-seq experiment with n = 5 replicates per condition. Data are representative of at least three independent experiments (A and E–K). *, P < 0.05; ****, P < 0.001.CC BY-NC-SA · PubMed Central
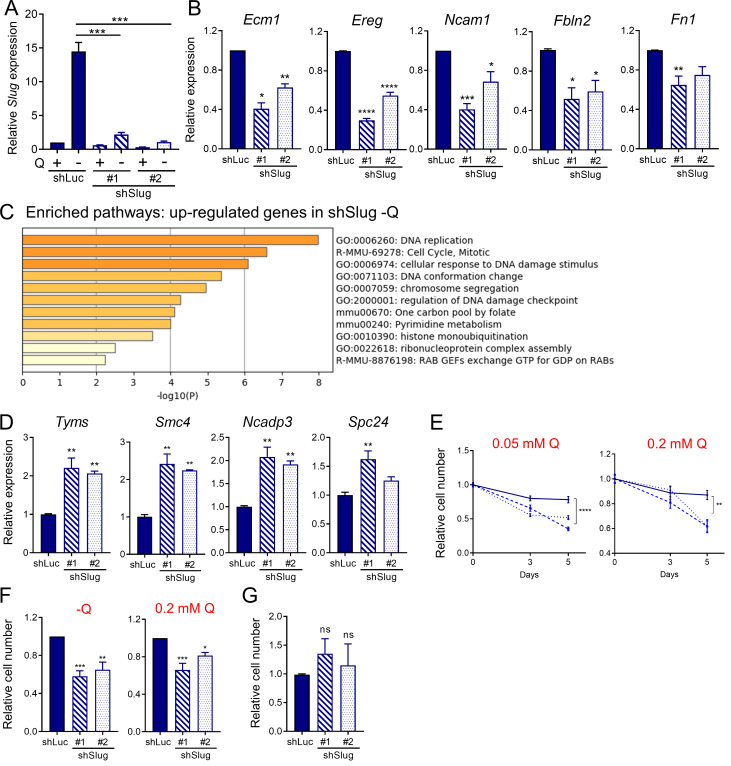
Figure S3. Slug regulates EMT and survival upon glutamine starvation. (A) Relative Slug mRNA expression by qPCR in KPC Slug knockdown cells compared with control (shLuc) in glutamine-replete or glutamine-free medium for 24 h. Results are expressed relative to shLuc/+Q condition. Data are shown as mean ± SEM; n = 5 independent experiments. (B) Relative expression of the indicated EMT-related genes in KPC Slug knockdown compared with shLuc in glutamine-free medium for 24 h. Results are expressed relative to shLuc. Data are shown as mean ± SEM; n = 3 independent experiments. (C) Chart showing enriched pathways among the genes up-regulated in Slug-depleted KPC cells compared with control (shLuc) in glutamine-free conditions. The graph was generated with Metascape. (D) Relative expression of the indicated genes in KPC Slug knockdown compared with shLuc in glutamine-free medium for 24 h. Results are expressed relative to shLuc. The results are representative of three independent experiments. Data are presented as the mean ± SEM of three replicates. (E) Relative cell number assessed by Syto60 staining in KPC shLuc, shSlug#1, or shSlug#2 cells incubated in medium containing 0.05 or 0.2 mM glutamine for 3 and 5 d. Representative data are shown for n = 3 independent experiments with three to five replicates each. (F) Relative cell number assessed by crystal violet staining in KPC shLuc, shSlug#1, or shSlug#2 cells incubated in glutamine-free medium or medium containing 0.2 mM glutamine for 5 or 6 d. Data are normalized to day 0 for each cell line and are shown relative to the shLuc control. Results are expressed as mean ± SEM; n = 5 independent experiments. (G) Relative cell number assessed by crystal violet staining in KPC shLuc, shSlug#1, or shSlug#2 incubated in complete medium for 48 h. Results are expressed as mean ± SEM; n = 4 independent experiments. ns, not significant. Statistical significance was determined using unpaired Student’s t test in A and one-way ANOVA followed by Dunnett's test for multiple comparisons in B–G. All data are representative of at least three independent experiments. *, P < 0.05; **, P < 0.01; ***, P < 0.001; ****, P < 0.001.
Figure S3. Slug regulates EMT and survival upon glutamine starvation. (A) Relative Slug mRNA expression by qPCR in KPC Slug knockdown cells compared with control (shLuc) in glutamine-replete or glutamine-free medium for 24 h. Results are expressed relative to shLuc/+Q condition. Data are shown as mean ± SEM; n = 5 independent experiments. (B) Relative expression of the indicated EMT-related genes in KPC Slug knockdown compared with shLuc in glutamine-free medium for 24 h. Results are expressed relative to shLuc. Data are shown as mean ± SEM; n = 3 independent experiments. (C) Chart showing enriched pathways among the genes up-regulated in Slug-depleted KPC cells compared with control (shLuc) in glutamine-free conditions. The graph was generated with Metascape. (D) Relative expression of the indicated genes in KPC Slug knockdown compared with shLuc in glutamine-free medium for 24 h. Results are expressed relative to shLuc. The results are representative of three independent experiments. Data are presented as the mean ± SEM of three replicates. (E) Relative cell number assessed by Syto60 staining in KPC shLuc, shSlug#1, or shSlug#2 cells incubated in medium containing 0.05 or 0.2 mM glutamine for 3 and 5 d. Representative data are shown for n = 3 independent experiments with three to five replicates each. (F) Relative cell number assessed by crystal violet staining in KPC shLuc, shSlug#1, or shSlug#2 cells incubated in glutamine-free medium or medium containing 0.2 mM glutamine for 5 or 6 d. Data are normalized to day 0 for each cell line and are shown relative to the shLuc control. Results are expressed as mean ± SEM; n = 5 independent experiments. (G) Relative cell number assessed by crystal violet staining in KPC shLuc, shSlug#1, or shSlug#2 incubated in complete medium for 48 h. Results are expressed as mean ± SEM; n = 4 independent experiments. ns, not significant. Statistical significance was determined using unpaired Student’s t test in A and one-way ANOVA followed by Dunnett's test for multiple comparisons in B–G. All data are representative of at least three independent experiments. *, P < 0.05; **, P < 0.01; ***, P < 0.001; ****, P < 0.001.CC BY-NC-SA · PubMed Central
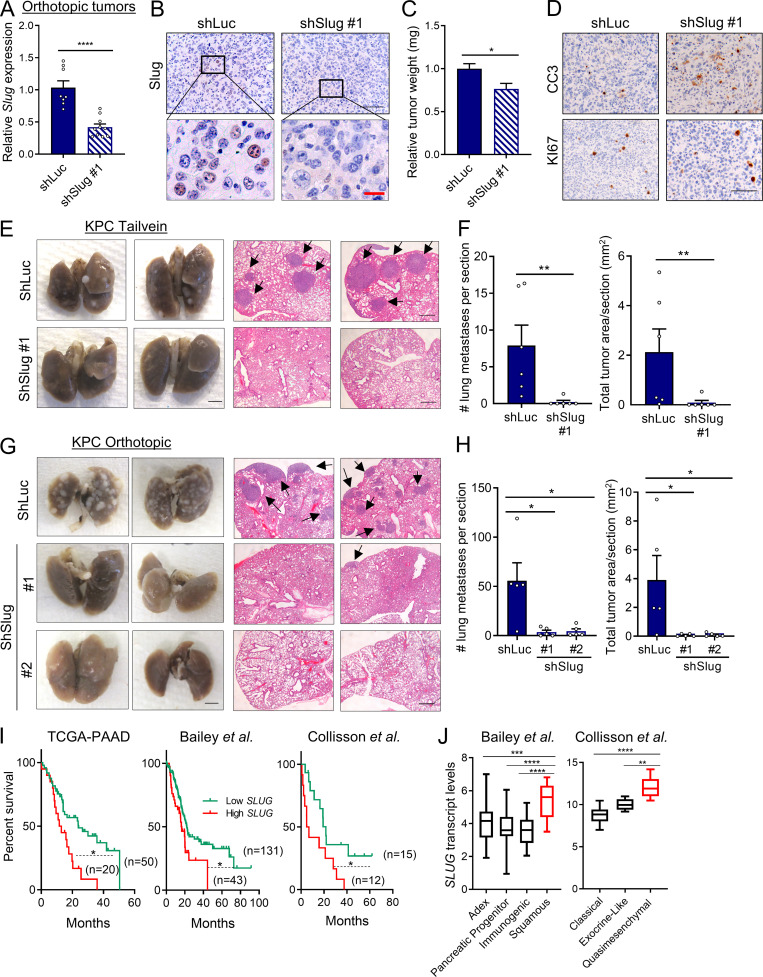
Figure 5. Slug regulates metastasis in PDAC. (A) Relative Slug mRNA expression evaluated by qPCR in EKPC shLuc or EKPC shSlug#1 orthotopic tumors. Results are expressed relative to shLuc. Data are expressed as mean ± SEM; n = 8 shLuc tumors; n = 10 shSlug#1 tumors. (B) Immunohistochemical staining of Slug protein in EKPC shLuc or EKPC-shSlug#1 orthotopic tumors. The inset boxes indicate the areas further magnified below. Black scale bar, 100 µm; red scale bar, 20 µm. (C) Relative tumor weight of EKPC shLuc or EKPC shSlug#1 orthotopic tumors. Data are expressed as mean ± SEM; n = 8 shLuc tumors; n = 10 shSlug#1 tumors. (D) Immunohistochemical staining of cleaved caspase 3 (CC3) and KI67 in EKPC shLuc or EKPC shSlug#1 orthotopic tumors. Images are representative of n = 3 tumors. Scale bar, 100 µm. (E) Lung colonization capacity of KPC shLuc and KPC shSlug#1 cells injected into the tail vein of syngeneic mice. Representative images of whole lungs and H&E-stained lung sections are shown. The arrows indicate lung metastatic foci. Images are representative of n = 6 mice per group. Scale bars: left panel, 2.5 mm; right panel, 500 µm. (F) Quantification of lung colonies (number and area per section) after tail vein injection as described in E. Data are presented as mean ± SEM; n = 6 mice per group. (G) Representative images of macroscopic and H&E-stained lungs of mice bearing KPC shLuc, KPC shSlug#1, or KPC shSlug#2 orthotopic tumors. The arrows indicate lung metastatic foci. Scale bars: left panel, 2.5 mm; right panel, 500 µm. (H) Quantification of lung metastatic colonies (number and area per section) originated from KPC shLuc, KPC shSlug#1, or KPC shSlug#2 orthotopic tumors as described in G. Data are presented as the mean ± SEM for n = 5 mice per group. (I) Kaplan–Meier survival analysis of the indicated datasets comparing low and high SLUG expression in PDAC patients. (J) Box plots representing SLUG transcript levels across different PDAC subtypes from the indicated public datasets. Data are presented as box and whiskers plots. Vertical lines extend to the minimum and maximum values. ADEX, aberrantly differentiated endocrine exocrine. Statistical significance was determined using unpaired two-tailed Student’s t test in A and C; Mann–Whitney nonparametric U test in F and H; log-rank (Mantel–Cox) test in I; and one-way ANOVA followed by Tukey test for multiple comparisons in J. Data were pooled from two cohorts (A–D, G, and H) and are representative of two independent experiments (E and F). *, P < 0.05; **, P < 0.01; ***, P < 0.001; ****, P < 0.0001.
Figure 5. Slug regulates metastasis in PDAC. (A) Relative Slug mRNA expression evaluated by qPCR in EKPC shLuc or EKPC shSlug#1 orthotopic tumors. Results are expressed relative to shLuc. Data are expressed as mean ± SEM; n = 8 shLuc tumors; n = 10 shSlug#1 tumors. (B) Immunohistochemical staining of Slug protein in EKPC shLuc or EKPC-shSlug#1 orthotopic tumors. The inset boxes indicate the areas further magnified below. Black scale bar, 100 µm; red scale bar, 20 µm. (C) Relative tumor weight of EKPC shLuc or EKPC shSlug#1 orthotopic tumors. Data are expressed as mean ± SEM; n = 8 shLuc tumors; n = 10 shSlug#1 tumors. (D) Immunohistochemical staining of cleaved caspase 3 (CC3) and KI67 in EKPC shLuc or EKPC shSlug#1 orthotopic tumors. Images are representative of n = 3 tumors. Scale bar, 100 µm. (E) Lung colonization capacity of KPC shLuc and KPC shSlug#1 cells injected into the tail vein of syngeneic mice. Representative images of whole lungs and H&E-stained lung sections are shown. The arrows indicate lung metastatic foci. Images are representative of n = 6 mice per group. Scale bars: left panel, 2.5 mm; right panel, 500 µm. (F) Quantification of lung colonies (number and area per section) after tail vein injection as described in E. Data are presented as mean ± SEM; n = 6 mice per group. (G) Representative images of macroscopic and H&E-stained lungs of mice bearing KPC shLuc, KPC shSlug#1, or KPC shSlug#2 orthotopic tumors. The arrows indicate lung metastatic foci. Scale bars: left panel, 2.5 mm; right panel, 500 µm. (H) Quantification of lung metastatic colonies (number and area per section) originated from KPC shLuc, KPC shSlug#1, or KPC shSlug#2 orthotopic tumors as described in G. Data are presented as the mean ± SEM for n = 5 mice per group. (I) Kaplan–Meier survival analysis of the indicated datasets comparing low and high SLUG expression in PDAC patients. (J) Box plots representing SLUG transcript levels across different PDAC subtypes from the indicated public datasets. Data are presented as box and whiskers plots. Vertical lines extend to the minimum and maximum values. ADEX, aberrantly differentiated endocrine exocrine. Statistical significance was determined using unpaired two-tailed Student’s t test in A and C; Mann–Whitney nonparametric U test in F and H; log-rank (Mantel–Cox) test in I; and one-way ANOVA followed by Tukey test for multiple comparisons in J. Data were pooled from two cohorts (A–D, G, and H) and are representative of two independent experiments (E and F). *, P < 0.05; **, P < 0.01; ***, P < 0.001; ****, P < 0.0001.CC BY-NC-SA · PubMed Central
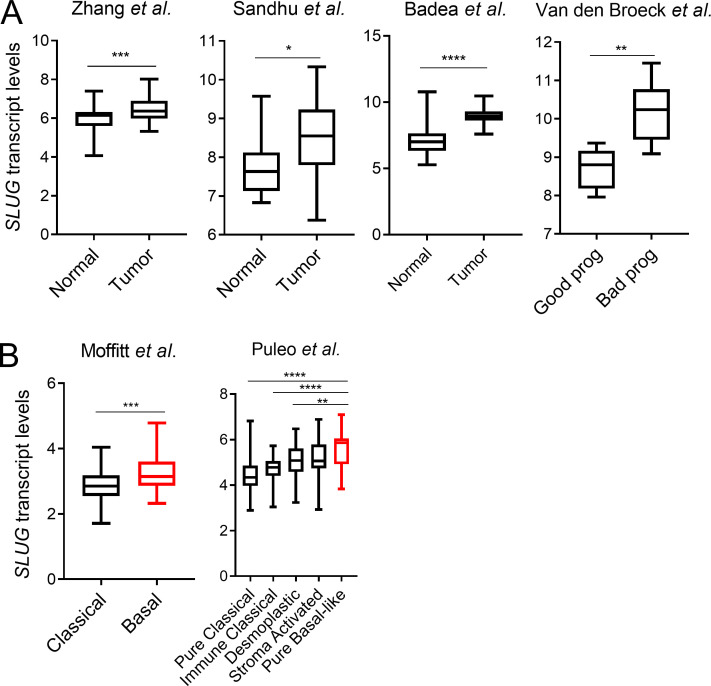
Figure S4. Slug is more highly expressed in human PDAC and is associated with poor prognosis. (A) Box plots showing SLUG mRNA expression in the indicated datasets comparing normal pancreas versus PDAC tumors and good prognosis versus bad prognosis. (B) Box plots showing SLUG mRNA expression in the indicated datasets comparing different PDAC subtypes. Data in A and B are presented as box and whiskers plots. Vertical lines extend to the minimum and maximum values. Statistical significance was determined using unpaired two-tailed Student’s t test in A and one-way ANOVA followed by Tukey multiple comparisons in B. *, P < 0.05; **, P < 0.01; ***, P < 0.001; ****, P < 0.0001.
Figure S4. Slug is more highly expressed in human PDAC and is associated with poor prognosis. (A) Box plots showing SLUG mRNA expression in the indicated datasets comparing normal pancreas versus PDAC tumors and good prognosis versus bad prognosis. (B) Box plots showing SLUG mRNA expression in the indicated datasets comparing different PDAC subtypes. Data in A and B are presented as box and whiskers plots. Vertical lines extend to the minimum and maximum values. Statistical significance was determined using unpaired two-tailed Student’s t test in A and one-way ANOVA followed by Tukey multiple comparisons in B. *, P < 0.05; **, P < 0.01; ***, P < 0.001; ****, P < 0.0001.CC BY-NC-SA · PubMed Central

Verification

Claims the paper makes

The claims and statistics of this paper haven’t been checked yet.

Run the check — free, no account needed. It reads the open-access text and checks the sources it cites.

A few free checks a day · papers already verified open instantly · results are public

Claims other papers make about this one

Each is checked against this paper’s own text: does it say what the citing paper says it does?

Self-check

Percentages, sums and reported differences re-computed from the paper’s own numbers.

The self-check needs the paper’s full text.

Citations

Cites

Show all 57 references

Cited by

Sorted by citations

See all 181

Metadata

Authors
Recouvreux, M. V., Moldenhauer, M. R., Galenkamp, K. M. O., Jung, M., James, B., Zhang, Y., Lowy, A., Bagchi, A., & Commisso, C.
Affiliations
  • Sanford Burnham Prebys Medical Discovery Institute (US)
  • University of California San Diego (US)
Corresponding author
Commisso, Cosimo
Venue
Journal of Experimental Medicine
Published
2020-06-08
Volume
217
Issue
9
ISSN
  • 0022-1007 (ISSN-L)
  • 1540-9538
OpenAlex
W3032930460
Cited by
181
References
57
Citations by year
2026: 15 · 2025: 33 · 2024: 28 · 2023: 37 · 2022: 40 · 2021: 23 · 2020: 4
FWCI
8.87
Type
journal article
Language
en
Open access
Locations
  • The Journal of Experimental Medicine (publishedVersion, cc-by-nc-sa)
  • PubMed Central (publishedVersion, cc-by-nc-sa)
  • PubMed (publishedVersion)
Funders
  • National Institutes of Health (R01CA207189)
  • National Cancer Institute (P30CA030199)
Topics
  • Life Sciences › Biochemistry, Genetics and Molecular Biology › Cancer Research › Cancer, Hypoxia, and Metabolism
  • Health Sciences › Medicine › Oncology › Cancer Cells and Metastasis
  • Health Sciences › Medicine › Oncology › Pancreatic and Hepatic Oncology Research
Keywords
glutamine deprivation, Slug, epithelial-mesenchymal transition, pancreatic ductal adenocarcinoma, nutritional stress, metabolic stress, MEK/ERK signaling, ATF4, metastasis, cell motility, tumor progression
MeSH terms
Snail Family Transcription Factors, Adenocarcinoma, Animals, Cell Movement, Cell Survival, Glutamine, Humans, Mice, Inbred C57BL, Neoplasm Metastasis, Pancreatic Neoplasms, RNA, Messenger, Stress, Physiological, Biomarkers, Tumor, Gene Expression Regulation, Neoplastic, MAP Kinase Signaling System, Carcinoma, Pancreatic Ductal, Cell Line, Tumor, Activating Transcription Factor 4, HEK293 Cells, Epithelial-Mesenchymal Transition

About these checks

Registry, retraction, Cites and statistics results are computed, not judged, with one exception: a printed reference that no index lists is read once by a model before it counts as a citation error. Claims are extracted by a model and kept only when their quote appears verbatim in the text; each cited source is then checked, with a model’s help, for whether it says what the claim relies on. Those verdicts can be wrong — read the claim’s quote and the cited source before relying on one.

Statistics and arithmetic are recomputed, not judged.

Confidence bands are shown only for fields calibrated on our annotated test set. None is calibrated yet, so no band is shown.

What counts as a claim ›How we measure confidence ›How we check this ›

Are you an author, or do you see a problem with this page? Request a review