

The DOI matches its Crossref record; 22 of the 22 references it cites were found in a registry or an index.
Intense 1.5-cycle near infrared laser waveforms and their use for the generation of ultra-broadband soft-x-ray harmonic continua
Open accessAbstract
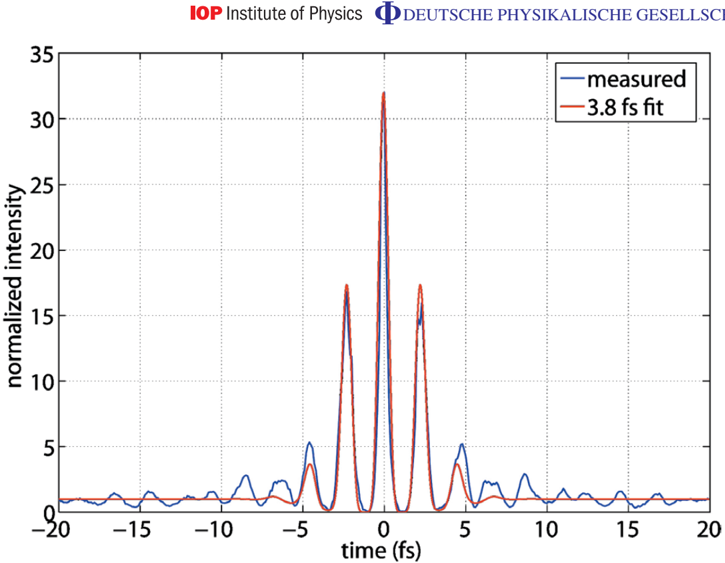
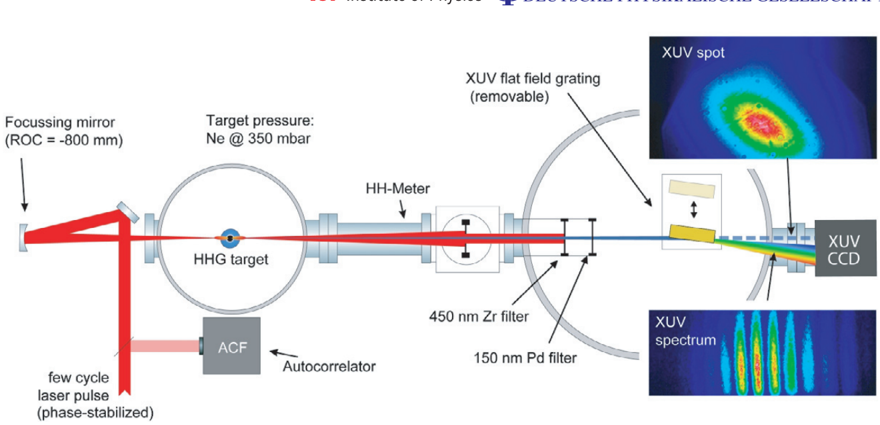
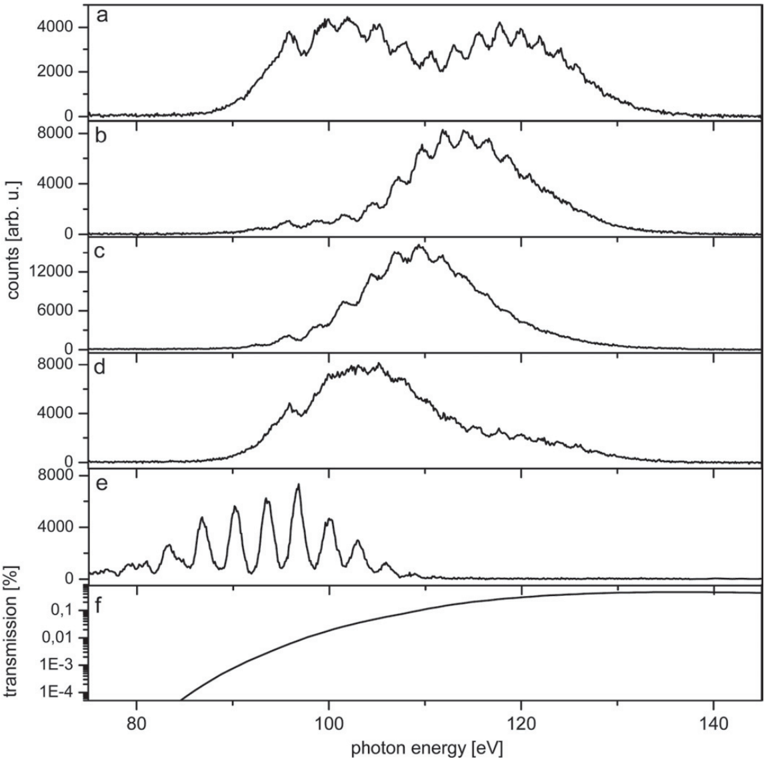
We demonstrate sub-millijoule-energy, sub-4 fs-duration near-infrared laser pulses with a controlled waveform comprised of approximately 1.5 optical cycles within the full-width at half-maximum (FWHM) of their temporal intensity profile. We further demonstrate the utility of these pulses for producing high-order harmonic continua of unprecedented bandwidth at photon energies around 100 eV. Ultra-broadband coherent continua extending from 90 eV to more than 130 eV with smooth spectral intensity distributions that exhibit dramatic, never-before-observed sensitivity to the carrier-envelope offset (CEO) phase of the driver laser pulse were generated. These results suggest the feasibility of sub-100-attosecond XUV pulse generation for attosecond spectroscopy in the 100 eV range, and of a simple yet highly sensitive on-line CEO phase detector with sub-50-ms response time.
Overview
The claims and statistics of this paper haven’t been checked yet.
Run the check — free, no account needed. It reads the open-access text and checks the sources it cites.
Integrity signals
Registry
Cites
Statistics
Figures
Verification
Claims the paper makes
The claims and statistics of this paper haven’t been checked yet.
Run the check — free, no account needed. It reads the open-access text and checks the sources it cites.
Claims other papers make about this one
Each is checked against this paper’s own text: does it say what the citing paper says it does?
In the citing paper
“This pulse has 1.25 of the laser monocycle and its experimental properties were discussed in Ref. [42].”
From Theory of electron Zitterbewegung in graphene probed by femtosecond laser pulses (2009) · cites this paper as [42]
Self-check
Percentages, sums and reported differences re-computed from the paper’s own numbers.
The self-check needs the paper’s full text.
Citations
Cites
Plasma perspective on strong field multiphoton ionization
Corkum, P. B. (1993) · Physical Review Letters · doi:10.1103/physrevlett.71.1994 · Cited by 7,217
Compression of amplified chirped optical pulses
Strickland, D., & Mourou, G. (1985) · Optics Communications · doi:10.1016/0030-4018(85)90120-8 · Cited by 3,937
Hentschel, M., Kienberger, R., Spielmann, C., Reider, G. A., Milosevic, N., Brabec, T., Corkum, P., Heinzmann, U., Drescher, M., & Krausz, F. (2001) · Nature · doi:10.1038/35107000 · Cited by 2,884
Self-citationIsolated Single-Cycle Attosecond Pulses
Sansone, G., Benedetti, E., Calegari, F., Vozzi, C., Avaldi, L., Flammini, R., Poletto, L., Villoresi, P., Altucci, C., Velotta, R., et al. (2006) · Science · doi:10.1126/science.1132838 · Cited by 1,706
Attosecond control of electronic processes by intense light fields
Baltuška, A., Udem, T., Uiberacker, M., Hentschel, M., Goulielmakis, E., Gohle, C., Holzwarth, R., Yakovlev, V. S., Scrinzi, A., Hänsch, T. W., et al. (2003) · Nature · doi:10.1038/nature01414 · Cited by 1,653
Self-citationKienberger, R., Goulielmakis, E., Uiberacker, M., Baltuška, A., Yakovlev, V. S., Bammer, F., Scrinzi, A., Westerwalbesloh, T., Kleineberg, U., Heinzmann, U., et al. (2004) · Nature · doi:10.1038/nature02277 · Cited by 1,344
Self-citationGeneration of high energy 10 fs pulses by a new pulse compression technique
Nisoli, M., Silvestri, S. D., & Svelto, O. (1996) · Applied Physics Letters · doi:10.1063/1.116609 · Cited by 1,048
Generation of intense, carrier-envelope phase-locked few-cycle laser pulses through filamentation
Hauri, C. P., Kornelis, W., Helbing, F. W., Heinrich, A., Couairon, A., Mysyrowicz, A., Biegert, J., & Keller, U. (2004) · Applied Physics B · doi:10.1007/s00340-004-1650-z · Cited by 623
High-Harmonic Generation of Attosecond Pulses in the “Single-Cycle” Regime
Christov, I. P., Murnane, M. M., & Kapteyn, H. C. (1997) · Physical Review Letters · doi:10.1103/physrevlett.78.1251 · Cited by 612
Controlling attosecond electron dynamics by phase-stabilized polarization gating
Sola, Í. J., Mével, E., Elouga, L., Constant, E., Strelkov, V. V., Poletto, L., Villoresi, P., Benedetti, E., Caumes, J.-P., Stagira, S., et al. (2006) · Nature Physics · doi:10.1038/nphys281 · Cited by 487
Cited by
Sorted by citations
Krausz, F., & Ivanov, M. (2009) · Reviews of Modern Physics · doi:10.1103/revmodphys.81.163 · Cited by 5,468
Self-citationGoulielmakis, E., Schultze, M., Hofstetter, M., Yakovlev, V. S., Gagnon, J., Uiberacker, M., Aquila, A., Gullikson, E. M., Attwood, D. T., Kienberger, R., et al. (2008) · Science · doi:10.1126/science.1157846 · Cited by 1,617
Self-citationSchultze, M., Fieß, M., Karpowicz, N., Gagnon, J., Korbman, M., Hofstetter, M., Neppl, S., Cavalieri, A. L., Komninos, Y., Mercouris, T., et al. (2010) · Science · doi:10.1126/science.1189401 · Cited by 1,121
Self-citationThird-generation femtosecond technology
Fattahi, H., Barros, H. G., Gorjan, M., Nubbemeyer, T., Alsaif, B., Teisset, C. Y., Schultze, M., Prinz, S., Haefner, M., Ueffing, M., et al. (2014) · Optica · doi:10.1364/optica.1.000045 · Cited by 400
Self-citationAttosecond Control and Measurement: Lightwave Electronics
Goulielmakis, E., Yakovlev, V. S., Cavalieri, A. L., Uiberacker, M., Pervak, V., Apolonski, A. A., Kienberger, R., Kleineberg, U., & Krausz, F. (2007) · Science · doi:10.1126/science.1142855 · Cited by 388
Self-citationAttosecond physics at the nanoscale
Ciappina, M. F., Pérez-Hernández, J. A., Landsman, A. S., Okell, W. A., Zherebtsov, S., Förg, B., Schötz, J., Seiffert, L., Fennel, T., Shaaran, T., et al. (2017) · Reports on Progress in Physics · doi:10.1088/1361-6633/aa574e · Cited by 347
Self-citationKling, M. F., & Vrakking, M. J. J. (2007) · Annual Review of Physical Chemistry · doi:10.1146/annurev.physchem.59.032607.093532 · Cited by 338
Synthesis of a single cycle of light with compact erbium-doped fibre technology
Krauss, G., Lohss, S., Hanke, T., Sell, A., Eggert, S., Huber, R., & Leitenstorfer, A. (2009) · Nature Photonics · doi:10.1038/nphoton.2009.258 · Cited by 325
Attosecond physics at the nanoscale
Ciappina, M. F., Pérez-Hernández, J. A., Landsman, A. S., Okell, W. A., Zherebtsov, S. V., Förg, B., Schötz, J., Seiffert, L., Fennel, T., Shaaran, T., et al. (2016) · Spiral (Imperial College London) · Cited by 323
Self-citationSingle-shot carrier–envelope phase measurement of few-cycle laser pulses
Wittmann, T., Horvath, B., Helml, W., Schätzel, M. G., Gu, X., Cavalieri, A. L., Paulus, G. G., & Kienberger, R. (2009) · Nature Physics · doi:10.1038/nphys1250 · Cited by 288
Self-citationZherebtsov, S. V., Fennel, T., Plenge, J., Antonsson, E., Znakovskaya, I., Wirth, A., Herrwerth, O., Süßmann, F., Peltz, C., Ahmad, I., et al. (2011) · Nature Physics · doi:10.1038/nphys1983 · Cited by 253
Self-citationAttosecond nonlinear polarization and light–matter energy transfer in solids
Sommer, A., Bothschafter, E. M., Sato, S. A., Jakubeit, C., Latka, T., Razskazovskaya, O., Fattahi, H., Jobst, M., Schweinberger, W., Shirvanyan, V., et al. (2016) · Nature · doi:10.1038/nature17650 · Cited by 252
Self-citationNonlinear Compton scattering in ultrashort laser pulses
Mackenroth, F., & PIAZZA, A. D. (2011) · Physical Review A · doi:10.1103/physreva.83.032106 · Cited by 236
High-energy few-cycle pulses: post-compression techniques
Nagy, T., Simon, P., & Veisz, L. (2020) · Advances in Physics X · doi:10.1080/23746149.2020.1845795 · Cited by 171
Self-citationAttosecond Time-Resolved Photoemission from Core and Valence States of Magnesium
Neppl, S., Ernstorfer, R., Bothschafter, E. M., Cavalieri, A. L., MENZEL, D., Barth, J. V., Krausz, F., Kienberger, R., & Feulner, P. (2012) · Physical Review Letters · doi:10.1103/physrevlett.109.087401 · Cited by 154
Self-citationInvited Article: Attosecond photonics: Synthesis and control of light transients
Hassan, M. T., Wirth, A., Grguraš, I., Moulet, A., Luu, T. T., Gagnon, J., Pervak, V., & Goulielmakis, E. (2012) · Review of Scientific Instruments · doi:10.1063/1.4758310 · Cited by 136
Self-citationTheory of electron Zitterbewegung in graphene probed by femtosecond laser pulses
Rusin, T. M., & Zawadzki, W. (2009) · Physical Review B · doi:10.1103/physrevb.80.045416 · Cited by 133
Determining the Carrier-Envelope Phase of Intense Few-Cycle Laser Pulses
Mackenroth, F., PIAZZA, A. D., & Keitel, C. H. (2010) · Physical Review Letters · doi:10.1103/physrevlett.105.063903 · Cited by 132
High-temporal-resolution electron microscopy for imaging ultrafast electron dynamics
Hassan, M. T., Baskin, J. S., Liao, B., & Zewail, A. H. (2017) · Nature Photonics · doi:10.1038/nphoton.2017.79 · Cited by 128
Absolute timing of the photoelectric effect
Ossiander, M., Riemensberger, J., Neppl, S., Mittermair, M., Schäffer, M., Duensing, A., Wagner, M. S., Heider, R., Wurzer, M., Gerl, M., et al. (2018) · Nature · doi:10.1038/s41586-018-0503-6 · Cited by 127
Self-citationIntense few-cycle light pulses in the deep ultraviolet
Graf, U., Fieß, M., Schultze, M., Kienberger, R., Krausz, F., & Goulielmakis, E. (2008) · Optics Express · doi:10.1364/oe.16.018956 · Cited by 98
Self-citationDouble-angle multilayer mirrors with smooth dispersion characteristics
Pervak, V., Ahmad, I., Trubetskov, M. K., Tikhonravov, A. V., & Krausz, F. (2009) · Optics Express · doi:10.1364/oe.17.007943 · Cited by 97
Self-citationPump and probe ultrafast electron dynamics in LiH: a computational study
Nest, M., Remacle, F., & Levine, R. D. (2008) · New Journal of Physics · doi:10.1088/1367-2630/10/2/025019 · Cited by 96
Chen, X., Jullien, A., Malvache, A., Canova, L., Borot, A., Trisorio, A., Durfee, C. G., & López-Martens, R. (2009) · Optics Letters · doi:10.1364/ol.34.001588 · Cited by 96
Nonlinear pulse compression in a gas-filled multipass cell
Ueffing, M., Reiger, S., Kaumanns, M., Pervak, V., Trubetskov, M. K., Nubbemeyer, T., & Krausz, F. (2018) · Optics Letters · doi:10.1364/ol.43.002070 · Cited by 93
Self-citationWitting, T., Frank, F., Arrell, C., Okell, W. A., Marangos, J. P., & Tisch, J. W. G. (2011) · Optics Letters · doi:10.1364/ol.36.001680 · Cited by 89
Solid-state light-phase detector
Paasch‐Colberg, T., Schiffrin, A., Karpowicz, N., Kruchinin, S. Y., Sağlam, Ö., Keiber, S., Razskazovskaya, O., Muehlbrandt, S., Alnaser, A. S., Kübel, M., et al. (2014) · Nature Photonics · doi:10.1038/nphoton.2013.348 · Cited by 88
Self-citationGeneration of sub-3 fs pulses in the deep ultraviolet
Reiter, F., Graf, U., Schultze, M., Schweinberger, W., Schröder, H., Karpowicz, N., Azzeer, A. M., Kienberger, R., Krausz, F., & Goulielmakis, E. (2010) · Optics Letters · doi:10.1364/ol.35.002248 · Cited by 90
Self-citationTóth, S., Stanislauskas, T., Balčiūnas, I., Budriūnas, R., Adamonis, J., Danilevičius, R., Viskontas, K., Lengvinas, D., Veitas, G., Gadonas, D., et al. (2020) · Journal of Physics Photonics · doi:10.1088/2515-7647/ab9fe1 · Cited by 84
The birth of attosecond physics and its coming of age
Krausz, F. (2016) · Physica Scripta · doi:10.1088/0031-8949/91/6/063011 · Cited by 85
Self-citationSelf-compression of optical laser pulses by filamentation
Mysyrowicz, A., Couairon, A., & Keller, U. (2008) · New Journal of Physics · doi:10.1088/1367-2630/10/2/025023 · Cited by 80
High-power, 1-ps, all-Yb:YAG thin-disk regenerative amplifier
Fattahi, H., Alismail, A., Wang, H., Brons, J., Pronin, O., Buberl, T., Vámos, L., Arisholm, G., Azzeer, A. M., & Krausz, F. (2016) · Optics Letters · doi:10.1364/ol.41.001126 · Cited by 76
Self-citationHigh harmonic generation with long-wavelength few-cycle laser pulses
Schmidt, B. E., Shiner, A. D., Giguère, M., Lassonde, P., Trallero-Herrero, C. A., Kieffer, J. C., Corkum, P. B., Villeneuve, D. M., & Légaré, F. (2012) · Journal of Physics B Atomic Molecular and Optical Physics · doi:10.1088/0953-4075/45/7/074008 · Cited by 70
Simple formula for photoprocesses in ultrashort electromagnetic field
Astapenko, V. A. (2010) · Physics Letters A · doi:10.1016/j.physleta.2010.01.038 · Cited by 70
Third-Generation Femtosecond Technology
Fattahi, H. (2015) · Springer theses · doi:10.1007/978-3-319-20025-5 · Cited by 70
Paasch-Colberg, T., Kruchnin, S., Sağlam, Ö., Kapser, S., Cabrini, S., Muehlbrandt, S., Reichert, J., Barth, J. V., Ernstorfer, R., Kienberger, R., et al. (2016) · Max Planck Digital Library · Cited by 70
Self-citationUltrabroadband, coherent light source based on self-channeling of few-cycle pulses in helium
Goulielmakis, E., Koehler, S., Reiter, B., Schultze, M., Verhoef, A. J., Serebryannikov, E. E., Zheltikov, A. M., & Krausz, F. (2008) · Optics Letters · doi:10.1364/ol.33.001407 · Cited by 67
Self-citationHerrmann, D., Homann, C., Tautz, R., Scharrer, M., Russell, P. S. J., Krausz, F., Veisz, L., & Riedle, E. (2010) · Optics Express · doi:10.1364/oe.18.018752 · Cited by 66
Self-citationHigh-contrast, intense single-cycle pulses from an all thin-solid-plate setup
Seo, M., Khurelbaatar, T., Mitra, S., Kling, M. F., & Kim, D.-E. (2019) · Optics Letters · doi:10.1364/ol.382592 · Cited by 63
Khazanov, E. A. (2022) · Quantum Electronics · doi:10.1070/qel18001 · Cited by 59
Spectral broadening and pulse compression of a 400 μJ, 20 W Yb:KGW laser using a multi-plate medium
Beetar, J. E., Gholam-Mirzaei, S., & Chini, M. (2018) · Applied Physics Letters · doi:10.1063/1.5018758 · Cited by 57
Strong-field control of electron localisation during molecular dissociation
Kling, M. F., Siedschlag, C., Znakovskaya, I., Verhoef, A. J., Zherebtsov, S. V., Krausz, F., Lezius, M., & Vrakking, M. J. J. (2008) · Molecular Physics · doi:10.1080/00268970701864739 · Cited by 54
Self-citationFrontend light source for short-pulse pumped OPCPA system
Ahmad, I., Trushin, S. A., Major, Z., Wandt, C., Klingebiel, S., Wang, T.-J., Pervak, V., Popp, A., Siebold, M., Krausz, F., et al. (2009) · Applied Physics B · doi:10.1007/s00340-009-3599-4 · Cited by 53
Self-citationWeigand, R., Mendonça, J. T., & Crespo, H. (2009) · Physical Review A · doi:10.1103/physreva.79.063838 · Cited by 50
Versatile apparatus for attosecond metrology and spectroscopy
Fieß, M., Schultze, M., Goulielmakis, E., Dennhardt, B., Gagnon, J., Hofstetter, M., Kienberger, R., & Krausz, F. (2010) · Review of Scientific Instruments · doi:10.1063/1.3475689 · Cited by 53
Self-citationWitting, T., Frank, F., Okell, W. A., Arrell, C., Marangos, J. P., & Tisch, J. W. G. (2012) · Journal of Physics B Atomic Molecular and Optical Physics · doi:10.1088/0953-4075/45/7/074014 · Cited by 49
Towards gigawatt terahertz emission by few-cycle laser pulses
Wang, W., Kawata, S., Sheng, Z. M., Li, Y., & Zhang, J. (2011) · Physics of Plasmas · doi:10.1063/1.3614522 · Cited by 49
Electronic wave packet motion in water dimer cation: A many electron description
Periyasamy, G., Levine, R. D., & Remacle, F. (2009) · Chemical Physics · doi:10.1016/j.chemphys.2009.08.004 · Cited by 49
State-of-the-art attosecond metrology
Schultze, M., Wirth, A., Grguraš, I., Uiberacker, M., Uphues, T., Verhoef, A. J., Gagnon, J., Hofstetter, M., Kleineberg, U., Goulielmakis, E., et al. (2011) · Journal of Electron Spectroscopy and Related Phenomena · doi:10.1016/j.elspec.2011.01.003 · Cited by 50
Self-citationRobust synthesis of dispersive mirrors
Pervak, V., Trubetskov, M. K., & Tikhonravov, A. V. (2011) · Optics Express · doi:10.1364/oe.19.002371 · Cited by 48
Self-citationObtaining two attosecond pulses for X-ray stimulated Raman spectroscopy
Zholents, A. A., & Penn, G. (2009) · Nuclear Instruments and Methods in Physics Research Section A Accelerators Spectrometers Detectors and Associated Equipment · doi:10.1016/j.nima.2009.10.063 · Cited by 48
Seipt, D., & Kämpfer, B. (2013) · Physical Review A · doi:10.1103/physreva.88.012127 · Cited by 48
Ma, X., Dostál, J., & Brixner, T. (2016) · Optics Express · doi:10.1364/oe.24.020781 · Cited by 47
Direct regenerative amplification of femtosecond pulses to the multimillijoule level
Ueffing, M., Lange, R., Pleyer, T., Pervak, V., Metzger, T., Sutter, D. H., Major, Z., Nubbemeyer, T., & Krausz, F. (2016) · Optics Letters · doi:10.1364/ol.41.003840 · Cited by 46
Self-citationTime-domain ptychography of over-octave-spanning laser pulses in the single-cycle regime
Witting, T., Greening, D., Walke, D., Matía-Hernando, P., Barillot, T. R., Marangos, J. P., & Tisch, J. W. G. (2016) · Optics Letters · doi:10.1364/ol.41.004218 · Cited by 45
Fattahi, H., Schwarz, A., Keiber, S., & Karpowicz, N. (2013) · Optics Letters · doi:10.1364/ol.38.004216 · Cited by 44
Route to Attosecond Nonlinear Spectroscopy
Reiter, F., Graf, U., Serebryannikov, E. E., Schweinberger, W., Fieß, M., Schultze, M., Azzeer, A. M., Kienberger, R., Krausz, F., Zheltikov, A. M., et al. (2010) · Physical Review Letters · doi:10.1103/physrevlett.105.243902 · Cited by 44
Self-citationSingle attosecond light pulses from multi-cycle laser sources
Altucci, C., Tisch, J. W. G., & Velotta, R. (2011) · Journal of Modern Optics · doi:10.1080/09500340.2011.611913 · Cited by 45
Tracking nuclear wave-packet dynamics in molecular oxygen ions with few-cycle infrared laser pulses
De, S., Бочарова, И. А., Magrakvelidze, M., Ray, D., Cao, W., Bergues, B., Thumm, U., Kling, M. F., Litvinyuk, I. V., & Cocke, C. L. (2010) · Physical Review A · doi:10.1103/physreva.82.013408 · Cited by 43
Schweinberger, W., Sommer, A. M., Bothschafter, E. M., Li, J., Krausz, F., Kienberger, R., & Schultze, M. (2012) · Optics Letters · doi:10.1364/ol.37.003573 · Cited by 42
Self-citationFew-cycle optical probe-pulse for investigation of relativistic laser-plasma interactions
Schwab, M., Sävert, A., Jäckel, O., Polz, J., Schnell, M., Rinck, T., Veisz, L., Möller, M., Hansinger, P., Paulus, G. G., et al. (2013) · Applied Physics Letters · doi:10.1063/1.4829489 · Cited by 43
Self-citationAperiodic CrSc multilayer mirrors for attosecond water window pulses
Guggenmos, A., Rauhut, R., Hofstetter, M., Hertrich, S., Nickel, B. A., Schmidt, J., Gullikson, E. M., Seibald, M., Schnick, W., & Kleineberg, U. (2013) · Optics Express · doi:10.1364/oe.21.021728 · Cited by 41
Chirped-pulse amplification of laser pulses with dispersive mirrors
Pervak, V., Ahmad, I., Trushin, S. A., Major, Z., Apolonski, A. A., Karsch, S., & Krausz, F. (2009) · Optics Express · doi:10.1364/oe.17.019204 · Cited by 41
Self-citationTemporal focusing of ultrashort pulsed Bessel beams into Airy–Bessel light bullets
Piksarv, P., Valtna-Lukner, H., Valdmann, A., Lõhmus, M., Matt, R., & Saari, P. (2012) · Optics Express · doi:10.1364/oe.20.017220 · Cited by 40
Hwang, S. I., Park, S. B., Mun, J. H., Cho, W., Nam, C. H., & Kim, K. T. (2019) · Scientific Reports · doi:10.1038/s41598-018-38220-z · Cited by 40
Hong, W., Li, Y., Lu, P., Lan, P., Zhang, Q., & Wang, X. (2008) · Journal of the Optical Society of America B · doi:10.1364/josab.25.001684 · Cited by 40
Chirped multilayer hollow waveguides with broadband transmission
Husakov, A., & Herrmann, J. (2009) · Optics Express · doi:10.1364/oe.17.003025 · Cited by 39
Alonso, B., Sola, Í. J., & Crespo, H. (2018) · Scientific Reports · doi:10.1038/s41598-018-21701-6 · Cited by 39
Coherent control of broadband isolated attosecond pulses in a chirped two-color laser field
Zou, P., Zeng, Z., Zheng, Y., Lu, Y., Liu, P., Li, R., & Xu, Z. (2010) · Physical Review A · doi:10.1103/physreva.81.033428 · Cited by 38
Hollow-core fiber compression of a commercial Yb:KGW laser amplifier
Beetar, J. E., Rivas, F., Gholam-Mirzaei, S., Liu, Y., & Chini, M. (2018) · Journal of the Optical Society of America B · doi:10.1364/josab.36.000a33 · Cited by 38
Recent development and new ideas in the field of dispersive multilayer optics
Pervak, V. (2010) · Applied Optics · doi:10.1364/ao.50.000c55 · Cited by 38
Self-citationNonlinear Breit-Wheeler process in short laser double pulses
Titov, A. I., Takabe, H., & Kämpfer, B. (2018) · Physical review. D/Physical review. D. · doi:10.1103/physrevd.98.036022 · Cited by 35
A flexible apparatus for attosecond photoelectron spectroscopy of solids and surfaces
Magerl, E., Neppl, S., Cavalieri, A. L., Bothschafter, E. M., Stanislawski, M., Uphues, T., Hofstetter, M., Kleineberg, U., Barth, J. V., MENZEL, D., et al. (2011) · Review of Scientific Instruments · doi:10.1063/1.3596564 · Cited by 34
Self-citationMuskatel, B. H., Remacle, F., & Levine, R. D. (2009) · Physica Scripta · doi:10.1088/0031-8949/80/04/048101 · Cited by 32
Empirical formula for over-barrier strong-field ionization
Zhang, Q., Lan, P., & Lu, P. (2014) · Physical Review A · doi:10.1103/physreva.90.043410 · Cited by 31
Determination of the carrier envelope phase for short, circularly polarized laser pulses
Titov, A. I., Kämpfer, B., Hosaka, A., Nousch, T., & Seipt, D. (2016) · Physical review. D/Physical review. D. · doi:10.1103/physrevd.93.045010 · Cited by 30
Lanthanum–molybdenum multilayer mirrors for attosecond pulses between 80 and 130 eV
Hofstetter, M., Aquila, A., Schultze, M., Guggenmos, A., Yang, S., Gullikson, E. M., Huth, M., Nickel, B. A., Gagnon, J., Yakovlev, V. S., et al. (2011) · New Journal of Physics · doi:10.1088/1367-2630/13/6/063038 · Cited by 28
Self-citationRyabikin, M. Y., Emelin, M. Y., & Strelkov, V. V. (2021) · Physics-Uspekhi · doi:10.3367/ufne.2021.10.039078 · Cited by 30
Chen, X., Malvache, A., Ricci, A., Jullien, A., & López-Martens, R. (2010) · Laser Physics · doi:10.1134/s1054660x11010063 · Cited by 27
Coupling between energy and phase in hollow-core fiber based f-to-2f interferometers
Wang, H., Chini, M., Moon, E. W., Mashiko, H., Li, C., & Chang, Z. (2009) · Optics Express · doi:10.1364/oe.17.012082 · Cited by 27
Wang, J., Ota, S., Edlbauer, H., Jadot, B., Mortemousque, P.-A., Richard, A., Okazaki, Y., Nakamura, S., Ludwig, A., Wieck, A. D., et al. (2022) · Physical Review X · doi:10.1103/physrevx.12.031035 · Cited by 26
Photoinduced melting of the orbital order in La 0.5 Sr 1.5 MnO 4 measured with 4- fs laser pulses
Singla, R., Simoncig, A., Först, M., Prabhakaran, D., Cavalieri, A. L., & Cavalleri, A. (2013) · Physical Review B · doi:10.1103/physrevb.88.075107 · Cited by 26
Self-citationSpatio-temporal characterization of intense few-cycle 2 μm pulses
Austin, D. R., Witting, T., Weber, S. J., Ye, P., Siegel, T., Matía-Hernando, P., Johnson, A. S., Tisch, J. W. G., & Marangos, J. P. (2016) · Optics Express · doi:10.1364/oe.24.024786 · Cited by 26
Adjustable pulse compression scheme for generation of few-cycle pulses in the midinfrared
Demircan, A., Amiranashvili, S., Brée, C., Morgner, U., & Steinmeyer, G. (2014) · Optics Letters · doi:10.1364/ol.39.002735 · Cited by 25
Wünsche, M., Fuchs, S., Aull, S., Nathanael, J., Möller, M., Rödel, C., & Paulus, G. G. (2017) · Optics Express · doi:10.1364/oe.25.006936 · Cited by 24
Quantum processes in short and intensive electromagnetic fields
Titov, A. I., Kämpfer, B., Hosaka, A., & Takabe, H. (2016) · Physics of Particles and Nuclei · doi:10.1134/s1063779616030059 · Cited by 24
Nonlinear Attosecond Metrology by Intense Isolated Attosecond Pulses
Takahashi, E. J., Lan, P., Mücke, O. D., Nabekawa, Y., & Midorikawa, K. (2015) · IEEE Journal of Selected Topics in Quantum Electronics · doi:10.1109/jstqe.2015.2405899 · Cited by 22
Study of Zitterbewegung in graphene bilayer with perpendicular magnetic field
Wang, Y., Yang, Z. M., & Xiong, S. (2010) · Europhysics Letters (EPL) · doi:10.1209/0295-5075/89/17007 · Cited by 22
Collinear generation of ultrashort UV and XUV pulses
Bothschafter, E. M., Schiffrin, A., Yakovlev, V. S., Azzeer, A. M., Krausz, F., Ernstorfer, R., & Kienberger, R. (2010) · Optics Express · doi:10.1364/oe.18.009173 · Cited by 21
Self-citationChirp-dependent attosecond interference in the Coulomb–Volkov continuum
Yudin, G. L., Patchkovskii, S., & Bandrauk, A. D. (2008) · Journal of Physics B Atomic Molecular and Optical Physics · doi:10.1088/0953-4075/41/4/045602 · Cited by 21
Hong, W., Lu, P., Lan, P., Li, Q., Zhang, Q., Yang, Z., & Wang, X. (2008) · Physical Review A · doi:10.1103/physreva.78.063407 · Cited by 20
Attosecond control of tunneling ionization and electron trajectories
Fieß, M., Horvath, B., Wittmann, T., Helml, W., Cheng, Y., Zeng, B., Xu, Z., Scrinzi, A., Gagnon, J., Krausz, F., et al. (2011) · New Journal of Physics · doi:10.1088/1367-2630/13/3/033031 · Cited by 20
Self-citationInterferometric time-domain ptychography for ultrafast pulse characterization
Hyyti, J., Escoto, E., Steinmeyer, G., & Witting, T. (2017) · Optics Letters · doi:10.1364/ol.42.002185 · Cited by 20
Generation of sub-10 fs ultraviolet Gaussian pulses
Kida, Y., & Kobayashi, T. (2010) · Journal of the Optical Society of America B · doi:10.1364/josab.28.000139 · Cited by 20
Tunable high-order harmonic generation and the role of the folded quantum path
Zeng, Z., Cheng, Y., Fu, Y., Song, X., Li, R., & Xu, Z. (2008) · Physical Review A · doi:10.1103/physreva.77.023416 · Cited by 19
Pi, Z., Kim, H. Y., & Goulielmakis, E. (2022) · Optics Letters · doi:10.1364/ol.474872 · Cited by 18
Self-citationSub-cycle light transients for attosecond, X-ray, four-dimensional imaging
Fattahi, H. (2016) · Contemporary Physics · doi:10.1080/00107514.2016.1231870 · Cited by 18
Optical-field-induced current in dielectrics
Paasch‐Colberg, T., Schiffrin, A., Karpowicz, N., Apalkov, V., Gerster, D., Muehlbrandt, S., Korbman, M., Reichert, J., Schultze, M., Holzner, S., et al. (2013) · Conference on Lasers and Electro-Optics · doi:10.1364/cleo_qels.2013.qth4d.5 · Cited by 22
Self-citationGeneration of intense extreme supercontinuum radiation via resonant propagation effects
Yang, W., Song, X., Li, R., & Xu, Z. (2008) · Physical Review A · doi:10.1103/physreva.78.023836 · Cited by 17
High harmonic generation with a spatially filtered optical parametric amplifier
Bandulet, H. C., Comtois, D., Shiner, A. D., Trallero-Herrero, C. A., Kajumba, N., Ozaki, T., Corkum, P. B., Villeneuve, D. M., Kieffer, J. C., & Légaré, F. (2008) · Journal of Physics B Atomic Molecular and Optical Physics · doi:10.1088/0953-4075/41/24/245602 · Cited by 17
Metadata
- Authors
- Cavalieri, A. L., Goulielmakis, E., Horvath, B., Helml, W., Schultze, M., Fieß, M., Pervak, V, Veisz, L., Yakovlev, V. S., Uiberacker, M., Apolonski, A., Krausz, F., & Kienberger, R.
- Affiliations
- Max Planck Institute of Quantum Optics (DE)
- Ludwig-Maximilians-Universität München (DE)
- Corresponding author
- Horvath, B
- ORCID
- Venue
- New Journal of Physics
- Publisher
- IOP Publishing
- Published
- 2007-07-31
- Volume
- 9
- Issue
- 7
- Pages
- 242-242
- ISSN
- 1367-2630 (ISSN-L)
- OpenAlex
- W2076180515
- Cited by
- 197
- References
- 22
- Citations by year
- 2026: 1 · 2025: 6 · 2024: 2 · 2023: 1 · 2022: 5 · 2021: 3 · 2020: 3 · 2019: 4 · 2018: 12 · 2017: 14 · 2016: 15 · 2015: 7 · 2014: 8 · 2013: 12 · 2012: 12
- FWCI
- 15.10
- Type
- journal article
- Language
- en
- Open access
- gold
- doi.org
- Licence
- cc-by
- Locations
- New Journal of Physics (publishedVersion, cc-by)
- Max Planck Institute for Plasma Physics (submittedVersion)
- The HKU Scholars Hub (University of Hong Kong) (submittedVersion)
- mediaTUM – the media and publications repository of the Technical University Munich (Technical University Munich) (submittedVersion, other-oa)
- MPG.PuRe (Max Planck Society) (submittedVersion)
- Funders
- Laserlab-Europe
- European Commission
- Deutsche Forschungsgemeinschaft
- Topics
- Physical Sciences › Physics and Astronomy › Atomic and Molecular Physics, and Optics › Laser-Matter Interactions and Applications
- Physical Sciences › Physics and Astronomy › Radiation › Advanced X-ray Imaging Techniques
- Physical Sciences › Engineering › Industrial and Manufacturing Engineering › Laser Material Processing Techniques
- Keywords
- near-infrared pulses, high harmonic generation, attosecond spectroscopy, few-cycle pulses
About these checks
Registry, retraction, Cites and statistics results are computed, not judged, with one exception: a printed reference that no index lists is read once by a model before it counts as a citation error. Claims are extracted by a model and kept only when their quote appears verbatim in the text; each cited source is then checked, with a model’s help, for whether it says what the claim relies on. Those verdicts can be wrong — read the claim’s quote and the cited source before relying on one.
Statistics and arithmetic are recomputed, not judged.
Confidence bands are shown only for fields calibrated on our annotated test set. None is calibrated yet, so no band is shown.
What counts as a claim ›How we measure confidence ›How we check this ›
Are you an author, or do you see a problem with this page? Request a review
