

Triangular color codes on trivalent graphs with flag qubits
Open accessThe DOI matches its Crossref record; 54 of the 56 references it cites were found in a registry or an index.
Abstract
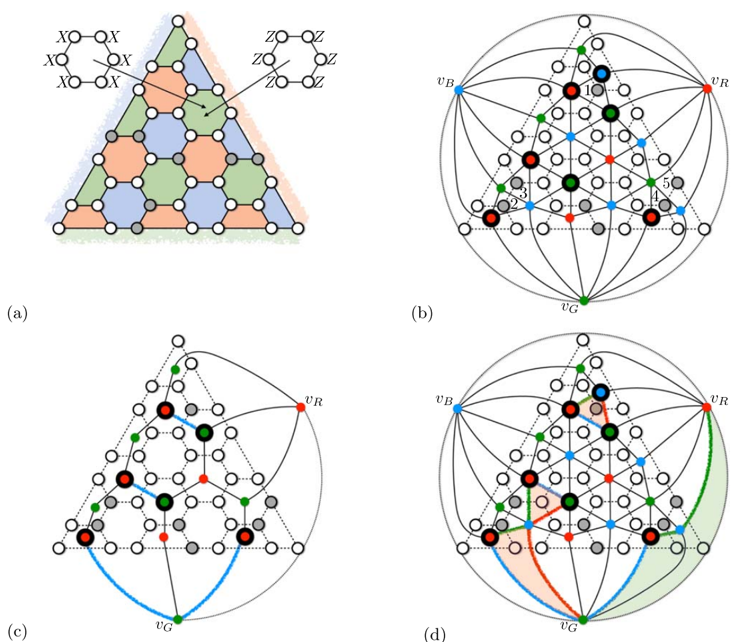
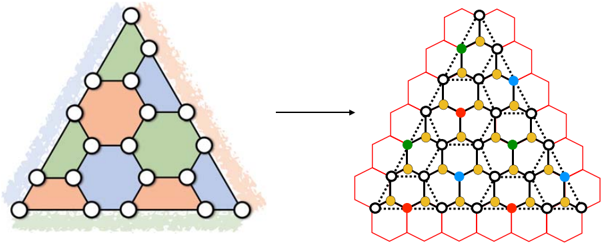
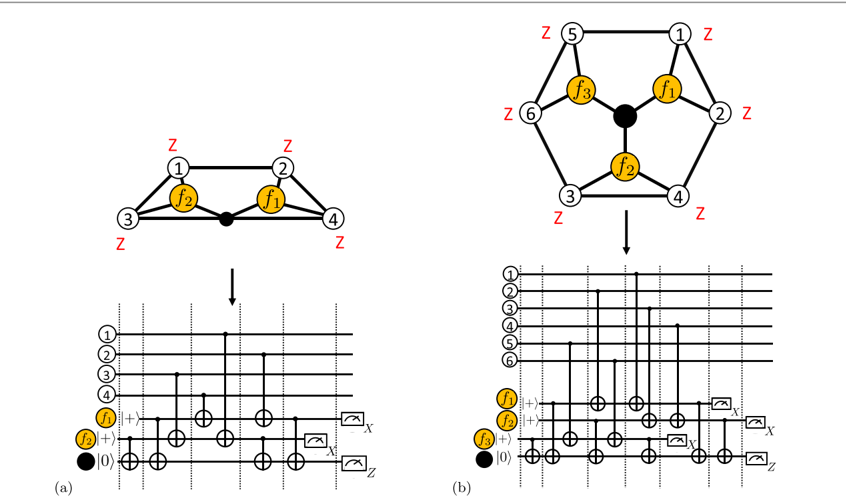
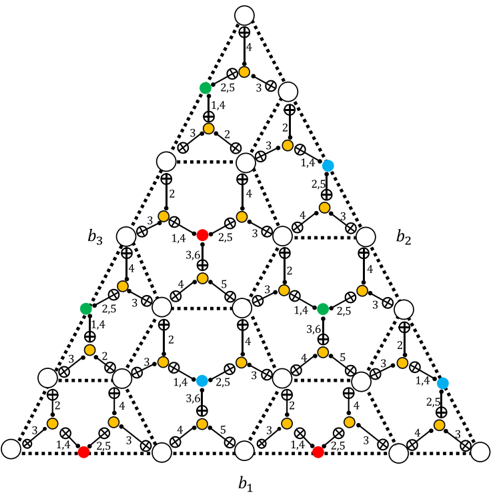
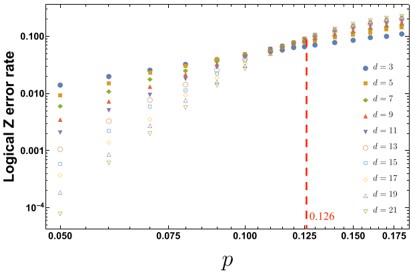
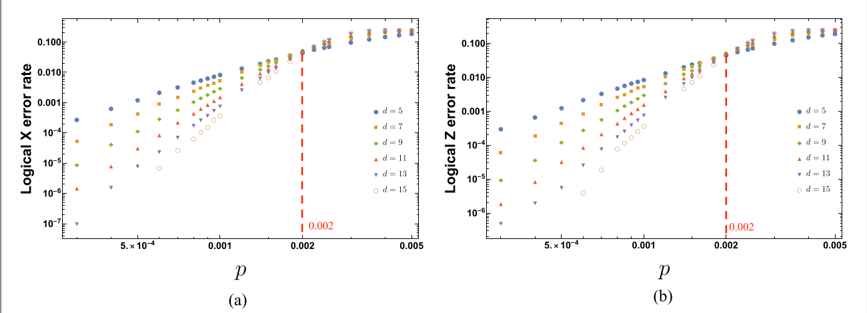
The color code is a topological quantum error-correcting code supporting a variety of valuable fault-tolerant logical gates. Its two-dimensional version, the triangular color code, may soon be realized with currently available superconducting hardware despite constrained qubit connectivity. To guide this experimental effort, we study the storage threshold of the triangular color code against circuit-level depolarizing noise. First, we adapt the Restriction Decoder to the setting of the triangular color code and to phenomenological noise. Then, we propose a fault-tolerant implementation of the stabilizer measurement circuits, which incorporates flag qubits. We show how information from flag qubits can be used in an efficient and scalable way with the Restriction Decoder to maintain the effective distance of the code. We numerically estimate the threshold of the triangular color code to be 0.2%, which is competitive with the thresholds of other topological quantum codes. We also prove that 1-flag stabilizer measurement circuits are sufficient to preserve the full code distance, which may be used to find simpler syndrome extraction circuits of the color code.
Overview
The claims and statistics of this paper haven’t been checked yet.
Free: it reads the open-access text and checks the first 5 claims that cite a source we can check. Create a free account to check every claim.
Integrity signals
Registry
Cites
Statistics
Figures
Verification
Claims the paper makes
The claims and statistics of this paper haven’t been checked yet.
Free: it reads the open-access text and checks the first 5 claims that cite a source we can check. Create a free account to check every claim.
Claims other papers make about this one
Each is checked against this paper’s own text: does it say what the citing paper says it does?
The cited source says what the claim attributes to it.
In the citing paper
“However, we emphasize that the techniques used here directly apply to larger-distance colour codes92.”
From Logical quantum processor based on reconfigurable atom arrays (2024) · cites this paper as [92]
Self-check
Percentages, sums and reported differences re-computed from the paper’s own numbers.
The self-check needs the paper’s full text.
Citations
Cites
Algorithms for quantum computation: discrete logarithms and factoring
Shor, P. W. (2002) · Proceedings 35th Annual Symposium on Foundations of Computer Science · doi:10.1109/sfcs.1994.365700 · Cited by 8,713
Fault-tolerant quantum computation by anyons
Kitaev, A. Y. (2003) · Annals of Physics · doi:10.1016/s0003-4916(02)00018-0 · Cited by 7,238
Surface codes: Towards practical large-scale quantum computation
Fowler, A. G., Mariantoni, M., Martinis, J. M., & Cleland, A. N. (2012) · Physical Review A · doi:10.1103/physreva.86.032324 · Cited by 3,059 · cited 2×
“Measurement errors result in 3D vertical edges connecting the same vertex in two different syndrome measurement rounds (see for instance [60]).”
BackgroundEdmonds, J. (1965) · Canadian Journal of Mathematics · doi:10.4153/cjm-1965-045-4 · Cited by 2,428 · cited 2×
“[50] Jack Edmonds.”
MethodDennis, E., Kitaev, A., Landahl, A., & Preskill, J. (2002) · Journal of Mathematical Physics · doi:10.1063/1.1499754 · Cited by 1,768
Quantum error correction for quantum memories
Terhal, B. M. (2015) · Reviews of Modern Physics · doi:10.1103/revmodphys.87.307 · Cited by 1,354
Quantum computing with realistically noisy devices
Knill, E. (2005) · Nature · doi:10.1038/nature03350 · Cited by 1,184
Stabilizer Codes and Quantum Error Correction
Gottesman, D. (1997) · arXiv · doi:10.48550/arxiv.quant-ph/9705052 · Cited by 753
Topological Quantum Distillation
Bombin, H., & Martin-Delgado, M. A. (2006) · Physical Review Letters · doi:10.1103/physrevlett.97.180501 · Cited by 700 · cited 2×
“The color code is distinguished in this latter sense since, unlike for the toric code, all logical Clifford gates can be implemented transversally [14–17].”
Simple All-Microwave Entangling Gate for Fixed-Frequency Superconducting Qubits
Chow, J. M., Córcoles, A. D., Gambetta, J. M., Rigetti, C., Johnson, B. R., Smolin, J. A., Rozen, J. R., Keefe, G. A., Rothwell, M. B., Ketchen, M. B., et al. (2011) · Physical Review Letters · doi:10.1103/physrevlett.107.080502 · Cited by 464
Research works printed but not linked: 1
- Wang, 2010, Graphical algorithms and threshold error rates for the 2d colour code, Quantum Inf. Comput., 10, 780
Cited by
Logical quantum processor based on reconfigurable atom arrays
Bluvstein, D., Evered, S. J., Geim, A. A., Li, S. H., Zhou, H., Manovitz, T., Ebadi, S., Cain, M., Kalinowski, M., Hangleiter, D., et al. (2024) · Nature · doi:10.1038/s41586-023-06927-3 · Cited by 1,119
“This d = 3 colour code is identical to the seven-qubit Steane code. we emphasize that the techniques used here directly apply to larger-distance colour codes 92 .”
MethodBuilding a Fault-Tolerant Quantum Computer Using Concatenated Cat Codes
Chamberland, C., Noh, K., Arrangoiz-Arriola, P., Campbell, E. T., Hann, C. T., Iverson, J., Putterman, H., Bohdanowicz, T. C., Flammia, S. T., Keller, A., et al. (2022) · PRX Quantum · doi:10.1103/prxquantum.3.010329 · Cited by 281
Self-citationEncoding a magic state with beyond break-even fidelity
Gupta, R. S., Sundaresan, N., Alexander, T., Wood, C. J., Merkel, S. T., Healy, M. B., Hillenbrand, M., Jochym-O’Connor, T., Wootton, J. R., Yoder, T. J., et al. (2024) · Nature · doi:10.1038/s41586-023-06846-3 · Cited by 115
Self-citationEfficient classical simulation of noisy random quantum circuits in one dimension
Noh, K., Jiang, L., & Fefferman, B. (2020) · Quantum · doi:10.22331/q-2020-09-11-318 · Cited by 172
“, to perform a detailed circuit-level noise analysis) [8, 9, 16, 19–24].”
MethodFault-Tolerant Continuous-Variable Measurement-based Quantum Computation Architecture
Larsen, M. V., Chamberland, C., Noh, K., Neergaard-Nielsen, J. S., & Andersen, U. L. (2021) · PRX Quantum · doi:10.1103/prxquantum.2.030325 · Cited by 99
Self-citation
Metadata
- Authors
- Chamberland, C., Kubica, A., Yoder, T. J., & Zhu, G.
- Affiliations
- IBM Research - Thomas J. Watson Research Center (US)
- University of Waterloo (CA)
- Corresponding author
- Chamberland, Christopher
- Venue
- New Journal of Physics
- Publisher
- IOP Publishing
- Published
- 2020-02-01
- Volume
- 22
- Issue
- 2
- Pages
- 023019
- ISSN
- 1367-2630 (ISSN-L)
- OpenAlex
- W2984245858
- Cited by
- 105
- References
- 56
- Citations by year
- 2026: 4 · 2025: 14 · 2024: 22 · 2023: 17 · 2022: 17 · 2021: 19 · 2020: 12
- FWCI
- 6.38
- Type
- journal article
- Language
- en
- Open access
- gold
- doi.org
- Licence
- cc-by
- creativecommons.org/licenses/by/4.0/ (vor, 6 d)
- iopscience.iop.org/info/page/text-and-data-mining (tdm, 6 d)
- Locations
- New Journal of Physics (publishedVersion, cc-by)
- arXiv (Cornell University) (submittedVersion)
- DOAJ (DOAJ: Directory of Open Access Journals) (submittedVersion)
- Funders
- Intelligence Advanced Research Projects Activity (W911NF-16-0114)
- Topics
- Physical Sciences › Computer Science › Artificial Intelligence › Quantum Computing Algorithms and Architecture
- Physical Sciences › Physics and Astronomy › Atomic and Molecular Physics, and Optics › Quantum Information and Cryptography
- Physical Sciences › Physics and Astronomy › Atomic and Molecular Physics, and Optics › Quantum many-body systems
- Keywords
- topological quantum error correction, depolarizing noise, syndrome extraction, code distance, cubic graphs, superconducting qubits, fault-tolerant quantum computing
About these checks
Registry, retraction, Cites and statistics results are computed, not judged, with one exception: a printed reference that no index lists is read once by a model before it counts as a citation error. Claims are extracted by a model and kept only when their quote appears verbatim in the text; each cited source is then checked, with a model’s help, for whether it says what the claim relies on. Those verdicts can be wrong — read the claim’s quote and the cited source before relying on one.
Statistics and arithmetic are recomputed, not judged.
Confidence bands are shown only for fields calibrated on our annotated test set. None is calibrated yet, so no band is shown.
What counts as a claim ›How we measure confidence ›How we check this ›
Are you an author, or do you see a problem with this page? Request a review
How to cite
Cite CoChat for the checks on this page, and the paper for its own findings.
- This page
- CoChat. (2026). Citation check: Triangular color codes on trivalent graphs with flag qubits. https://app.cochat.ai/papers/10.1088/1367-2630/ab68fd
- The paper
- Chamberland, C., Kubica, A., Yoder, T. J., & Zhu, G. (2020). Triangular color codes on trivalent graphs with flag qubits. New Journal of Physics. https://doi.org/10.1088/1367-2630/ab68fd
Data sources
Bibliographic data: Semantic Scholar, OpenAlex, Crossref.
Contains information from the Semantic Scholar Academic Graph Datasets, made available under the ODC Attribution License (ODC-BY 1.0).
Semantic Scholar’s data is described in: Kinney, R., et al. (2023). The Semantic Scholar Open Data Platform. arXiv:2301.10140.
