CoChat

Nuclear clocks for testing fundamental physics

Open access
Peik, E, Schumm, T, Safronova, M S, Pálffy, A, Weitenberg, J, Thirolf, P G · 2021 · Quantum Science and Technology

The DOI matches its Crossref record; 183 of the 183 references it cites were found in a registry or an index.

Abstract

The low-energy, long-lived isomer in 229 Th, first studied in the 1970s as an exotic feature in nuclear physics, continues to inspire a multidisciplinary community of physicists. It has stimulated innovative ideas and studies that expand the understanding of atomic and nuclear structure of heavy elements and of the interaction of nuclei with bound electrons and coherent light. Using the nuclear resonance frequency, determined by the strong and electromagnetic interactions inside the nucleus, it is possible to build a highly precise nuclear clock that will be fundamentally different from all other atomic clocks based on resonant frequencies of the electron shell. The nuclear clock will open opportunities for highly sensitive tests of fundamental principles of physics, particularly in searches for violations of Einstein’s equivalence principle and for new particles and interactions beyond the standard model. It has been proposed to use the nuclear clock to search for variations of the electromagnetic and strong coupling constants and for dark matter searches. The 229 Th nuclear optical clock still represents a major challenge in view of the tremendous gap of nearly 17 orders of magnitude between the present uncertainty in the nuclear transition frequency (about 0.2 eV, corresponding to ∼48 THz) and the natural linewidth (in the mHz range). Significant experimental progress has been achieved in recent years, which will be briefly reviewed. Moreover, a research strategy will be outlined to consolidate our present knowledge about essential 229m Th properties, to determine the nuclear transition frequency with laser spectroscopic precision, realize different types of nuclear clocks and apply them in precision frequency comparisons with optical atomic clocks to test fundamental physics. Two avenues will be discussed: laser-cooled trapped 229 Th ions that allow experiments with complete control on the nucleus–electron interaction and minimal systematic frequency shifts, and Th-doped solids enabling experiments at high particle number and in different electronic environments.

Overview

The claims and statistics of this paper haven’t been checked yet.

Free: it reads the open-access text and checks the first 5 claims that cite a source we can check. Create a free account to check every claim.

A few free checks a day · papers already verified open instantly · results are public

Integrity signals

Registry

Crossref · 10.1088/2058-9565/abe9c2

Cites

183 of 183 references verified0 citation errors · 0 not checkable

Statistics

Figures
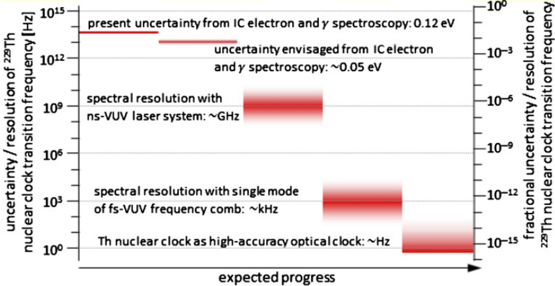
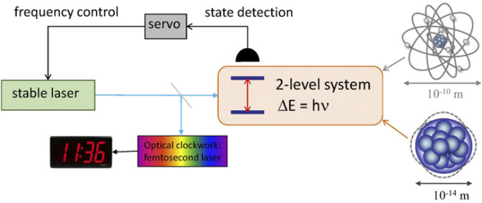
Figure 1 Schematic of an optical atomic clock. The laser oscillator frequency is stabilized to the atomic or nuclear resonance frequency and an optical clockwork is employed to produce a time signal.
Figure 1 Schematic of an optical atomic clock. The laser oscillator frequency is stabilized to the atomic or nuclear resonance frequency and an optical clockwork is employed to produce a time signal.CC-BY · From the PDF
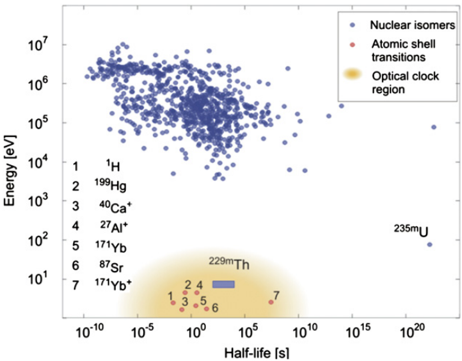
Figure 2 Distribution of excitation energy versus half-life of isomeric nuclear states. Nuclear excitations (blue circles) exhibit typical energies in the range of a few 10 keV up to several MeV. Only two low-energy ( < 1 keV) nuclear states are presently known: 229m Th ( ∼ 8.2 eV, expected energy and half-life range indicated by the blue box) and 235m U(76.7 eV). Due to the extremely small transition strength in 235m U(radiative lifetime ∼ 10 22 s), only 229m Th qualifies for a direct laser excitation and thus for the development of a nuclear clock. In addition, selected atomic shell transitions are included (red circles), which are already in use for optical atomic clocks. Reprinted by permission from Springer Nature [66]. Copyright © 2016, Nature Publishing Group, a division of Macmillan Publishers Limited. All Rights Reserved.
Figure 2 Distribution of excitation energy versus half-life of isomeric nuclear states. Nuclear excitations (blue circles) exhibit typical energies in the range of a few 10 keV up to several MeV. Only two low-energy ( < 1 keV) nuclear states are presently known: 229m Th ( ∼ 8.2 eV, expected energy and half-life range indicated by the blue box) and 235m U(76.7 eV). Due to the extremely small transition strength in 235m U(radiative lifetime ∼ 10 22 s), only 229m Th qualifies for a direct laser excitation and thus for the development of a nuclear clock. In addition, selected atomic shell transitions are included (red circles), which are already in use for optical atomic clocks. Reprinted by permission from Springer Nature [66]. Copyright © 2016, Nature Publishing Group, a division of Macmillan Publishers Limited. All Rights Reserved.CC-BY · From the PDF
Image 3
CC-BY · From the PDF
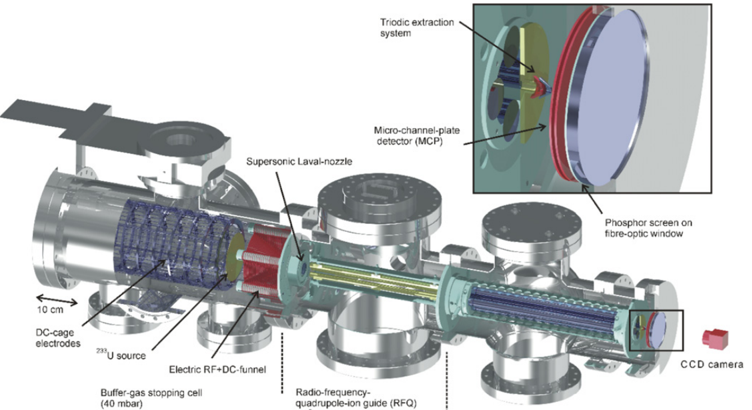
Figure 4 3D technical drawing of the experimental setup employed for the generation of an isotopically clean 229m Th ion beam. It consists (from left to right) of a buffer-gas stopping cell that houses a 233 U α recoil source, a (segmented) radio-frequency quadrupole (RFQ) as ion guide, buncher and phase space cooler, a QMS and (behind a triodic extraction electrode system) a multichannel-plate detector followed by a phosphor screen and a CCD camera. Reprinted by permission from Springer Nature [66]. Copyright © 2016, Nature Publishing Group, a division of Macmillan Publishers Limited. All Rights Reserved. For more details see [63].
Figure 4 3D technical drawing of the experimental setup employed for the generation of an isotopically clean 229m Th ion beam. It consists (from left to right) of a buffer-gas stopping cell that houses a 233 U α recoil source, a (segmented) radio-frequency quadrupole (RFQ) as ion guide, buncher and phase space cooler, a QMS and (behind a triodic extraction electrode system) a multichannel-plate detector followed by a phosphor screen and a CCD camera. Reprinted by permission from Springer Nature [66]. Copyright © 2016, Nature Publishing Group, a division of Macmillan Publishers Limited. All Rights Reserved. For more details see [63].CC-BY · From the PDF
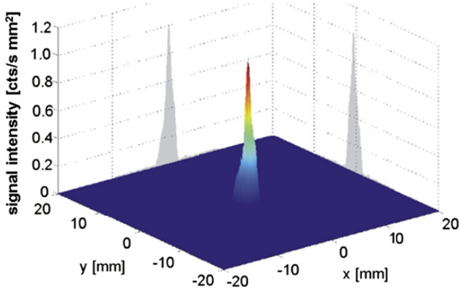
Figure 5 Signal of the first direct detection of the 229m Th decay. Shown is the IC electron signal of 229m Th 3 + ions, which were collected with low kinetic energy directly on the surface of a position-sensitive MCP detector. Reprinted by permission from Springer Nature [66]. Copyright © 2016, Nature Publishing Group, a division of Macmillan Publishers Limited. All Rights Reserved.
Figure 5 Signal of the first direct detection of the 229m Th decay. Shown is the IC electron signal of 229m Th 3 + ions, which were collected with low kinetic energy directly on the surface of a position-sensitive MCP detector. Reprinted by permission from Springer Nature [66]. Copyright © 2016, Nature Publishing Group, a division of Macmillan Publishers Limited. All Rights Reserved.CC-BY · From the PDF
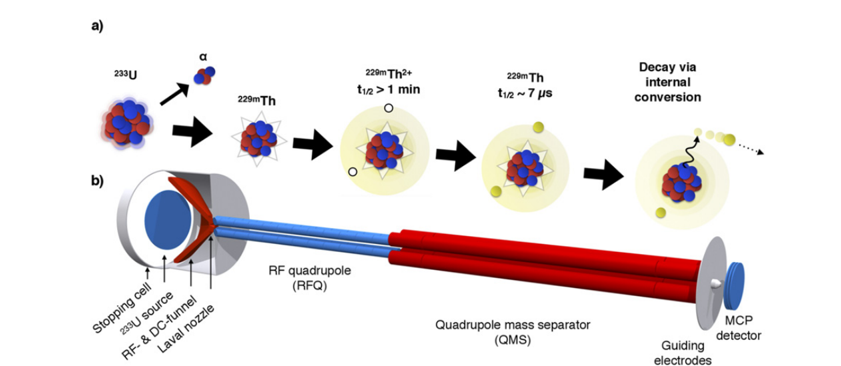
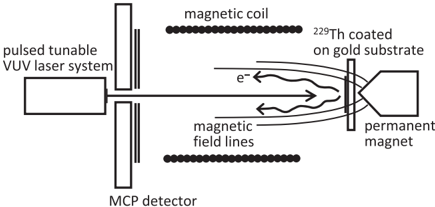
Figure 6 (a) Visualization of the detection scheme reported in [74]. An ion beam is formed from 229m Th ions emerging from a 233 U α -recoil source. As long as 229m Th remains in a charged state, the lifetime is longer than 1 min. The moment the ions neutralize (e.g. by collecting the ions on a metal surface) internal conversion is triggered and the lifetime reduced to the range of μ s. The emitted electron can be detected. (b) Scheme of the experimental setup that was used. Reprinted figure with permission from [74]. Copyright (2017) by the American Physical Society.
Figure 6 (a) Visualization of the detection scheme reported in [74]. An ion beam is formed from 229m Th ions emerging from a 233 U α -recoil source. As long as 229m Th remains in a charged state, the lifetime is longer than 1 min. The moment the ions neutralize (e.g. by collecting the ions on a metal surface) internal conversion is triggered and the lifetime reduced to the range of μ s. The emitted electron can be detected. (b) Scheme of the experimental setup that was used. Reprinted figure with permission from [74]. Copyright (2017) by the American Physical Society.CC-BY · From the PDF
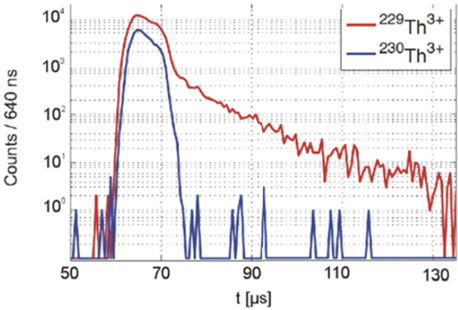
Figure 7 Measurement of the 229m Th IC half-life in neutral thorium. Pulsed 229 Th 3 + ions impinge onto a metallic surface, where they neutralize, followed by time-resolved detection of the resulting IC electrons (red). The measured half-life amounts to about 7 μ s. In addition, the identical measurement is shown for 230 Th 3 + ions (blue), where only the signal of the ionic impact is observed. Reprinted figure with permission from [74]. Copyright (2017) by the American Physical Society.
Figure 7 Measurement of the 229m Th IC half-life in neutral thorium. Pulsed 229 Th 3 + ions impinge onto a metallic surface, where they neutralize, followed by time-resolved detection of the resulting IC electrons (red). The measured half-life amounts to about 7 μ s. In addition, the identical measurement is shown for 230 Th 3 + ions (blue), where only the signal of the ionic impact is observed. Reprinted figure with permission from [74]. Copyright (2017) by the American Physical Society.CC-BY · From the PDF
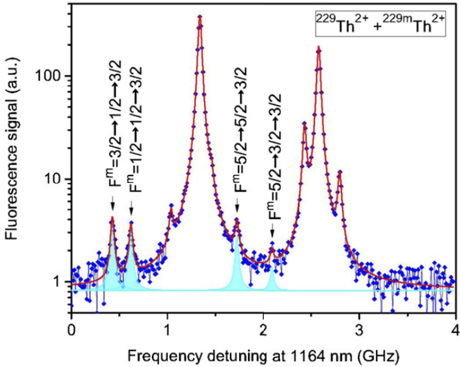
Figure 8 Hyperfine structure resonances of nuclear isomeric and ground states. The spectrum results from a two-step laser excitation that eliminates Doppler broadening, showing the relative strengths (in logarithmic scale) and frequency range of nuclear isomeric and ground state resonances. Resonances of the nuclear isomer HFS are marked in cyan colour. The unlabeled peaks belong to the nuclear ground state. Reprinted by permission from Springer Nature [77]. Copyright © 2018, Macmillan Publishers Ltd., part of Springer Nature. See section 3.1.4 for further discussion.
Figure 8 Hyperfine structure resonances of nuclear isomeric and ground states. The spectrum results from a two-step laser excitation that eliminates Doppler broadening, showing the relative strengths (in logarithmic scale) and frequency range of nuclear isomeric and ground state resonances. Resonances of the nuclear isomer HFS are marked in cyan colour. The unlabeled peaks belong to the nuclear ground state. Reprinted by permission from Springer Nature [77]. Copyright © 2018, Macmillan Publishers Ltd., part of Springer Nature. See section 3.1.4 for further discussion.CC-BY · From the PDF
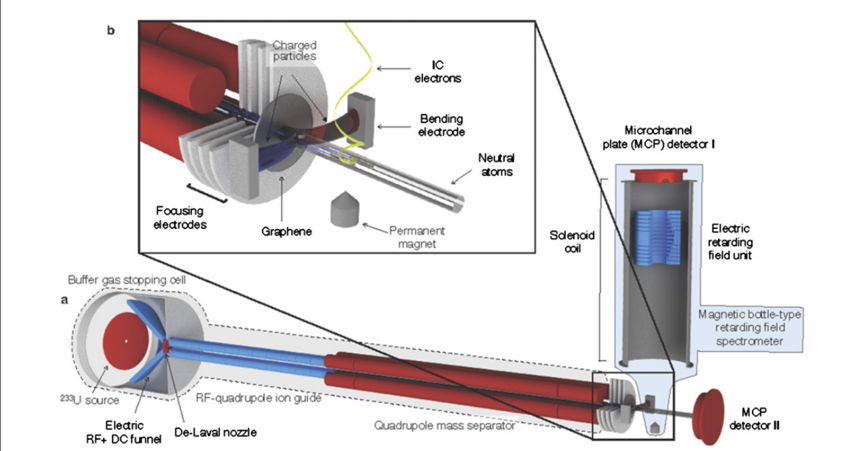
Figure 9 Experimental setup used for the direct measurement of the 229m Th excitation energy via a determination of the kinetic energy of IC electrons in a magnetic-bottle-type electron spectrometer. The front part is identical to the setup to generate a clean 229m Th ion beam, already described in figures 4 and 6, now complemented by the electron spectrometer (right-hand side) placed behind a graphene neutralization foil and an ion removal electrode (also upper left inset). Reprinted by permission from Springer Nature [68]. Copyright © 2019, The Author(s), under exclusive licence to Springer Nature Limited.
Figure 9 Experimental setup used for the direct measurement of the 229m Th excitation energy via a determination of the kinetic energy of IC electrons in a magnetic-bottle-type electron spectrometer. The front part is identical to the setup to generate a clean 229m Th ion beam, already described in figures 4 and 6, now complemented by the electron spectrometer (right-hand side) placed behind a graphene neutralization foil and an ion removal electrode (also upper left inset). Reprinted by permission from Springer Nature [68]. Copyright © 2019, The Author(s), under exclusive licence to Springer Nature Limited.CC-BY · From the PDF
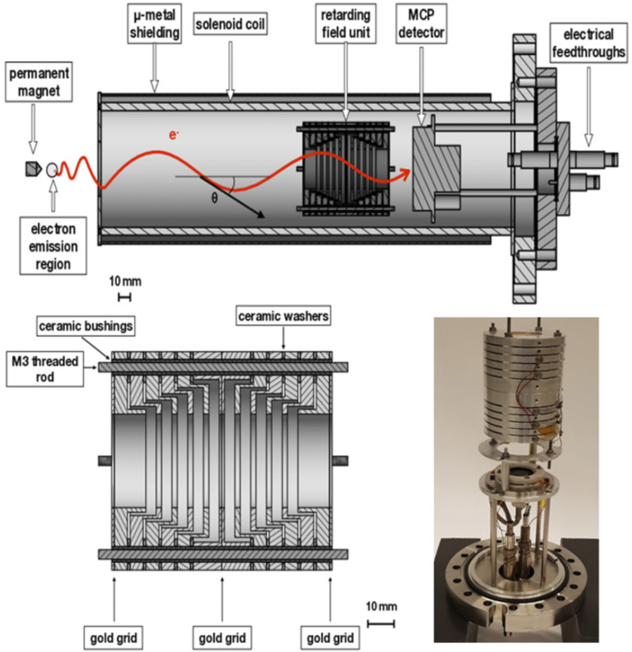
Figure 10 Sectional view and photograph of the magnetic-bottle type retardation electron spectrometer. The upper panel shows an overview of the spectrometer, with the permanent magnet, the solenoid coil, the retarding field unit and the MCP detector. The region of electron emission as well as a helical electron trajectory with its pitch angle θ is indicated. The bottom panel (left) shows a detailed view of the retarding field unit. The positions of the gold grids are indicated by arrows. The bottom right panel shows a photograph of the spectrometer. Reprinted (in parts) from [80], copyright (2019), with permission from Elsevier.
Figure 10 Sectional view and photograph of the magnetic-bottle type retardation electron spectrometer. The upper panel shows an overview of the spectrometer, with the permanent magnet, the solenoid coil, the retarding field unit and the MCP detector. The region of electron emission as well as a helical electron trajectory with its pitch angle θ is indicated. The bottom panel (left) shows a detailed view of the retarding field unit. The positions of the gold grids are indicated by arrows. The bottom right panel shows a photograph of the spectrometer. Reprinted (in parts) from [80], copyright (2019), with permission from Elsevier.CC-BY · From the PDF
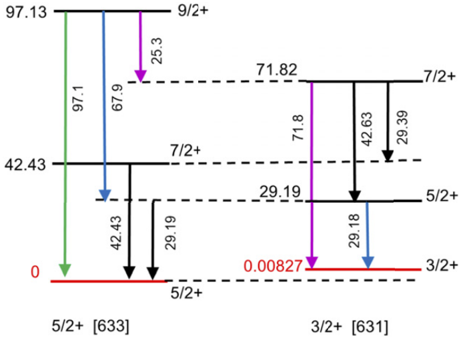
Figure 11 Low-energy part of the 229 Th level scheme (energy units in keV). In square brackets the Nilsson quantum number categorization of the band-head levels is indicated.
Figure 11 Low-energy part of the 229 Th level scheme (energy units in keV). In square brackets the Nilsson quantum number categorization of the band-head levels is indicated.CC-BY · From the PDF
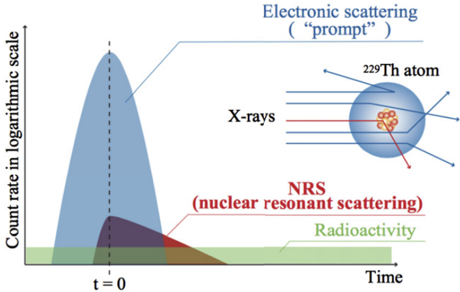
Figure 12 Schematic of temporal profiles of the NRS process. Reprinted by permission from Springer Nature [84]. Copyright © 2019, The Author(s), under exclusive licence to Springer Nature Limited.
Figure 12 Schematic of temporal profiles of the NRS process. Reprinted by permission from Springer Nature [84]. Copyright © 2019, The Author(s), under exclusive licence to Springer Nature Limited.CC-BY · From the PDF
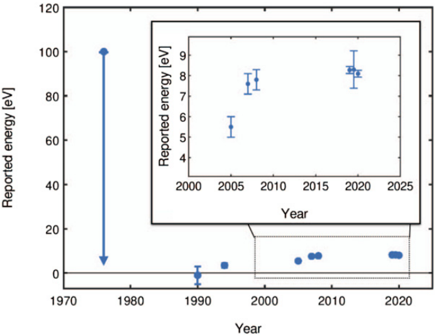
Figure 13 Historical overview of the reported excitation energy of the 229m Th isomer.
Figure 13 Historical overview of the reported excitation energy of the 229m Th isomer.CC-BY · From the PDF
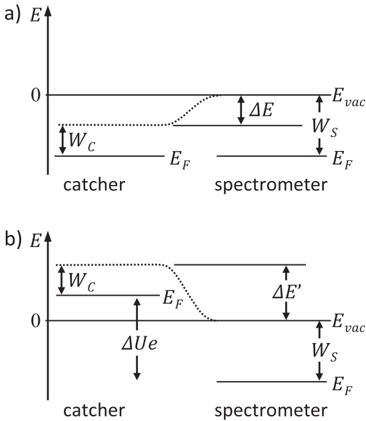
Figure 14 Visualization of the work function of the catcher and spectrometer (see also [96]). Two situations are shown: (a) contact potential difference Δ E generated between the catcher and the spectrometer. (b) Influence of an applied offset voltage Δ U on the contact potential difference. Reproduced from [95]. CC BY 4.0. © The Author(s), 2017.
Figure 14 Visualization of the work function of the catcher and spectrometer (see also [96]). Two situations are shown: (a) contact potential difference Δ E generated between the catcher and the spectrometer. (b) Influence of an applied offset voltage Δ U on the contact potential difference. Reproduced from [95]. CC BY 4.0. © The Author(s), 2017.CC-BY · From the PDF
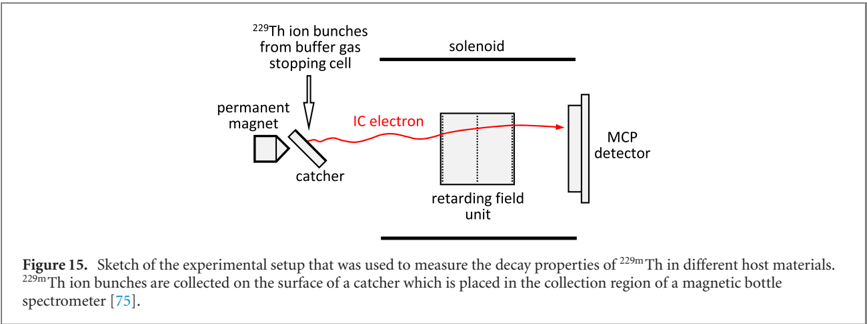
Image 15
CC-BY · From the PDF
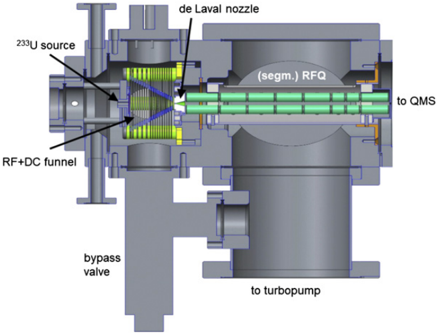
Figure 16 Design sketch (side view) of the new experimental platform for laser-spectroscopic studies of stored thorium ions. A newly designed compact buffer-gas stopping cell containing the 233 Usource and an RF + DCfunnel structure (left side) is followed by an extraction RFQ and a QMS. The central part is formed by the cryogenic linear Paul trap, embedded into 4 K and 40 K cryoshields and cooled to 4 K by a vibrationally decoupled cryocooler head. 12 viewports grant optical access to the trap centre for diagnostics and laser manipulation purposes. A second QMS is mounted on the extraction side of the Paul trap, enabling a mass-selective diagnostic behind the Paul trap and the injection of Sr + ions for sympathetic laser cooling as described in the following.
Figure 16 Design sketch (side view) of the new experimental platform for laser-spectroscopic studies of stored thorium ions. A newly designed compact buffer-gas stopping cell containing the 233 Usource and an RF + DCfunnel structure (left side) is followed by an extraction RFQ and a QMS. The central part is formed by the cryogenic linear Paul trap, embedded into 4 K and 40 K cryoshields and cooled to 4 K by a vibrationally decoupled cryocooler head. 12 viewports grant optical access to the trap centre for diagnostics and laser manipulation purposes. A second QMS is mounted on the extraction side of the Paul trap, enabling a mass-selective diagnostic behind the Paul trap and the injection of Sr + ions for sympathetic laser cooling as described in the following.CC-BY · From the PDF
Figure 17 Left: gold-plated Paul-trap electrodes with surrounding support structure and electrical contact rods. Right: electrode system embedded into the 4 K cryoshield with diagnostic and laser entrance ports.
Figure 17 Left: gold-plated Paul-trap electrodes with surrounding support structure and electrical contact rods. Right: electrode system embedded into the 4 K cryoshield with diagnostic and laser entrance ports.CC-BY · From the PDF
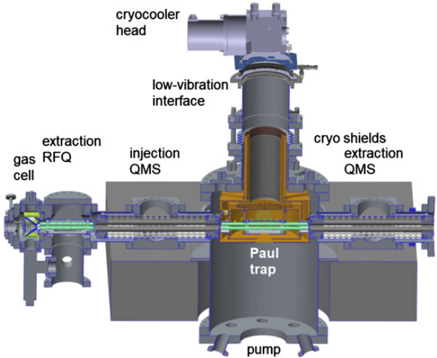
Figure 18 Cryogenic Paul-trap setup with injection (left) and extraction (right) components as presently being commissioned at LMU Munich.
Figure 18 Cryogenic Paul-trap setup with injection (left) and extraction (right) components as presently being commissioned at LMU Munich.CC-BY · From the PDF
Figure 19 Technical drawing of the newly developed compact α recoil source designed for loading the cryogenic Paul trap with 229m Th ions. The buffer-gas stopping cell (containing the 233 Usource and an RF + DCfunnel structure) is connected to the segmented RFQ by a de-Laval nozzle.
Figure 19 Technical drawing of the newly developed compact α recoil source designed for loading the cryogenic Paul trap with 229m Th ions. The buffer-gas stopping cell (containing the 233 Usource and an RF + DCfunnel structure) is connected to the segmented RFQ by a de-Laval nozzle.CC-BY · From the PDF
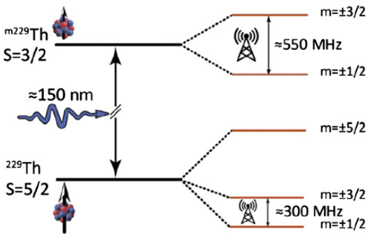
Figure 20 Schematic of nuclear quadrupole splitting emerging for 229 Th ions doped into VUV transparent CaF2 crystals, with approximate transition frequencies in the RF regime.
Figure 20 Schematic of nuclear quadrupole splitting emerging for 229 Th ions doped into VUV transparent CaF2 crystals, with approximate transition frequencies in the RF regime.CC-BY · From the PDF
Figure 21 Range of frequencies for the uncertainty (or resolution) of the 229m Th nuclear clock transition (together with complementary fractional uncertainties on the right-hand side), from our present nuclear-physics based knowledge down to the ultimate goal of a high-accuracy optical nuclear clock operated by resonant laser excitation of the thorium isomer. Expected progress towards the subsequent development stages is indicated by the horizontal location of the respective red areas. Where present, gradient colours indicate an expected uncertainty around a spectral resolution target value as given in the text legend.
Figure 21 Range of frequencies for the uncertainty (or resolution) of the 229m Th nuclear clock transition (together with complementary fractional uncertainties on the right-hand side), from our present nuclear-physics based knowledge down to the ultimate goal of a high-accuracy optical nuclear clock operated by resonant laser excitation of the thorium isomer. Expected progress towards the subsequent development stages is indicated by the horizontal location of the respective red areas. Where present, gradient colours indicate an expected uncertainty around a spectral resolution target value as given in the text legend.CC-BY · From the PDF
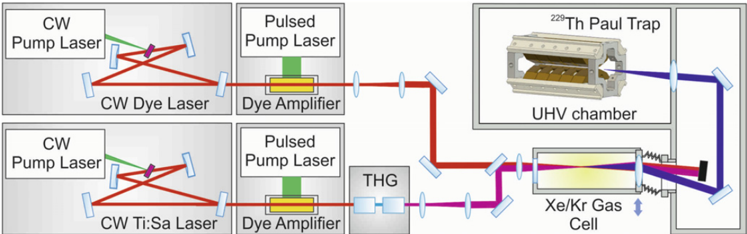
Figure 22 Tunable VUV laser system based on four-wave mixing of amplified laser pulses in Xe or Xe/Kr gas. The pulsed amplifiers are seeded by tunable CW lasers for precise frequency control. The third harmonic of one laser (250 nm) is close to a two-photon resonance in Xe at 9.9 eV and the photon energy from the second laser is subtracted to reach the 8 eV region.
Figure 22 Tunable VUV laser system based on four-wave mixing of amplified laser pulses in Xe or Xe/Kr gas. The pulsed amplifiers are seeded by tunable CW lasers for precise frequency control. The third harmonic of one laser (250 nm) is close to a two-photon resonance in Xe at 9.9 eV and the photon energy from the second laser is subtracted to reach the 8 eV region.CC-BY · From the PDF
Figure 23 Schematical view of the experimental scheme for direct laser excitation of 229m Th making use of the IC decay channel in the neutral thorium isomer. Reprinted figure with permission from [115]. Copyright (2017) by the American Physical Society.
Figure 23 Schematical view of the experimental scheme for direct laser excitation of 229m Th making use of the IC decay channel in the neutral thorium isomer. Reprinted figure with permission from [115]. Copyright (2017) by the American Physical Society.CC-BY · From the PDF
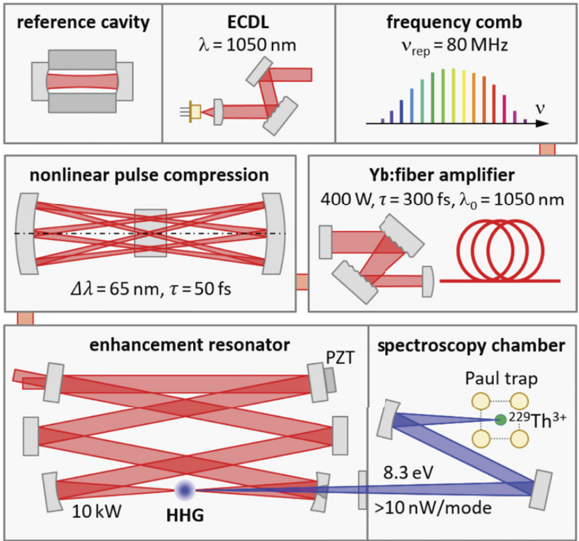
Figure 24 Sketch of the planned VUV frequency comb with an IR frequency comb stabilized to a reference cavity via an external-cavity diode laser, a high-power Yb:fibre amplifier, nonlinear pulse compression in a multi-pass scheme, and resonator-enhanced HHG in a gas target.
Figure 24 Sketch of the planned VUV frequency comb with an IR frequency comb stabilized to a reference cavity via an external-cavity diode laser, a high-power Yb:fibre amplifier, nonlinear pulse compression in a multi-pass scheme, and resonator-enhanced HHG in a gas target.CC-BY · From the PDF
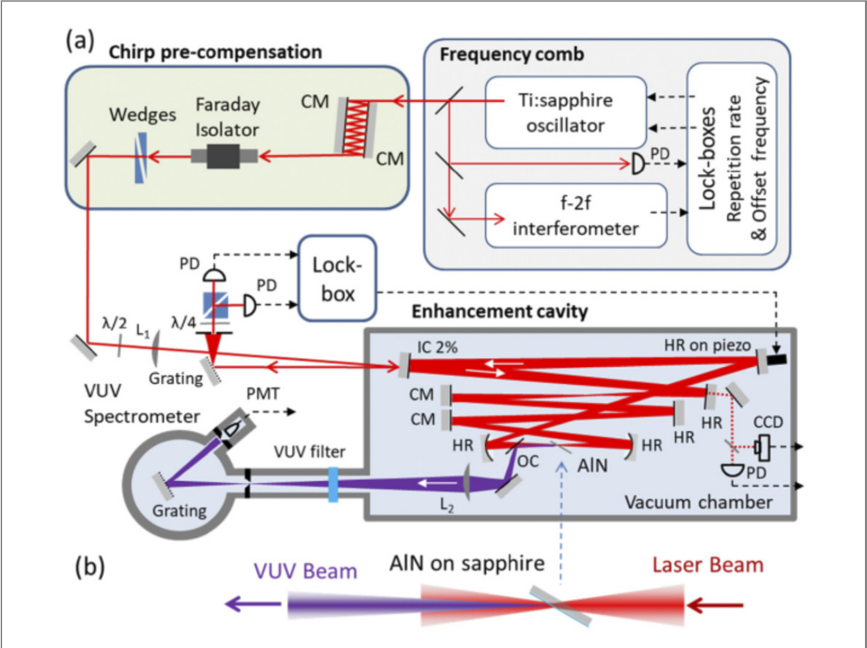
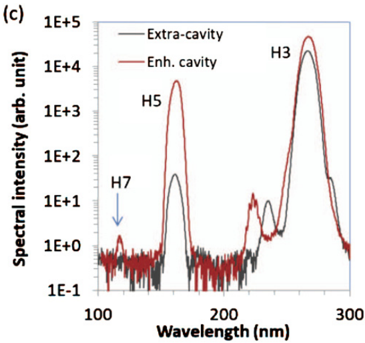
Figure 25 Schematic of the solid-state VUV frequency comb system (from [135] © 2019 Optical Society of America).
Figure 25 Schematic of the solid-state VUV frequency comb system (from [135] © 2019 Optical Society of America).CC-BY · From the PDF
Image 26
CC-BY · From the PDF
Image 27
CC-BY · From the PDF
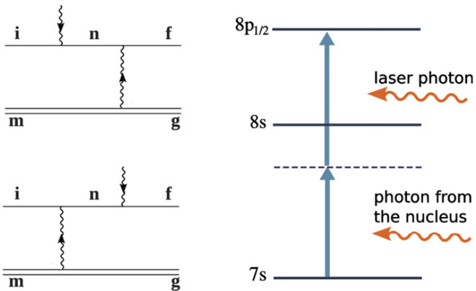
Figure 28 Example of the LIEB process (right) and its Feynman diagrams (left). The solid lines in the Feynman diagrams correspond to the electronic states, the double-lines represent the nuclear state and the wiggly lines depict the photons. Initial and final configurations are indicated by i and f respectively, g and m refer to ground and metastable state, and n indicates the intermediate/virtual state. Reproduced from [146]. CC BY 3.0. © 2018 The Author(s). Published by IOP Publishing Ltd on behalf of Deutsche Physikalische Gesellschaft.
Figure 28 Example of the LIEB process (right) and its Feynman diagrams (left). The solid lines in the Feynman diagrams correspond to the electronic states, the double-lines represent the nuclear state and the wiggly lines depict the photons. Initial and final configurations are indicated by i and f respectively, g and m refer to ground and metastable state, and n indicates the intermediate/virtual state. Reproduced from [146]. CC BY 3.0. © 2018 The Author(s). Published by IOP Publishing Ltd on behalf of Deutsche Physikalische Gesellschaft.CC-BY · From the PDF
Image 29
CC-BY · From the PDF
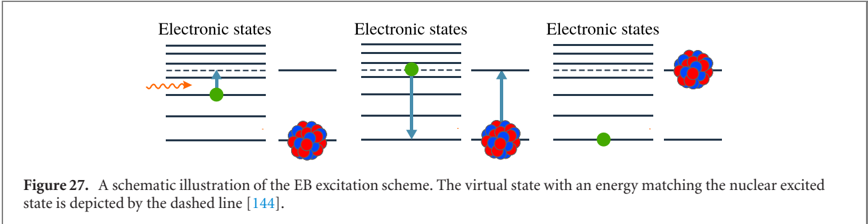
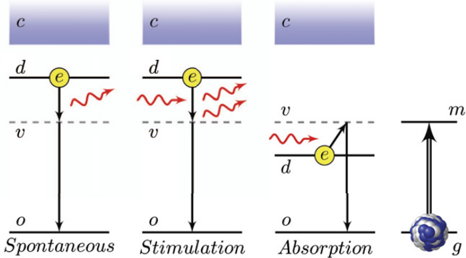
Figure 30 EB process for the excitation of 229m Th from the ground state g to the isomeric state m (right). The EB excitation can occur either spontaneously (left) or by stimulated absorption or emission (middle graphs) Reproduced from [148]. CC BY 4.0. © The Author(s), 2020.
Figure 30 EB process for the excitation of 229m Th from the ground state g to the isomeric state m (right). The EB excitation can occur either spontaneously (left) or by stimulated absorption or emission (middle graphs) Reproduced from [148]. CC BY 4.0. © The Author(s), 2020.CC-BY · From the PDF

Verification

Claims the paper makes

The claims and statistics of this paper haven’t been checked yet.

Free: it reads the open-access text and checks the first 5 claims that cite a source we can check. Create a free account to check every claim.

A few free checks a day · papers already verified open instantly · results are public

Claims other papers make about this one

Each is checked against this paper’s own text: does it say what the citing paper says it does?

Self-check

Percentages, sums and reported differences re-computed from the paper’s own numbers.

The self-check needs the paper’s full text.

Citations

Cites

Show all 183 references

Research works printed but not linked: 5

  1. Vorykhalov, 1995, Bull. Russ. Acad. Sci.: Phys., 59, 20
  2. Krutov, 1958, Bull. Acad. Sci. USSR, Phys. Ser., 22, 171
  3. Krutov, 1958, Bull. Acad. Sci. USSR, Phys. Ser., 22, 161
  4. Strizhov, 1991, Sov. Phys. - JETP, 72, 387
  5. Tkalya, 1992, Sov. Phys. - JETP, 75, 200

Cited by

See all 175

Metadata

Authors
Peik, E., Schumm, T., Safronova, M. S., Pálffy, A., Weitenberg, J., & Thirolf, P. G.
Affiliations
  • Physikalisch-Technische Bundesanstalt (DE)
  • TU Wien (AT)
  • University of Delaware (US)
  • Friedrich-Alexander-Universität Erlangen-Nürnberg (DE)
  • Max Planck Institute of Quantum Optics (DE)
  • Ludwig-Maximilians-Universität München (DE)
Corresponding author
Thirolf, P G
Venue
Quantum Science and Technology
Published
2021-04-15
Volume
6
Issue
3
Pages
034002
ISSN
2058-9565 (ISSN-L)
OpenAlex
W3135052081
Cited by
154
References
183
Citations by year
2026: 21 · 2025: 37 · 2024: 41 · 2023: 28 · 2022: 17 · 2021: 10
FWCI
10.48
Type
journal article
Language
en
Open access
Licence
Locations
  • Quantum Science and Technology (publishedVersion, cc-by)
  • OPUS FAU (Kooperativer Bibliotheksverbund Berlin-Brandenburg (KOBV), on behalf of the Universitätsbibliothek Erlangen-Nürnberg) (submittedVersion, cc-by)
Funders
  • European Association of National Metrology Institutes (EMPIR 17FUN07 ‘Coulomb Crystals for Clocks’)
  • H2020 European Research Council (Synergy grant ‘ThoriumNuclearClock’ Grant Agreemen)
  • Austrian Science Fund (P33627)
Topics
  • Physical Sciences › Physics and Astronomy › Atomic and Molecular Physics, and Optics › Advanced Frequency and Time Standards
  • Physical Sciences › Physics and Astronomy › Atomic and Molecular Physics, and Optics › Atomic and Molecular Physics
  • Physical Sciences › Physics and Astronomy › Nuclear and High Energy Physics › Nuclear physics research studies
Keywords
nuclear clock, thorium-229m, nuclear isomers, laser cooling of ions, fundamental physics tests, equivalence principle violation, beyond the Standard Model, dark matter searches, electron-nucleus interaction

About these checks

Registry, retraction, Cites and statistics results are computed, not judged, with one exception: a printed reference that no index lists is read once by a model before it counts as a citation error. Claims are extracted by a model and kept only when their quote appears verbatim in the text; each cited source is then checked, with a model’s help, for whether it says what the claim relies on. Those verdicts can be wrong — read the claim’s quote and the cited source before relying on one.

Statistics and arithmetic are recomputed, not judged.

Confidence bands are shown only for fields calibrated on our annotated test set. None is calibrated yet, so no band is shown.

What counts as a claim ›How we measure confidence ›How we check this ›

Are you an author, or do you see a problem with this page? Request a review

How to cite

Cite CoChat for the checks on this page, and the paper for its own findings.

This page
CoChat. (2026). Citation check: Nuclear clocks for testing fundamental physics. https://app.cochat.ai/papers/10.1088/2058-9565/abe9c2
The paper
Peik, E., Schumm, T., Safronova, M. S., Pálffy, A., Weitenberg, J., & Thirolf, P. G. (2021). Nuclear clocks for testing fundamental physics. Quantum Science and Technology. https://doi.org/10.1088/2058-9565/abe9c2

Data sources

Bibliographic data: Semantic Scholar, OpenAlex, Crossref.

Contains information from the Semantic Scholar Academic Graph Datasets, made available under the ODC Attribution License (ODC-BY 1.0).

Semantic Scholar’s data is described in: Kinney, R., et al. (2023). The Semantic Scholar Open Data Platform. arXiv:2301.10140.